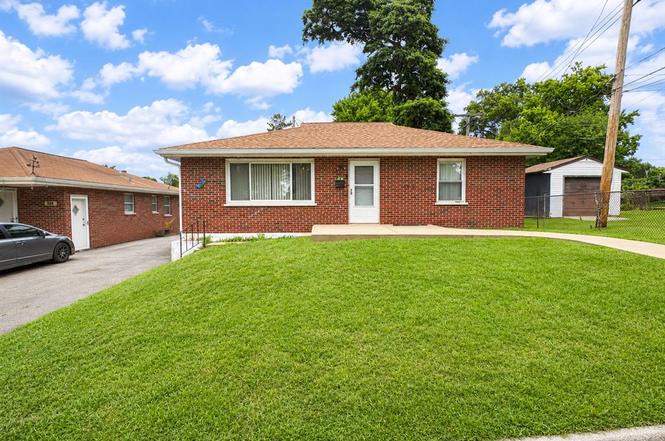
9301 Miriam Ave · Overland, MO
Flood risk 1/10 · Minimal
- FEMA flood zone
- X (unshaded)
- Chance of flooding over 30 yrs
- 0.0%
- Est. flood insurance / yr
- $473 – $860
Fire risk 1/10 · Minimal
- Est. fire insurance / yr
- $1,054 – $1,958
Heat risk 5/10 · Moderate
- Hot days now (above 107°F)
- 7 days/yr
- Hot days in 30 yrs
- 21 days/yr
Wind risk 2/10 · Minimal
- Chance of severe wind over 30 yrs
- 1.0%
Air-quality risk 2/10 · Minimal
- Unhealthy air days now
- 1 days/yr
- Unhealthy air days in 30 yrs
- 3 days/yr
Risk factors via First Street. Map © Google.
Why this score? — see what drove the D+ grade
The composite is a weighted blend of 9 inputs, each scored 0–100. Each bar is that input's sub-score; the figure is the points it added to the 100-point composite (weight × sub-score).
- Cash flow +15.5/30.0
- ARV discount +11.8/15.0
- DSCR +4.8/10.0
- 1% rule +3.8/10.0
- Livability +3.1/5.0
- Rent growth +3.0/5.0
- Condition / age +2.5/5.0
- Schools +1.7/10.0
- Appreciation +0.0/10.0
$155,000
🖨 Deal sheet (PDF) 📄 Offer letter ✓ Due diligence
Listing remarks
Smart buying starts here. This 3-bedroom, 1-bathroom home in Overland packs remarkable value into a price point that opens doors for first-time buyers, downsizers, and investors alike. At 1,008 square feet above grade, the main level delivers a functional layout where every room earns its keep. The real game-changer? A full basement that dramatically expands your usable square footage. Transform it into a recreation room, home office, personal gym, or workshop — the possibilities stretch as far as your imagination. For buyers calculating cost per square foot, this lower level represents hidden equity waiting to be unlocked through creative finishing or simple, practical use as generou
Key facts
- Personal gym
- Recreation room
- Generous storage
Tags
Property features AI
Finance
- Financial info: Tax year 2025
Exterior
- Parking: Shared driveway
- Utilities: Public water; Public sewer; Electric service (Ameren); Electricity connected; Natural gas connected; Sewer connected; Water connected
- Home design: Single-family residence; One story
- Construction: Brick construction; Shingle roof; Unfinished basement
- Exterior features: Located on a cul-de-sac; Near public transit; Shared driveway
Interior
- Bedrooms: Three bedrooms, all on the main level
- Bathrooms: One full bathroom on the main level
- Heating & cooling: Forced air heating; Central air conditioning
- Interior features: Basement (unfinished)
Neighborhood map
What this means for you Summary
Snapshot
- This is a 3-bed/1.0-bath single-family listed at $155k.
Deal economics
- At list price, monthly cash flow is $64 ($765/yr) — positive.
- The deal already cash-flows at list — no discount required.
- To meet the 1% rule (rent ≥ 1% of price), the offer needs to be $136k (12.4% below list).
- Recommended offer: $136k (12.4% below list) — sets the bar for 1% rule.
Location & tenants
- Location reads 61/100 on livability (#436 in MO) — a middle-class / working-renter tenant base. Strengths: cost of living A+, housing A+; Watch: health & safety C-, crime F, amenities F.
- Ritenour (suburban): math 13% / reading 27% proficiency, ranked #304 of 324 in MO (top 94%) — low school quality limits family demand, transient renter base, plan for 1-2y turnover; 66% free/reduced lunch — lower-income household profile, screen leases tightly.
- Zoned schools: Wyland Elem. (math 13% / reading 25%, grade F, #958 of 1,115 statewide, top 86%, 490 students, 99% FRL); Ritenour Middle (math 15% / reading 28%, grade F, #339 of 391 statewide, top 87%, 467 students, 99% FRL); Ritenour Sr. High (math 9% / reading 36%, grade F, #455 of 521 statewide, top 88%, 1,873 students, 100% FRL) — zoned schools average 100% FRL vs 66% district-wide (34 pts higher); higher-poverty schools than district average — tighter screening recommended.
- Market conditions: Rents rising (+2.0%/yr); 120 active listings in the ZIP; 13 comparable units currently listed for rent nearby; rentals at typical pace (median 26d on market — plan ~3-4 weeks tenant-placement turnaround); 920 units permitted in St. Louis County in 2024 (250 in 5+ unit buildings).
Forward outlook
- Local home prices are declining (-3.0%/yr); year-one equity from $1k of loan paydown is wiped out by about $5k of value loss. Plan a longer hold.
Negotiation context
- Only 3 days on market — expect competitive offers; lowballing is unlikely to land.
- Current owner paid $48k; list at $155k implies a 224% gain — meaningful room to come down on a strong offer.
Risks & watch-outs
- Watch-outs: built in 1955 — expect roof / HVAC / electrical / plumbing capex.
- Climate carrying-cost: extreme-heat days projected 7→21/yr by 2055 (HVAC capex compounding) — expect insurance premiums to compound above CPI over the hold.
Questions for the listing agent
- Built in 1955 — when were the roof, HVAC, electrical panel, plumbing, and water heater last replaced?
- Is there a deadline driving the sale (1031 exchange, divorce, estate, relocation)? That informs how much negotiation room exists.
- Schools are F-rated, which usually means shorter tenancies and higher turnover. Who's the typical renter profile here, and what's been the actual vacancy rate?
- Crime grade is F in this area — have there been break-ins, vandalism, or insurance claims at this property in the last 3 years? What carrier currently insures it and at what premium?
- The area grade is low — what's the realistic commute time and amenity access for the typical tenant pool here? Any planned neighborhood developments (good or bad) we should know about?
- What's the average days-on-market for RENTAL listings here right now (not sales)? A rising rental-DOM trend means longer vacancies and softer asking-rent achievability than the comps imply.
- What's the recent tenant-quality profile in this submarket — average credit score on applications, eviction rate, late-payment / NSF rate, and stable-employment percentage? A property-management company in the area should have these aggregated.
- How much new for-sale + rental construction is in the pipeline within 1–3 miles? Heavy new supply typically softens prices + rents 12–24 months out; constrained supply supports both.
Investment metrics
- 1% rule
- 0.88% ✗
- Cap rate
- 6.79%
- Cash-on-cash
- 1.76%
- DSCR
- 1.08
- GRM
- 9.5
CMA / ARV
- ARV (on-the-fly)
- $171,360
- Comps found
- 12
Show comp detail 12 sales within ~0.75 mi
| Address | Dist | Beds/Ba | Sqft | Sold | Price | $/sf | Match |
|---|---|---|---|---|---|---|---|
| 9446 Miriam Ave | 0.28mi | 2/1.0 (-1) | 1,017 (+1%) | 7mo | $129,000 | $127 | 74 |
| 1947 Brown Rd | 0.04mi | 3/1.0 | 1,147 (+14%) | 6mo | $159,000 | $139 | 70 |
| 9233 Meadowbrook Ln | 0.27mi | 2/1.0 (-1) | 864 (-14%) | 0mo | $159,900 | $185 | 58 |
| 9546 Theodosia Ave | 0.53mi | 3/1.0 | 884 (-12%) | 1mo | $185,000 | $209 | 54 |
| 9604 Ridge Ave | 0.58mi | 3/1.0 | 1,120 (+11%) | 1mo | $145,000 | $129 | 54 |
| 9608 Miriam Ave | 0.60mi | 3/1.0 | 888 (-12%) | 2mo | $189,900 | $214 | 50 |
| 2325 Goodale Ave | 0.44mi | 3/2.5 | 1,120 (+11%) | 7mo | $210,000 | $188 | 50 |
| 9509 Trescott Ave | 0.53mi | 2/2.0 (-1) | 912 (-10%) | 1mo | $140,000 | $154 | 49 |
| 2206 Wengler Ave | 0.45mi | 2/1.0 (-1) | 864 (-14%) | 2mo | $125,000 | $145 | 49 |
| 9518 Cote Brilliante Ave | 0.42mi | 2/1.0 (-1) | 864 (-14%) | 4mo | $142,500 | $165 | 49 |
| 9705 Miriam Ave | 0.66mi | 3/1.0 | 918 (-9%) | 7mo | $184,900 | $201 | 49 |
| 2327 Gaebler Ave | 0.58mi | 3/2.0 | 1,114 (+10%) | 7mo | $189,500 | $170 | 46 |
Match score weights: distance 35% · size 25% · config 20% · recency 20%. Top-matched comps best support the ARV.
Projected returns pro-forma
-3.0% appreciation · 2.04% rent growth · sell at horizon
- IRR
- -14.5%
- Equity multiple
- 0.48×
- Total profit
- $-22,373
- Equity at exit
- $23,111
- IRR
- -7.4%
- Equity multiple
- 0.55×
- Total profit
- $-19,554
- Equity at exit
- $13,402
Cash invested: $43,400 (down + closing). Projections, not guarantees.
Landlord ↔ Tenant lean methodology
- Overall (STATE)
- 81 Strongly Landlord-Friendly
- State Missouri
- 81 Strongly Landlord-Friendly · R+10
- County
- — inherits STATE
- City
- — inherits STATE
ZIP-level market 63114
- Rents YoY
- 2.0%
- Active inventory
- 120
- Price-to-rent
- 9.5×
Monthly cashflow live
- Estimated rent
- $1,358 high interval (Pro) →
- Mortgage (P&I)
- −$813
- Tax from tax record
- −$131 /mo · $1,576/yr
- Insurance
- −$65
- HOA
- −$0
- Vacancy / Maint / Mgmt
- −$285
- Net cashflow
- $64
Break-even live
Sensitivity live
| Price | -10% $151 | -5% $108 | +0% $64 | +5% $20 | +10% $-24 |
|---|---|---|---|---|---|
| Rent | -10% $-43 | -5% $10 | +0% $64 | +5% $117 | +10% $171 |
| Rate | -1.0pp $142 | -0.5pp $103 | base $64 | +0.5pp $24 | +1.0pp $-17 |
UW: 25.0% down · 7.5% · 30yr · 1.5% tax · 5.0% vac · 8.0% maint · 8.0% mgmt
Financing live
Cash to close
- Down payment
- $38,750
- Closing costs
- $4,650
- Reserves months
- —
- Total cash needed
- —
Loan-product check · same deal, 3 products live
Conventional
25% down · 7.5% · 30yr
- Down + closing
- —
- Monthly P&I
- —
- Monthly cashflow
- —
- DSCR
- —
- Eligible?
- —
Personal DTI + credit; lowest rate.
DSCR
20% down · 8.5% · 30yr
- Down + closing
- —
- Monthly P&I
- —
- Monthly cashflow
- —
- DSCR
- —
- Eligible?
- —
No personal income docs; deal must DSCR.
Hard money
10% down · 12.0% · 12mo
- Down + closing
- —
- Monthly P&I
- —
- Monthly cashflow
- —
- DSCR
- —
- Eligible?
- —
Short-term bridge; refi at stabilization.
Rent comps 13 comps
| Address | Beds | Baths | Sqft | Rent | $/sqft | DOM | Units | Dist |
|---|---|---|---|---|---|---|---|---|
| 2201 Gaebler Ave Unit A Overland, MO | 2.0 | 1.0 | 710 | $1,250 | $1.76 | 25d | 1 | 0.32mi |
| 2201 Gaebler Ave Unit 1 Overland, MO | 2.0 | 1.0 | 750 | $1,300 | $1.73 | 0d | 1 | 0.32mi |
| 8246 Montreal Dr Saint Louis, MO | 2.0 | 1.0 | 850 | $1,450 | $1.71 | 45d | 1 | 0.88mi |
| 2452 Ashland Ave Saint Louis, MO | 2.0 | 1.0 | 1028 | $1,350 | $1.31 | 45d | 1 | 0.99mi |
| 9905 Iveland Dr Saint Louis, MO | 2.0 | 1.0 | 816 | $1,370 | $1.68 | 4d | 1 | 1.05mi |
| 1150 N Price Rd St. Louis, MO | 1.0–3.0 | 1.0–2.0 | 999 | $3,731 | $3.73 | 0d | 150 | 1.06mi |
| 8303 Braddock Dr Saint Louis, MO | 2.0 | 1.0 | 720 | $1,075 | $1.49 | 25d | 1 | 1.07mi |
| 8449 Atherton Dr St. Louis, MO | 1.0–2.0 | 1.0 | 900 | $1,245 | $1.38 | 4d | 2 | 1.25mi |
| 2732 Annapolis Ave Saint Louis, MO | 2.0 | 1.0 | 768 | $1,250 | $1.63 | 45d | 1 | 1.27mi |
| 1276 Vaughan Dr Saint Louis, MO | 2.0 | 1.0 | 825 | $1,100 | $1.33 | 18d | 1 | 1.29mi |
| 9429 Baltimore Ave Saint Louis, MO | 2.0 | 1.0 | 900 | $1,200 | $1.33 | 25d | 1 | 1.32mi |
| 9429 Baltimore Ave Saint Louis, MO | 2.0 | 1.0 | 900 | $1,200 | $1.33 | 0d | 1 | 1.32mi |
| 9535 Baltimore Ave Saint Louis, MO | 2.0 | 1.0 | 800 | $1,145 | $1.43 | 25d | 1 | 1.37mi |
Listing history 3 events
-
2026-06-21days on market $155,000 Coming Soon 3 DOM
-
2026-06-19remarks 693-char remark
-
2026-06-19$155,000 Coming Soon 1 DOM
ⓘ Source: listings_history table (triggers on properties + properties_extension) + one-shot
backfill from property_details.listing_events for pre-trigger history.
Tax reassessment forecast MO · Resets to sale price
- Current annual tax
- $1,576 · $131/mo
- Projected year-2 tax
- $1,576 · $131/mo
- Expected delta
- $0/yr ($0/mo · 0.0%)
ⓘ Screening estimate from a state-policy table — verify with the county assessor before closing.
Climate risk First Street
- Flood 1/10 Low FEMA zone X (unshaded) · 0% chance over 30 yrs
- Wildfire 1/10 Low
- Heat 5/10 Major 7 d/yr ≥107°F today · 21 d/yr by 30 yrs out
- Wind 2/10 Low 100% chance of damaging wind over 30 yrs
- Air quality 2/10 Low 1 unhealthy d/yr today · 3 by 30 yrs out
Nearby sold comps map
Loading sold comps map…
Walkable amenities ~0.75 mi
Loading nearby amenities…
Taxation est. · year 1
- Rental income
- $16,291
- − Mortgage interest
- −$8,682
- − Property taxes
- −$1,576
- − Insurance
- −$775
- − Repairs & maintenance
- −$1,303
- − Management
- −$1,303
- − Depreciation
- −$4,509
- Taxable loss
- −$1,858
- Est. tax savings @ 24.0%
- +$446
- After-tax cash flow
- $1,211/yr
For passive investors: Depreciation is non-cash, so a rental often shows a tax loss while cash-flowing — sheltering income. Rental losses are passive: they offset passive income freely, and up to $25,000/yr can offset ordinary (W-2) income if you actively participate and your MAGI is under $100k (phasing out to $0 by $150k); unused losses carry forward. On sale, claimed depreciation is recaptured at up to 25%, and gains may owe capital-gains tax (a 1031 exchange can defer both). Figures are a year-1 estimate at your 24.0% rate — not tax advice; consult a CPA.
Schools (NCES district)
- District
- Ritenour
- NCES district ID
- 2926640
- Math proficiency
- 13% ▼ -14.00%
- Reading proficiency
- 27% ▼ -7.00%
- Median HH income
- $41,410
- Composite
- 17.04/100
- National rank
- #9125
- State rank
- #304 of 324 in MO
Livability — Overland
- Score
- 61/100
- State rank
- #436
- US rank
- #17870
Category grades
Schools grade is shown separately in the Schools card above.
Census & demographics
- Census place
- Overland, MO
- County
- Saint Louis County · 888,823 people
- City population
- 33,969
- Metro
- St. Louis, MO-IL
- Population (ZIP)
- 33,969
- Household income
- $55,870
- Rent vs Own
- Severe rent burden
- 1595.0
Population outlook (St. Louis County) Hauer SSP2
- Today (2025)
- 1,025,227 people
- By 2030
- 1,028,023 · +0.3%
- By 2040
- 1,020,940 · -0.4%
- By 2050
- 1,007,280 · -1.8%
- By 2075
- 987,277 · -3.7%
- By 2100
- 921,984 · -10.1%
Race, ethnicity, and origin ACS 2023
- Neighborhood character
- Diverse neighborhood (Simpson 0.64)
- Race & ethnicity
- White 50% Black 30% Hispanic / Latino 11% Two or more races 6% Asian 2%
- Hispanic origin (detail)
- Mexican 7%
- Common ancestry
- Lithuanian 3% Italian 2% Romanian 1%
- Foreign-born
- 9% · Canada, Vietnam
- Languages at home
- 84% English-only · Spanish 10% French/Haitian/Cajun 2% Tagalog/Filipino 1%
Political lean MEDSL · St. Louis
- 2024 margin
- Strong D (+23.4) · D 60.8% · R 37.4% · Other 1.7%
- 2008→2024 swing
- +3.5pp toward D · 2008: 19.9pp · 2024: 23.4pp
- All cycles
- 2024: D+23.4 2020: D+24.0 2016: D+16.2 2012: D+13.7 2008: D+19.9
Not yet ingested
- Civics
- —
Market trends
- HPI YoY
- ▼ -276.62%
- Current HPI
- 223.9305
- Rent YoY
- ▲ 2.04%
- Metro
- St. Louis, MO-IL
- State GDP YoY
- ▲ 1.84%
- F500 in state
- 20
Industry mix (Fortune 500 HQ in MO)
| Industry | F500 HQs | Revenue |
|---|---|---|
| Healthcare | 1 | $163B |
|
||
| Insurance | 1 | $21B |
|
||
| Industrial Technology | 1 | $17B |
|
||
| Retail | 1 | $16B |
|
||
| Industrial Distribution | 1 | $10B |
|
||
| Utilities | 1 | $9B |
|
||
Price history
+223.6% since first listed2 events — show timeline
- 2026-06-18 Coming Soon $155,000 MARIS as Distributed by MLS Grid
- 1986-10-01 Sold (Public Records) $47,900 Public Records
Property tax history
-0.3%/yrLatest (2022): $1,576 · +0.0% YoY. Source: county tax records.
Cash-flow waterfall
monthlySold comps — $/sqft
last 12 mo · ≤1 miLoading sold comps…