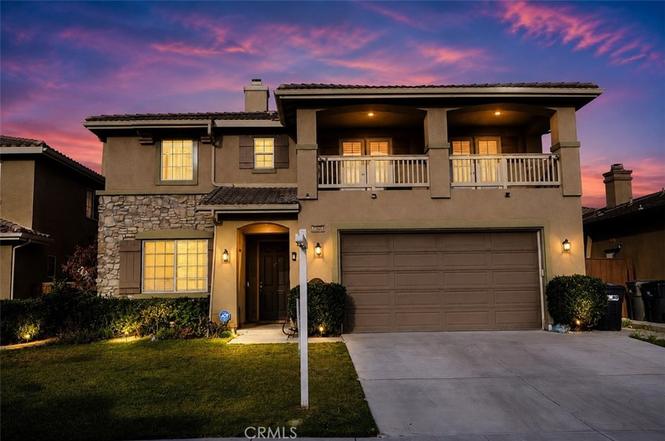
35612 Loggins Ct · French Valley, CA
Flood risk 5/10 · Moderate
- FEMA flood zone
- D
- Chance of flooding over 30 yrs
- 0.48%
- Est. flood insurance / yr
- $544 – $1,084
Fire risk 6/10 · Moderate
- Est. fire insurance / yr
- $659 – $1,223
Heat risk 7/10 · Major
- Hot days now (above 104°F)
- 4 days/yr
- Hot days in 30 yrs
- 12 days/yr
Wind risk 1/10 · Minimal
- Chance of severe wind over 30 yrs
- —
Air-quality risk 4/10 · Minor
- Unhealthy air days now
- 6 days/yr
- Unhealthy air days in 30 yrs
- 7 days/yr
Risk factors via First Street. Map © Google.
Why this score? — see what drove the D- grade
The composite is a weighted blend of 9 inputs, each scored 0–100. Each bar is that input's sub-score; the figure is the points it added to the 100-point composite (weight × sub-score).
- Appreciation +10.0/10.0
- ARV discount +9.2/15.0
- Schools +5.7/10.0
- Cash flow +5.6/30.0
- Livability +3.0/5.0
- Condition / age +2.5/5.0
- Rent growth +2.3/5.0
- 1% rule +0.7/10.0
- DSCR +0.0/10.0
$650,000
🖨 Deal sheet 📄 Offer letter ✓ Due diligence
Listing remarks MLS
Beautifully 4 bedroom/3 bath appointed home in Winchester located in a cul-de-sac offers a TURN KEY and MOVE IN ready experience. Recent upgrades include gorgeous luxury vinyl plank flooring throughout including the stairs, quartz countertops and backsplash, new carpet in the upstairs living area, new vanity in the downstairs bathroom, stainless steel appliances, tile flooring in the bathrooms, new paint throughout the home. Leased solar for those warm summer nights. Three car tandem garage with epoxy flooring. There is a downstairs bedroom with a full bath for guests. The master suite includes a master retreat for a home office. Close to shopping, restaurants, walking distance to playgrounds, Temecula schools and very low HOA and taxes. A must see!
Key facts
- 4,792 sq ft lot
- 3 garage spots
- Built 2006
Property features AI
Finance
- Other: No common walls (detached); Single-family residence (1 total unit); Lot described as 0-1 unit/acre
- Financial info:
- HOA & community: Part of the Dutch Village association; Monthly association fee of $10; Suburban community
Exterior
- Parking: Attached garage with 3 parking spaces
- Security:
- Utilities: Public/District water; Sewer or septic - unknown
- Home design: Two-story house; No accessory dwelling unit
- Construction: Year built per public records
- Exterior features: House; No pool
Interior
- Kitchen:
- Bedrooms: Main floor bedroom
- Flooring:
- Bathrooms: 3 full bathrooms; One bathroom on the main level
- Heating & cooling: Central furnace heating; Central air conditioning
- Interior features: Two levels; Main floor bedroom; Loft
- Laundry & utility: Laundry inside the home
Neighborhood map
What this means for you Summary
Snapshot
- This is a 3-bed/2.5-bath single-family listed at $650k.
Deal economics
- At list price, monthly cash flow is $-1k ($-16k/yr) — negative.
- To cash-flow at today's rent, offer at most $411k (36.8% below list).
- To meet the 1% rule (rent ≥ 1% of price), the offer needs to be $372k (42.7% below list).
- Recommended offer: $372k (42.7% below list) — sets the bar for 1% rule.
Location & tenants
- Location reads 59/100 on livability (#655 in CA) — a working-class tenant base; expect higher turnover. Strengths: employment A+, housing A+; Watch: schools D-, crime D-, amenities F.
- Temecula Valley Unified (urban): math 55% / reading 69% proficiency, ranked #173 of 1,400 in CA (top 12%) — acceptable for families but not a draw, mixed tenant base, ~2y average lease; only 17% free/reduced lunch — higher-income household profile.
- Market conditions: Rents soft (-0.8%/yr); 355 active listings in the ZIP; 7 comparable units currently listed for rent nearby; rentals at typical pace (median 18d on market — plan ~3-4 weeks tenant-placement turnaround); 43% of comp listings sitting > 30 days — soft ceiling on asking rent; high-income renter base; 9,195 units permitted in Riverside County in 2024 (1,512 in 5+ unit buildings).
- This rent runs 34% of the median local income ($133k/yr) — at the standard rent-burdened threshold; future hikes will face affordability resistance.
Forward outlook
- In year one you build about $69k of equity ($4k loan paydown + $65k appreciation (10.0% local appreciation)).
- Riverside County population projected at +22% by 2050 — long-run rental-demand tailwind backs the buy-and-hold thesis.
- By year 2, paydown + projected appreciation supports a ~$112k cash-out refi (75% LTV) — recoverable capital for the next deal without selling this one.
Negotiation context
- Only 7 days on market — expect competitive offers; lowballing is unlikely to land.
- 7 sale attempts since 18y ago with the ask held roughly flat each time — persistent listings suggest the price (not the market) is what's stuck; bring a comps-based counter.
Risks & watch-outs
- Climate carrying-cost: moderate flood risk; major wildfire risk; extreme-heat days projected 4→12/yr by 2055 (HVAC capex compounding) — expect insurance premiums to compound above CPI over the hold.
Questions for the listing agent
- What do current leases actually rent for vs. the listed asking? Can we see a recent rent roll and the last 12 months of T-12 income?
- What does the HOA fee cover, when was the last increase, and are there any pending special assessments or reserve-fund shortfalls?
- Is there a deadline driving the sale (1031 exchange, divorce, estate, relocation)? That informs how much negotiation room exists.
- Schools are D-rated, which usually means shorter tenancies and higher turnover. Who's the typical renter profile here, and what's been the actual vacancy rate?
- Crime grade is D in this area — have there been break-ins, vandalism, or insurance claims at this property in the last 3 years? What carrier currently insures it and at what premium?
- The area grade is low — what's the realistic commute time and amenity access for the typical tenant pool here? Any planned neighborhood developments (good or bad) we should know about?
- What's the average days-on-market for RENTAL listings here right now (not sales)? A rising rental-DOM trend means longer vacancies and softer asking-rent achievability than the comps imply.
- What's the recent tenant-quality profile in this submarket — average credit score on applications, eviction rate, late-payment / NSF rate, and stable-employment percentage? A property-management company in the area should have these aggregated.
- How much new for-sale + rental construction is in the pipeline within 1–3 miles? Heavy new supply typically softens prices + rents 12–24 months out; constrained supply supports both.
Investment metrics
- 1% rule
- 0.57% ✗
- Cap rate
- 3.79%
- Cash-on-cash
- -8.94%
- DSCR
- 0.60
- GRM
- 14.5
CMA / ARV
- ARV (on-the-fly)
- $675,729
- Comps found
- 12
Show comp detail 12 sales within ~0.75 mi
| Address | Dist | Beds/Ba | Sqft | Sold | Price | $/sf | Match |
|---|---|---|---|---|---|---|---|
| 35610 Denver | 0.05mi | 4/2.5 (+1) | 2,743 (+6%) | 3mo | $680,000 | $248 | 80 |
| 31363 Mccartney Dr | 0.10mi | 4/3.0 (+1) | 2,345 (-9%) | 0mo | $610,000 | $260 | 72 |
| 36035 Pepperdine Ct | 0.72mi | 4/2.5 (+1) | 2,628 (+2%) | 1mo | $879,900 | $335 | 58 |
| 31561 Anzio | 0.72mi | 4/3.0 (+1) | 2,492 (-4%) | 0mo | $604,750 | $243 | 53 |
| 35430 Azalea | 0.38mi | 4/3.0 (+1) | 2,922 (+13%) | 3mo | $755,000 | $258 | 52 |
| 34923 Kooden Rd | 0.69mi | 3/2.5 | 2,320 (-10%) | 1mo | $605,000 | $261 | 50 |
| 32101 Daisy Dr | 0.74mi | 4/3.0 (+1) | 2,740 (+6%) | 1mo | $715,000 | $261 | 48 |
| 35078 Waimea | 0.46mi | 4/2.5 (+1) | 2,217 (-14%) | 2mo | $628,000 | $283 | 48 |
| 32185 Bandelier | 0.74mi | 4/3.5 (+1) | 2,712 (+5%) | 3mo | $722,000 | $266 | 46 |
| 35330 Mayapple Ct | 0.66mi | 4/3.0 (+1) | 2,339 (-10%) | 2mo | $755,000 | $323 | 44 |
| 31961 Honeysuckle Cir | 0.72mi | 4/3.0 (+1) | 2,877 (+11%) | 1mo | $675,000 | $235 | 40 |
| 35253 Goldthread Ln | 0.62mi | 4/2.0 (+1) | 2,214 (-14%) | 3mo | $717,000 | $324 | 37 |
Match score weights: distance 35% · size 25% · config 20% · recency 20%. Top-matched comps best support the ARV.
Projected returns pro-forma
10.0% appreciation · 0.0% rent growth · sell at horizon
- IRR
- 17.3%
- Equity multiple
- 2.41×
- Total profit
- $256,685
- Equity at exit
- $585,571
- IRR
- 15.9%
- Equity multiple
- 5.42×
- Total profit
- $804,126
- Equity at exit
- $1,262,807
Cash invested: $182,000 (down + closing). Projections, not guarantees.
Landlord ↔ Tenant lean methodology
- Overall (STATE)
- 18 Strongly Tenant-Friendly
- State California
- 18 Strongly Tenant-Friendly · D+13
- County
- — inherits STATE
- City
- — inherits STATE
ZIP-level market 92596
- Home prices YoY
- 3.9%
- Rents YoY
- -0.8%
- Active inventory
- 355
- Price-to-rent
- 14.5×
Monthly cashflow live
- Estimated rent
- $3,724 high interval (Pro) →
- Mortgage (P&I)
- −$3,409
- Tax from tax record
- −$608 /mo · $7,301/yr
- Insurance
- −$271
- HOA
- −$10
- Vacancy / Maint / Mgmt
- −$782
- Net cashflow
- $-1,356
Break-even live
UW: 25.0% down · 7.5% · 30yr · 1.5% tax · 5.0% vac · 8.0% maint · 8.0% mgmt
Financing live
Cash to close
- Down payment
- $162,500
- Closing costs
- $19,500
- Reserves months
- —
- Total cash needed
- —
Loan-product check · same deal, 3 products live
Conventional
25% down · 7.5% · 30yr
- Down + closing
- —
- Monthly P&I
- —
- Monthly cashflow
- —
- DSCR
- —
- Eligible?
- —
Personal DTI + credit; lowest rate.
DSCR
20% down · 8.5% · 30yr
- Down + closing
- —
- Monthly P&I
- —
- Monthly cashflow
- —
- DSCR
- —
- Eligible?
- —
No personal income docs; deal must DSCR.
Hard money
10% down · 12.0% · 12mo
- Down + closing
- —
- Monthly P&I
- —
- Monthly cashflow
- —
- DSCR
- —
- Eligible?
- —
Short-term bridge; refi at stabilization.
Rent comps 7 comps
| Address | Beds | Baths | Sqft | Rent | $/sqft | DOM | Units | Dist |
|---|---|---|---|---|---|---|---|---|
| 35350 Marabella Ct Unit 35350 Winchester, CA | 3.0 | 2.5 | 1925 | $3,300 | $1.71 | 1d | 1 | 0.21mi |
| 36264 Capri Dr Winchester, CA | 4.0 | 2.5 | 1999 | $3,300 | $1.65 | 18d | 1 | 0.70mi |
| 34715 Ribbon Grass Way Murrieta, CA | 4.0 | 3.0 | 2319 | $3,800 | $1.64 | 1d | 1 | 1.05mi |
| 30508 Copper Rose Dr Murrieta, CA | 4.0 | 3.5 | 3200 | $4,100 | $1.28 | 43d | 1 | 1.06mi |
| 34806 Wind Poppy Way Murrieta, CA | 4.0 | 2.5 | 3321 | $3,900 | $1.17 | 12d | 1 | 1.22mi |
| 34580 Sourwood Way Winchester, CA | 4.0 | 3.0 | 2800 | $3,200 | $1.14 | 43d | 1 | 1.35mi |
| 32689 Cottonwood Rd Winchester, CA | 4.0 | 2.5 | 3157 | $4,100 | $1.30 | 43d | 1 | 1.46mi |
HOA detail
- Monthly dues
- $10 · $120/yr
- Likely covers
- landscaping
Listing history 5 events
-
2026-06-18days on market $650,000 Coming Soon 7 DOM
-
2026-06-17days on market $650,000 Coming Soon 6 DOM
-
2026-06-16days on market $650,000 Coming Soon 5 DOM
-
2026-06-15days on market $650,000 Coming Soon 4 DOM
-
2026-06-13$650,000 Coming Soon 2 DOM
ⓘ Source: listings_history table (triggers on properties + properties_extension) + one-shot
backfill from property_details.listing_events for pre-trigger history.
Tax reassessment forecast CA · Resets to sale price
- Current annual tax
- $7,301 · $608/mo
- Projected year-2 tax
- $7,301 · $608/mo
- Expected delta
- $0/yr ($0/mo · 0.0%)
ⓘ Screening estimate from a state-policy table — verify with the county assessor before closing.
Climate risk First Street
- Flood 5/10 Major FEMA zone D · 48% chance over 30 yrs
- Wildfire 6/10 Major
- Heat 7/10 Severe 4 d/yr ≥104°F today · 12 d/yr by 30 yrs out
- Wind 1/10 Low
- Air quality 4/10 Moderate 6 unhealthy d/yr today · 7 by 30 yrs out
Nearby sold comps map
Loading sold comps map…
Walkable amenities ~0.75 mi
Loading nearby amenities…
Taxation est. · year 1
- Rental income
- $44,692
- − Mortgage interest
- −$36,410
- − Property taxes
- −$7,301
- − Insurance
- −$3,250
- − Repairs & maintenance
- −$3,575
- − Management
- −$3,575
- − HOA
- −$120
- − Depreciation
- −$18,909
- Taxable loss
- −$28,449
- Est. tax savings @ 24.0%
- +$6,828
- After-tax cash flow
- $-9,441/yr
For passive investors: Depreciation is non-cash, so a rental often shows a tax loss while cash-flowing — sheltering income. Rental losses are passive: they offset passive income freely, and up to $25,000/yr can offset ordinary (W-2) income if you actively participate and your MAGI is under $100k (phasing out to $0 by $150k); unused losses carry forward. On sale, claimed depreciation is recaptured at up to 25%, and gains may owe capital-gains tax (a 1031 exchange can defer both). Figures are a year-1 estimate at your 24.0% rate — not tax advice; consult a CPA.
Schools (NCES district)
- District
- Temecula Valley Unified
- NCES district ID
- 0600028
- Math proficiency
- 55% ▲ 1.00%
- Reading proficiency
- 69% ▲ 1.00%
- Median HH income
- $84,032
- Composite
- 57.48/100
- National rank
- #2264
- State rank
- #173 of 1400 in CA
Livability — French Valley
- Score
- 59/100
- State rank
- #655
- US rank
- #20351
Category grades
Schools grade is shown separately in the Schools card above.
Census & demographics
- Census place
- French Valley, CA
- County
- Riverside County · 2,287,001 people
- Metro
- Riverside-San Bernardino-Ontario, CA
- Population (ZIP)
- 38,981
- Household income
- $132,538
- Rent vs Own
- Severe rent burden
- 591.0
Population outlook (Riverside County) Hauer SSP2
- Today (2025)
- 2,664,475 people
- By 2030
- 2,802,692 · +5.2%
- By 2040
- 3,050,904 · +14.5%
- By 2050
- 3,256,783 · +22.2%
- By 2075
- 3,655,058 · +37.2%
- By 2100
- 3,766,594 · +41.4%
Race, ethnicity, and origin ACS 2023
- Neighborhood character
- Highly diverse neighborhood (Simpson 0.72)
- Race & ethnicity
- White 38% Hispanic / Latino 34% Two or more races 16% Asian 12% Black 6% Pacific Islander 2%
- Hispanic origin (detail)
- Mexican 29%
- Common ancestry
- Slovak 3% Italian 2% Portuguese 1%
- Foreign-born
- 14% · Canada, Vietnam
- Languages at home
- 76% English-only · Spanish 16% Tagalog/Filipino 4% Vietnamese 1%
Political lean MEDSL · Riverside
- 2024 margin
- Toss-up / Even · D 48.0% · R 49.3% · Other 2.6%
- 2008→2024 swing
- -3.6pp toward R · 2008: 2.3pp · 2024: -1.3pp
- All cycles
- 2024: R+1.3 2020: D+8.0 2016: D+4.3 2012: R+0.4 2008: D+2.3
Not yet ingested
- Civics
- —
Market trends
- HPI YoY
- ▲ 12.43%
- Current HPI
- 332.169
- Rent YoY
- ▼ -0.79%
- Metro
- Riverside-San Bernardino-Ontario, CA
- State GDP YoY
- ▲ 3.21%
- F500 in state
- 116
Industry mix (Fortune 500 HQ in CA)
| Industry | F500 HQs | Revenue |
|---|---|---|
| Technology | 27 | $1,492B |
|
||
| Financial Services | 3 | $174B |
|
||
| Retail | 3 | $44B |
|
||
| Insurance | 3 | $26B |
|
||
| Media / Entertainment | 2 | $115B |
|
||
| Pharmaceuticals / Biotech | 2 | $62B |
|
||
Price history
+183.8% since first listed32 events — show timeline
- 2026-06-12 Coming Soon $650,000 CRMLS
- 2022-05-31 Sold (Public Records) $645,000 Public Records
- 2022-05-31 Sold (MLS) $645,000 SDMLS
- 2022-05-11 Pending — SDMLS
- 2022-05-07 Price Changed $599,900 SDMLS
- 2022-04-21 Listed $649,900 SDMLS
- 2022-04-14 Coming Soon $649,900 SDMLS
- 2019-12-23 Sold (Public Records) $420,000 Public Records
- 2019-12-23 Sold (MLS) $419,900 CRMLS
- 2019-11-06 Contingent — CRMLS
- 2019-10-21 Price Changed $419,900 CRMLS
- 2019-09-27 Price Changed $429,900 CRMLS
- 2019-08-27 Listed $439,900 CRMLS
- 2013-06-21 Sold (Public Records) $325,000 Public Records
- 2013-06-21 Sold (MLS) $325,000 CRMLS
- 2013-06-19 Pending — CRMLS
- 2013-05-23 Pending — CRMLS
- 2013-05-17 Listed $310,000 CRMLS
- 2009-06-30 Sold (Public Records) $223,500 Public Records
- 2009-06-30 Sold (MLS) $223,500 CRMLS
- 2009-03-06 Listing Removed — CRMLS
- 2009-02-20 Listing Removed — CRMLS
- 2009-02-18 Price Changed $229,000 SDMLS
- 2009-02-15 Listed $225,000 CRMLS
- 2009-02-10 Relisted — CRMLS
- 2009-01-30 Listing Removed — CRMLS
- 2009-01-05 Price Changed $205,000 CRMLS
- 2008-12-13 Price Changed $209,000 CRMLS
- 2008-10-30 Price Changed $229,000 CRMLS
- 2008-10-25 Price Changed $235,000 CRMLS
- 2008-10-07 Listed $255,000 CRMLS
- 2008-10-07 Listed $229,000 CRMLS
Property tax history
+0.9%/yrLatest (2025): $7,301 · -20.1% YoY. Source: county tax records.
Cash-flow waterfall
monthlySold comps — $/sqft
last 12 mo · ≤1 miLoading sold comps…