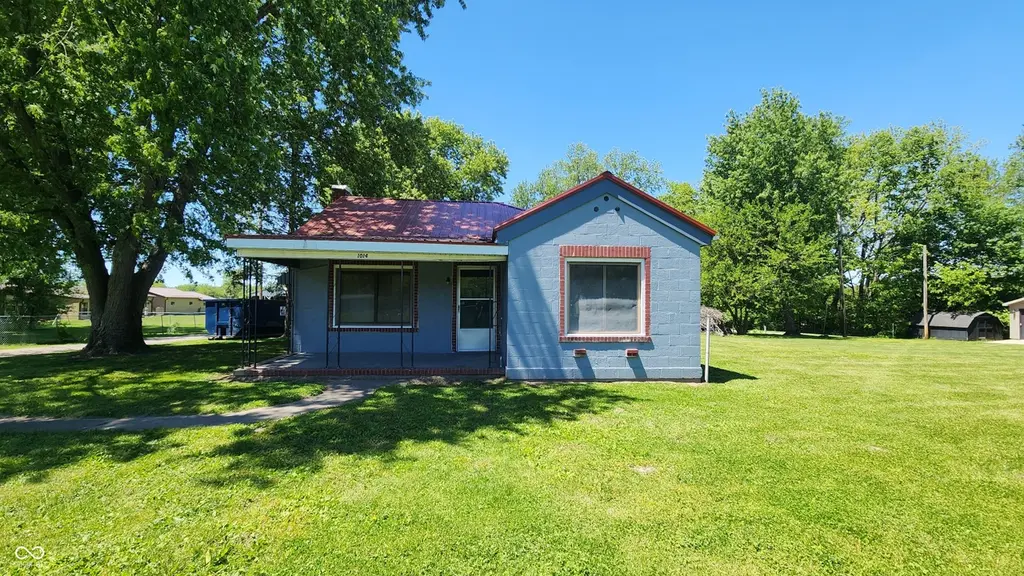
1014 N Sterling Ave · Veedersburg, IN
Flood risk 1/10 · Minimal
- FEMA flood zone
- X (unshaded)
- Chance of flooding over 30 yrs
- 0.0%
- Est. flood insurance / yr
- $473 – $860
Fire risk 1/10 · Minimal
- Est. fire insurance / yr
- $717 – $1,331
Heat risk 3/10 · Minor
- Hot days now (above 102°F)
- 7 days/yr
- Hot days in 30 yrs
- 18 days/yr
Wind risk 2/10 · Minimal
- Chance of severe wind over 30 yrs
- 1.0%
Air-quality risk 3/10 · Minor
- Unhealthy air days now
- 2 days/yr
- Unhealthy air days in 30 yrs
- 3 days/yr
Risk factors via First Street. Map © Google.
Why this score? — see what drove the D+ grade
The composite is a weighted blend of 9 inputs, each scored 0–100. Each bar is that input's sub-score; the figure is the points it added to the 100-point composite (weight × sub-score).
- ARV discount +15.0/15.0
- Appreciation +10.0/10.0
- Cash flow +8.5/30.0
- Schools +3.3/10.0
- Livability +3.2/5.0
- Rent growth +2.5/5.0
- Condition / age +2.5/5.0
- DSCR +2.3/10.0
- 1% rule +1.6/10.0
$114,900
🖨 Deal sheet 📄 Offer letter ✓ Due diligence
Listing remarks
Adorable block home featuring a striking red roof and a spacious yard. This home offers 2 bedrooms, with one bedroom lacking a closet but easily accommodating a portable closet or dresser. The charming arched doorways add character throughout the home, as does the hardwood flooring in the kitchen. The full basement provides ample storage space. The oversized 2-car garage provides a great workshop area. Located just north of a year-round restaurant and not far from the I-74 exit.
Key facts
- Spacious yard
- Hardwood flooring
- Workshop area
Tags
Property features AI
Exterior
- Parking: Detached 2-car garage (approx. 572 sq ft)
- Utilities: Public water; Municipal sewer connected; No solid waste service listed
- Home design: Single family residence; One story
- Construction: Block foundation; Block construction
- Exterior features: Corner lot; Mature trees; 0.4-acre lot
Interior
- Kitchen: Electric oven; Refrigerator; Eat-in kitchen
- Bedrooms: 2 bedrooms (both on the main level)
- Flooring: Hardwood floors
- Bathrooms: 1 full bathroom (main level)
- Heating & cooling: Forced air heating; Central air conditioning
- Interior features: Hardwood floors; Eat-in kitchen
- Laundry & utility: Laundry located in basement; Gas water heater
Neighborhood map
What this means for you Summary
Snapshot
- This is a 2-bed/1.0-bath single-family listed at $115k.
Deal economics
- At list price, monthly cash flow is $-102 ($-1k/yr) — negative.
- To cash-flow at today's rent, offer at most $97k (15.6% below list).
- To meet the 1% rule (rent ≥ 1% of price), the offer needs to be $75k (34.5% below list).
- Recommended offer: $75k (34.5% below list) — sets the bar for 1% rule.
Location & tenants
- Location reads 64/100 on livability (#395 in IN) — a middle-class / working-renter tenant base. Strengths: crime A+, cost of living A+, housing A+; Watch: schools D-, amenities F, commute F.
- Southeast Fountain School Corporation (rural): math 34% / reading 43% proficiency, ranked #163 of 301 in IN (top 54%) — families likely to look elsewhere, expect single-tenant / working-renter base with shorter leases.
- Market conditions: 21 active listings in the ZIP; 2 comparable units currently listed for rent nearby; 19 units permitted in Fountain County in 2024 (0 in 5+ unit buildings).
Forward outlook
- In year one you build about $12k of equity ($794 loan paydown + $11k appreciation (10.0% local appreciation)).
- Fountain County population projected at -22% by 2050 — secular population decline; favor cash flow + early exit over multi-decade hold.
- By year 3, paydown + projected appreciation supports a ~$31k cash-out refi (75% LTV) — recoverable capital for the next deal without selling this one.
Negotiation context
- It's been on market 15 days — a 2% lower offer ($113k) is reasonable based on typical stale-listing flexibility.
Risks & watch-outs
- Watch-outs: built in 1949 — expect roof / HVAC / electrical / plumbing capex.
Questions for the listing agent
- What do current leases actually rent for vs. the listed asking? Can we see a recent rent roll and the last 12 months of T-12 income?
- Built in 1949 — when were the roof, HVAC, electrical panel, plumbing, and water heater last replaced?
- Is there a deadline driving the sale (1031 exchange, divorce, estate, relocation)? That informs how much negotiation room exists.
- Schools are D-rated, which usually means shorter tenancies and higher turnover. Who's the typical renter profile here, and what's been the actual vacancy rate?
- The area grade is low — what's the realistic commute time and amenity access for the typical tenant pool here? Any planned neighborhood developments (good or bad) we should know about?
- What's the average days-on-market for RENTAL listings here right now (not sales)? A rising rental-DOM trend means longer vacancies and softer asking-rent achievability than the comps imply.
- What's the recent tenant-quality profile in this submarket — average credit score on applications, eviction rate, late-payment / NSF rate, and stable-employment percentage? A property-management company in the area should have these aggregated.
- How much new for-sale + rental construction is in the pipeline within 1–3 miles? Heavy new supply typically softens prices + rents 12–24 months out; constrained supply supports both.
Investment metrics
- 1% rule
- 0.66% ✗
- Cap rate
- 5.23%
- Cash-on-cash
- -3.79%
- DSCR
- 0.83
- GRM
- 12.7
CMA / ARV
- ARV (median comp)
- $145,341
- List price
- $114,900
- Delta
- -20.94%
- Verdict
- UNDERPRICED
- Comps
- 9 within 1.0 mi
Projected returns pro-forma
10.0% appreciation · 3.0% rent growth · sell at horizon
- IRR
- 21.6%
- Equity multiple
- 2.74×
- Total profit
- $56,056
- Equity at exit
- $103,511
- IRR
- 19.4%
- Equity multiple
- 6.29×
- Total profit
- $170,070
- Equity at exit
- $223,225
Cash invested: $32,172 (down + closing). Projections, not guarantees.
Landlord ↔ Tenant lean methodology
- Overall (STATE)
- 90 Strongly Landlord-Friendly
- State Indiana
- 90 Strongly Landlord-Friendly · R+11
- County
- — inherits STATE
- City
- — inherits STATE
ZIP-level market 47987
- Home prices YoY
- 4.8%
- Active inventory
- 21
- Price-to-rent
- 12.7×
Monthly cashflow live
- Estimated rent
- $753 medium interval (Pro) →
- Mortgage (P&I)
- −$603
- Tax from tax record
- −$46 /mo · $551/yr
- Insurance
- −$48
- HOA
- −$0
- Vacancy / Maint / Mgmt
- −$158
- Net cashflow
- $-102
Break-even live
UW: 25.0% down · 7.5% · 30yr · 1.5% tax · 5.0% vac · 8.0% maint · 8.0% mgmt
Financing live
Cash to close
- Down payment
- $28,725
- Closing costs
- $3,447
- Reserves months
- —
- Total cash needed
- —
Loan-product check · same deal, 3 products live
Conventional
25% down · 7.5% · 30yr
- Down + closing
- —
- Monthly P&I
- —
- Monthly cashflow
- —
- DSCR
- —
- Eligible?
- —
Personal DTI + credit; lowest rate.
DSCR
20% down · 8.5% · 30yr
- Down + closing
- —
- Monthly P&I
- —
- Monthly cashflow
- —
- DSCR
- —
- Eligible?
- —
No personal income docs; deal must DSCR.
Hard money
10% down · 12.0% · 12mo
- Down + closing
- —
- Monthly P&I
- —
- Monthly cashflow
- —
- DSCR
- —
- Eligible?
- —
Short-term bridge; refi at stabilization.
Rent comps 2 comps
| Address | Beds | Baths | Sqft | Rent | $/sqft | DOM | Units | Dist |
|---|---|---|---|---|---|---|---|---|
| 414 W Harrison St Apt 18 Veedersburg, IN | 1.0 | 1.0 | 600 | $699 | $1.17 | 43d | 1 | 1.25mi |
| 414 W Harrison St Apt 10 Veedersburg, IN | 2.0 | 1.0 | 700 | $799 | $1.14 | 20d | 1 | 1.25mi |
Listing history 1 events
-
2026-05-14$114,900 Active 485-char remark
ⓘ Source: listings_history table (triggers on properties + properties_extension) + one-shot
backfill from property_details.listing_events for pre-trigger history.
Tax reassessment forecast IN · Partial reset (capped growth)
- Current annual tax
- $551 · $46/mo
- Projected year-2 tax
- $764 · $64/mo
- Expected delta
- +$213/yr (+$18/mo · 38.5%)
ⓘ Screening estimate from a state-policy table — verify with the county assessor before closing.
Climate risk First Street
- Flood 1/10 Low FEMA zone X (unshaded) · 0% chance over 30 yrs
- Wildfire 1/10 Low
- Heat 3/10 Moderate 7 d/yr ≥102°F today · 18 d/yr by 30 yrs out
- Wind 2/10 Low 100% chance of damaging wind over 30 yrs
- Air quality 3/10 Moderate 2 unhealthy d/yr today · 3 by 30 yrs out
Nearby sold comps map
Loading sold comps map…
Walkable amenities ~0.75 mi
Loading nearby amenities…
Taxation est. · year 1
- Rental income
- $9,034
- − Mortgage interest
- −$6,436
- − Property taxes
- −$551
- − Insurance
- −$574
- − Repairs & maintenance
- −$723
- − Management
- −$723
- − Depreciation
- −$3,343
- Taxable loss
- −$3,316
- Est. tax savings @ 24.0%
- +$796
- After-tax cash flow
- $-424/yr
For passive investors: Depreciation is non-cash, so a rental often shows a tax loss while cash-flowing — sheltering income. Rental losses are passive: they offset passive income freely, and up to $25,000/yr can offset ordinary (W-2) income if you actively participate and your MAGI is under $100k (phasing out to $0 by $150k); unused losses carry forward. On sale, claimed depreciation is recaptured at up to 25%, and gains may owe capital-gains tax (a 1031 exchange can defer both). Figures are a year-1 estimate at your 24.0% rate — not tax advice; consult a CPA.
Schools (NCES district)
- District
- Southeast Fountain School Corporation
- NCES district ID
- 1810620
- Math proficiency
- 34% ▼ -8.00%
- Reading proficiency
- 43% ▼ -5.00%
- Median HH income
- $44,911
- Composite
- 32.73/100
- National rank
- #5640
- State rank
- #163 of 301 in IN
Livability — Veedersburg
- Score
- 64/100
- State rank
- #395
- US rank
- #14573
Category grades
Schools grade is shown separately in the Schools card above.
Census & demographics
- Census place
- Veedersburg, IN
- Population (ZIP)
- 3,705
Population outlook (Fountain County) Hauer SSP2
- Today (2025)
- 15,481 people
- By 2030
- 14,841 · -4.1%
- By 2040
- 13,505 · -12.8%
- By 2050
- 12,149 · -21.5%
- By 2075
- 9,214 · -40.5%
- By 2100
- 6,463 · -58.3%
Race, ethnicity, and origin ACS 2023
- Neighborhood character
- Predominantly White (95%)
- Race & ethnicity
- White 95% Hispanic / Latino 3% Two or more races 3%
- Common ancestry
- Romanian 2% Lithuanian 2% Slovak 1%
- Foreign-born
- 1% · Canada
- Languages at home
- 99% English-only · Spanish 1%
Political lean MEDSL · Fountain
- 2024 margin
- Solid R (+60.0) · D 19.1% · R 79.1% · Other 1.8%
- 2008→2024 swing
- -45.6pp toward R · 2008: -14.4pp · 2024: -60.0pp
- All cycles
- 2024: R+60.0 2020: R+56.7 2016: R+56.0 2012: R+34.2 2008: R+14.4
Not yet ingested
- Civics
- —
Market trends
- HPI YoY
- ▲ 10.85%
- Current HPI
- 235.6913
- Rent YoY
- —
- Metro
- —
- State GDP YoY
- ▲ 2.90%
- F500 in state
- 18
Industry mix (Fortune 500 HQ in IN)
| Industry | F500 HQs | Revenue |
|---|---|---|
| Industrial Machinery | 2 | $37B |
|
||
| Healthcare | 1 | $177B |
|
||
| Pharmaceuticals | 1 | $45B |
|
||
| Metals / Steel | 1 | $18B |
|
||
| Agriculture | 1 | $17B |
|
||
| Packaging | 1 | $12B |
|
||
Price history
2 events — show timeline
- 2026-05-29 Pending — MIBOR as Distributed by MLS Grid
- 2026-05-14 Listed $114,900 MIBOR as Distributed by MLS Grid
Property tax history
+6.7%/yrLatest (2024): $551 · +2.0% YoY. Source: county tax records.
Cash-flow waterfall
monthlySold comps — $/sqft
last 12 mo · ≤1 miLoading sold comps…