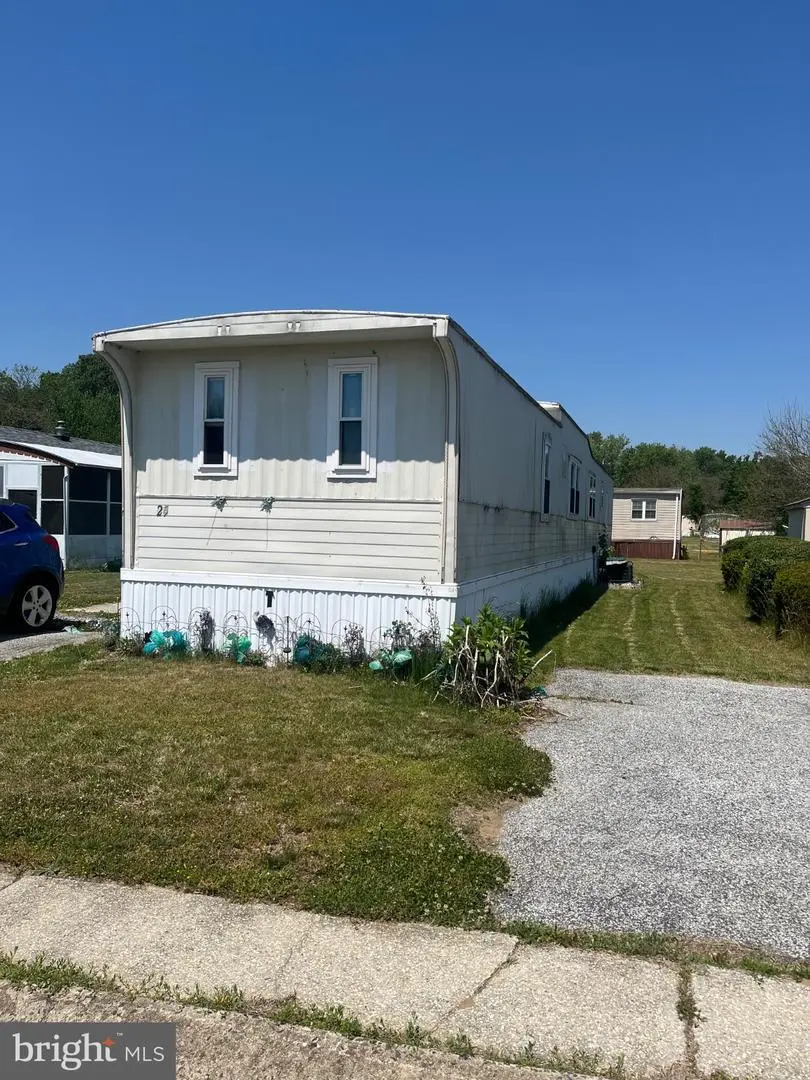
4191 Lake Rd #25 · Vineland, NJ
Flood risk No data
- FEMA flood zone
- —
- Chance of flooding over 30 yrs
- —
- Est. flood insurance / yr
- —
Fire risk No data
- Est. fire insurance / yr
- —
Heat risk No data
- Hot days now (above threshold)
- —
- Hot days in 30 yrs
- —
Wind risk No data
- Chance of severe wind over 30 yrs
- —
Air-quality risk No data
- Unhealthy air days now
- —
- Unhealthy air days in 30 yrs
- —
Risk factors via First Street. Map © Google.
Why this score? — see what drove the B+ grade
The composite is a weighted blend of 9 inputs, each scored 0–100. Each bar is that input's sub-score; the figure is the points it added to the 100-point composite (weight × sub-score).
- Cash flow +30.0/30.0
- ARV discount +15.0/15.0
- 1% rule +10.0/10.0
- DSCR +10.0/10.0
- Livability +3.3/5.0
- Rent growth +2.5/5.0
- Condition / age +2.2/5.0
- Schools +1.9/10.0
- Appreciation +0.6/10.0
$80,000
🖨 Deal sheet 📄 Offer letter ✓ Due diligence
Listing remarks
This charming 2-bedroom, 2-bathroom manufactured home offers a perfect blend of comfort and functionality. Step inside to discover a warm and inviting interior featuring ceiling fans for a refreshing breeze and a spacious combination kitchen and dining area, ideal for gatherings. The walk-in closet in the Master bedroom provide ample storage, ensuring your living space remains organized and clutter-free. The exterior boasts durable vinyl siding and a convenient satellite dish for your entertainment needs. With a single-wide design, this home is easy to maintain and offers a cozy atmosphere. Enjoy the convenience of a driveway with space for two vehicles, making coming and going a breeze. Eq
Key facts
- Durable vinyl siding
- Walk-in closet
- Essential appliances
Tags
Property features AI
Finance
- Other: Not in a federal flood zone; 2+ access exits; Pets allowed with breed restrictions
- HOA & community: Land lease payment $895 monthly; Ground rent paid annually; 99 years remaining; Land lease 99 years remaining; Park name: Lake Acres
Exterior
- Parking: Driveway parking; 2 driveway spaces; 2 total garage/parking spaces
- Utilities: Public water; Public sewer; Electric cooling fuel; Natural gas heating and hot water
- Home design: Manufactured home; Single wide type; Land lease ownership
- Construction: Vinyl siding
- Exterior features: Satellite dish; Above-grade other structures
Interior
- Kitchen: Stove; Refrigerator; Microwave
- Bedrooms: 2 bedrooms on main level
- Bathrooms: 2 full bathrooms (including 2 full on main level)
- Heating & cooling: Central A/C (electric); Natural gas heating; Natural gas hot water
- Interior features: Ceiling fans; Combination kitchen and dining area; Walk-in closet(s)
Neighborhood map
What this means for you Summary
Snapshot
- This is a 2-bed/2.0-bath single-family listed at $80k. Condition is rated fair.
Deal economics
- At list price, monthly cash flow is $428 ($5k/yr) — positive.
- The deal already cash-flows at list — no discount required.
- Meets the 1% rule at list price ($1k rent vs $80k).
- Recommended offer: $78k (3.0% below list) — sets the bar for market timing.
- Cap rate 12.7% vs local median 4.5% in Vineland — top-decile yield for the area; either an underpriced asset or a hidden risk that comps aren't pricing in. Stress-test before assuming the spread holds.
Location & tenants
- Location reads 66/100 on livability (#363 in NJ) — a middle-class / working-renter tenant base. Strengths: housing A+, health & safety A+; Watch: employment D+, schools D, crime F.
- Vineland Public School District (urban): math 9% / reading 34% proficiency, ranked #418 of 472 in NJ (top 89%) — low school quality limits family demand, transient renter base, plan for 1-2y turnover.
- Market conditions: 28 active listings in the ZIP; 216 units permitted in Cumberland County in 2024 (73 in 5+ unit buildings).
Forward outlook
- Local home prices are declining (-3.0%/yr); year-one equity from $553 of loan paydown is wiped out by about $2k of value loss. Plan a longer hold.
- Cumberland County population projected to shrink 7% by 2050 — rents likely to lag national; underwrite the cash flow, not the appreciation.
- At projected returns (-3.0% appreciation + 3.0% rent growth), your $22k cash investment doubles in ~6 years — after that, you're playing with house money.
Negotiation context
- It's been on market 32 days — a 3% lower offer ($78k) is reasonable based on typical stale-listing flexibility.
Questions for the listing agent
- It's been on market 32 days. Have you received any prior offers? Is the seller open to a 3% concession, seller financing, or rate buy-down credit?
- Have any recent inspections been done? Can we get a copy of the seller's disclosures and any deferred-maintenance estimates?
- Built in 1978 — when were the roof, HVAC, electrical panel, plumbing, and water heater last replaced?
- Is there a deadline driving the sale (1031 exchange, divorce, estate, relocation)? That informs how much negotiation room exists.
- Schools are D-rated, which usually means shorter tenancies and higher turnover. Who's the typical renter profile here, and what's been the actual vacancy rate?
- Crime grade is F in this area — have there been break-ins, vandalism, or insurance claims at this property in the last 3 years? What carrier currently insures it and at what premium?
- What's the average days-on-market for RENTAL listings here right now (not sales)? A rising rental-DOM trend means longer vacancies and softer asking-rent achievability than the comps imply.
- What's the recent tenant-quality profile in this submarket — average credit score on applications, eviction rate, late-payment / NSF rate, and stable-employment percentage? A property-management company in the area should have these aggregated.
- How much new for-sale + rental construction is in the pipeline within 1–3 miles? Heavy new supply typically softens prices + rents 12–24 months out; constrained supply supports both.
Investment metrics
- 1% rule
- 1.55% ✓
- Cap rate
- 12.71%
- Cash-on-cash
- 22.90%
- DSCR
- 2.02
- GRM
- 5.4
CMA / ARV
- ARV (on-the-fly)
- $103,740
- Comps found
- 2
Show comp detail 2 sales within ~0.75 mi
| Address | Dist | Beds/Ba | Sqft | Sold | Price | $/sf | Match |
|---|---|---|---|---|---|---|---|
| 4191 Lake Rd #28 | 0.00mi | 2/2.0 | 800 (+3%) | 4mo | $50,000 | $63 | 93 |
| 1107 W Weymouth Rd | 0.31mi | 2/1.0 | 792 (+2%) | 23mo | $105,000 | $133 | 60 |
Match score weights: distance 35% · size 25% · config 20% · recency 20%. Top-matched comps best support the ARV.
Projected returns pro-forma
-3.0% appreciation · 3.0% rent growth · sell at horizon
- IRR
- 15.9%
- Equity multiple
- 1.64×
- Total profit
- $14,284
- Equity at exit
- $11,928
- IRR
- 24.5%
- Equity multiple
- 3.12×
- Total profit
- $47,575
- Equity at exit
- $6,917
Cash invested: $22,400 (down + closing). Projections, not guarantees.
Landlord ↔ Tenant lean methodology
- Overall (STATE)
- 21 Tenant-Leaning
- State New Jersey
- 21 Tenant-Leaning · D+6
- County
- — inherits STATE
- City
- — inherits STATE
ZIP-level market 08344
- Home prices YoY
- -3.0%
- Active inventory
- 28
- Price-to-rent
- 5.4×
Monthly cashflow live
- Estimated rent
- $1,241 medium interval (Pro) →
- Mortgage (P&I)
- −$420
- Tax est. 1.5%
- −$100 /mo · $1,200/yr
- Insurance
- −$33
- HOA
- −$0
- Vacancy / Maint / Mgmt
- −$261
- Net cashflow
- $428
Break-even live
UW: 25.0% down · 7.5% · 30yr · 1.5% tax · 5.0% vac · 8.0% maint · 8.0% mgmt
Financing live
Cash to close
- Down payment
- $20,000
- Closing costs
- $2,400
- Reserves months
- —
- Total cash needed
- —
Loan-product check · same deal, 3 products live
Conventional
25% down · 7.5% · 30yr
- Down + closing
- —
- Monthly P&I
- —
- Monthly cashflow
- —
- DSCR
- —
- Eligible?
- —
Personal DTI + credit; lowest rate.
DSCR
20% down · 8.5% · 30yr
- Down + closing
- —
- Monthly P&I
- —
- Monthly cashflow
- —
- DSCR
- —
- Eligible?
- —
No personal income docs; deal must DSCR.
Hard money
10% down · 12.0% · 12mo
- Down + closing
- —
- Monthly P&I
- —
- Monthly cashflow
- —
- DSCR
- —
- Eligible?
- —
Short-term bridge; refi at stabilization.
Listing history 18 events
-
2026-06-19days on market $80,000 Active 32 DOM
-
2026-06-18days on market $80,000 Active 31 DOM
-
2026-06-17days on market $80,000 Active 30 DOM
-
2026-06-16days on market $80,000 Active 29 DOM
-
2026-06-15days on market $80,000 Active 28 DOM
-
2026-06-14days on market $80,000 Active 26 DOM
-
2026-06-13days on market $80,000 Active 25 DOM
-
2026-06-10days on market $80,000 Active 23 DOM
-
2026-06-09days on market $80,000 Active 22 DOM
-
2026-06-08days on market $80,000 Active 21 DOM
-
2026-06-07days on market $80,000 Active 20 DOM
-
2026-06-03days on market $80,000 Active 16 DOM
-
2026-06-02days on market $80,000 Active 15 DOM
-
2026-06-01days on market $80,000 Active 14 DOM
-
2026-05-31days on market $80,000 Active 13 DOM
-
2026-05-30days on market $80,000 Active 12 DOM
-
2026-05-19price $80,000
-
2026-05-18$95,000 Active
ⓘ Source: listings_history table (triggers on properties + properties_extension) + one-shot
backfill from property_details.listing_events for pre-trigger history.
Nearby sold comps map
Loading sold comps map…
Walkable amenities ~0.75 mi
Loading nearby amenities…
Taxation est. · year 1
- Rental income
- $14,892
- − Mortgage interest
- −$4,481
- − Property taxes
- −$1,200
- − Insurance
- −$400
- − Repairs & maintenance
- −$1,191
- − Management
- −$1,191
- − Depreciation
- −$2,327
- Taxable income
- $4,101
- Est. tax owed @ 24.0%
- −$984
- After-tax cash flow
- $4,146/yr
For passive investors: Depreciation is non-cash, so a rental often shows a tax loss while cash-flowing — sheltering income. Rental losses are passive: they offset passive income freely, and up to $25,000/yr can offset ordinary (W-2) income if you actively participate and your MAGI is under $100k (phasing out to $0 by $150k); unused losses carry forward. On sale, claimed depreciation is recaptured at up to 25%, and gains may owe capital-gains tax (a 1031 exchange can defer both). Figures are a year-1 estimate at your 24.0% rate — not tax advice; consult a CPA.
Condition & rehab AI · 3 photos
This single-family manufactured home requires significant repairs and maintenance, including a new roof, exterior painting, and interior repairs. While it has potential, the current condition is not suitable for immediate resale or rental.
Repairs flagged
- Major roof — Signs of potential leaks and wear.
- Major exterior siding — Peeling and faded paint indicating significant deterioration.
- Major interior walls — Signs of water damage and discoloration.
- Major HVAC system — General condition suggests it may need maintenance or replacement.
- Major landscaping — Overgrown and unkempt, indicating lack of maintenance.
Value-add opportunities
- Both painting the exterior and interior — Fresh paint can significantly improve the home's curb appeal and interior aesthetics.
- Both landscaping and yard maintenance — A well-maintained yard can enhance the home's overall appearance and increase its value.
- Both roof repair or replacement — A new roof can protect the home from water damage and improve its overall condition.
- Both HVAC system maintenance or replacement — A functional HVAC system is essential for comfort and can improve the home's energy efficiency.
- Both interior repairs and updates — Addressing water damage and other interior issues can improve the home's livability and increase its value.
Renovation cost estimate screening
| Repair item | Severity | Est. cost |
|---|---|---|
| roof · Signs of potential leaks and wear. | Major | $15,000–50,000 |
| exterior siding · Peeling and faded paint indicating significant deterioration. | Major | $15,000–50,000 |
| interior walls · Signs of water damage and discoloration. | Major | $15,000–50,000 |
| HVAC system · General condition suggests it may need maintenance or replacement. | Major | $15,000–50,000 |
| landscaping · Overgrown and unkempt, indicating lack of maintenance. | Major | $15,000–50,000 |
| Total estimated repair cost · 5 items | $75,000–250,000 |
Value-add ROI direction
- Both painting the exterior and interior — Fresh paint can significantly improve the home's curb appeal and interior aesthetics. ↑
- Both landscaping and yard maintenance — A well-maintained yard can enhance the home's overall appearance and increase its value. ↑
- Both roof repair or replacement — A new roof can protect the home from water damage and improve its overall condition. ↑
- Both HVAC system maintenance or replacement — A functional HVAC system is essential for comfort and can improve the home's energy efficiency. ↑
- Both interior repairs and updates — Addressing water damage and other interior issues can improve the home's livability and increase its value. ↑
ⓘ Cost ranges are severity-bucket heuristics (US national rule-of-thumb). Get contractor quotes + a written scope before underwriting a rehab budget.
Schools (NCES district)
- District
- Vineland Public School District
- NCES district ID
- 3416800
- Math proficiency
- 9% ▼ -17.00%
- Reading proficiency
- 34% ▬ 0.00%
- Median HH income
- $51,168
- Composite
- 19.17/100
- National rank
- #8819
- State rank
- #418 of 472 in NJ
Livability — Vineland
- Score
- 66/100
- State rank
- #363
- US rank
- #12180
Category grades
Schools grade is shown separately in the Schools card above.
Census & demographics
- Census place
- Vineland, NJ
- City population
- 45,038
- Population (ZIP)
- 5,296
Population outlook (Cumberland County) Hauer SSP2
- Today (2025)
- 152,743 people
- By 2030
- 150,373 · -1.6%
- By 2040
- 146,881 · -3.8%
- By 2050
- 142,653 · -6.6%
- By 2075
- 129,468 · -15.2%
- By 2100
- 107,456 · -29.6%
Race, ethnicity, and origin ACS 2023
- Neighborhood character
- Predominantly White (70%)
- Race & ethnicity
- White 70% Hispanic / Latino 22% Black 7% Two or more races 6%
- Hispanic origin (detail)
- Mexican 4% Puerto Rican 10% Cuban 4% Dominican 2%
- Common ancestry
- Romanian 3% Lithuanian 3% Subsaharan African 1%
- Foreign-born
- 2% · Canada
- Languages at home
- 91% English-only · Spanish 9%
Political lean MEDSL · Cumberland
- 2024 margin
- Toss-up / Even · D 47.6% · R 51.3% · Other 1.1%
- 2008→2024 swing
- -25.4pp toward R · 2008: 21.6pp · 2024: -3.8pp
- All cycles
- 2024: R+3.8 2020: D+6.0 2016: D+5.3 2012: D+23.1 2008: D+21.6
Not yet ingested
- Civics
- —
Market trends
- HPI YoY
- ▼ -8.89%
- Current HPI
- 288.38
- Rent YoY
- —
- Metro
- —
- State GDP YoY
- ▲ 2.05%
- F500 in state
- 34
Industry mix (Fortune 500 HQ in NJ)
| Industry | F500 HQs | Revenue |
|---|---|---|
| Consumer Goods | 3 | $31B |
|
||
| Pharmaceuticals | 2 | $153B |
|
||
| Technology | 2 | $21B |
|
||
| Insurance | 2 | $20B |
|
||
| Healthcare | 2 | $19B |
|
||
| Financial Services | 1 | $70B |
|
||
Price history
-15.8% since first listed2 events — show timeline
- 2026-05-19 Price Changed $80,000 BRIGHT MLS
- 2026-05-18 Listed $95,000 BRIGHT MLS
Cash-flow waterfall
monthlySold comps — $/sqft
last 12 mo · ≤1 miLoading sold comps…