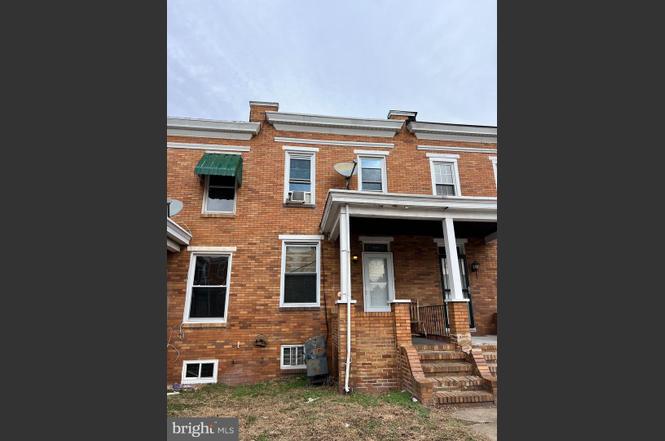
1935 Grinnalds Ave · Baltimore, MD
Flood risk 1/10 · Minimal
- FEMA flood zone
- X (unshaded)
- Chance of flooding over 30 yrs
- 0.0%
- Est. flood insurance / yr
- $473 – $860
Fire risk 1/10 · Minimal
- Est. fire insurance / yr
- $755 – $1,403
Heat risk 7/10 · Major
- Hot days now (above 103°F)
- 7 days/yr
- Hot days in 30 yrs
- 15 days/yr
Wind risk 6/10 · Moderate
- Chance of severe wind over 30 yrs
- 27.0%
Air-quality risk 3/10 · Minor
- Unhealthy air days now
- 3 days/yr
- Unhealthy air days in 30 yrs
- 4 days/yr
Risk factors via First Street. Map © Google.
Why this score? — see what drove the C+ grade
The composite is a weighted blend of 9 inputs, each scored 0–100. Each bar is that input's sub-score; the figure is the points it added to the 100-point composite (weight × sub-score).
- Cash flow +30.0/30.0
- DSCR +10.0/10.0
- 1% rule +8.7/10.0
- Livability +3.8/5.0
- ARV discount +3.3/15.0
- Condition / age +2.5/5.0
- Rent growth +2.2/5.0
- Schools +1.0/10.0
- Appreciation +0.0/10.0
$129,900
🖨 Deal sheet 📄 Offer letter ✓ Due diligence
Listing remarks
Great opportunity to add a tenant-occupied property to your investment portfolio or make it your own as a homeowner! This home features hardwood floors throughout and an open-concept main level with living and dining areas highlighted by beautiful inlaid floor detailing. The kitchen offers ample cabinet space for everyday functionality. Upstairs, you’ll find three bedrooms and a full bathroom with a tub/shower combo and skylight that fills the space with natural light. The lower level includes a finished area that can be used as a rec room or additional bedroom, along with a powder room featuring a rough-in for a future shower—providing added flexibility and potential. Enjoy the
Key facts
- Built 1926
- Listed 73 days
Neighborhood map
What this means for you Summary
Snapshot
- This is a 3-bed/1.0-bath townhouse listed at $130k.
Deal economics
- At list price, monthly cash flow is $535 ($6k/yr) — positive.
- The deal already cash-flows at list — no discount required.
- Meets the 1% rule at list price ($2k rent vs $130k).
- Recommended offer: $122k (6.0% below list) — sets the bar for market timing.
- Cap rate 11.2% vs local median 6.0% in Baltimore — top-decile yield for the area; either an underpriced asset or a hidden risk that comps aren't pricing in. Stress-test before assuming the spread holds.
Location & tenants
- Location reads 76/100 on livability (#90 in MD, #3,396 nationally) — a middle-class / working-renter tenant base. Strengths: amenities A+, commute A+, housing A+; Watch: schools D, crime F.
- Baltimore City Public Schools (urban): math 7% / reading 16% proficiency, ranked #24 of 24 in MD (top 100%) — low school quality limits family demand, transient renter base, plan for 1-2y turnover; 79% free/reduced lunch — lower-income household profile, screen leases tightly.
- Market conditions: Rents soft (-1.0%/yr); 362 active listings in the ZIP; 40 comparable units currently listed for rent nearby; rentals at typical pace (median 24d on market — plan ~3-4 weeks tenant-placement turnaround); solid renter incomes; 1,273 units permitted in Baltimore city in 2024 (1,104 in 5+ unit buildings).
Forward outlook
- Local home prices are declining (-3.0%/yr); year-one equity from $898 of loan paydown is wiped out by about $4k of value loss. Plan a longer hold.
- Baltimore County population projected to shrink 4% by 2050 — rents likely to lag national; underwrite the cash flow, not the appreciation.
- At projected returns (-3.0% appreciation + 0.0% rent growth), your $36k cash investment doubles in ~10 years — after that, you're playing with house money.
Negotiation context
- It's been on market 73 days — a 6% lower offer ($122k) is reasonable based on typical stale-listing flexibility.
- 6 sale attempts since 30y ago with the ask held roughly flat each time — persistent listings suggest the price (not the market) is what's stuck; bring a comps-based counter.
Risks & watch-outs
- Watch-outs: built in 1926 — expect roof / HVAC / electrical / plumbing capex.
- Climate carrying-cost: major wind risk, 27% chance of damaging wind over 30y; extreme-heat days projected 7→15/yr by 2055 (HVAC capex compounding) — expect insurance premiums to compound above CPI over the hold.
Questions for the listing agent
- It's been on market 73 days. Have you received any prior offers? Is the seller open to a 6% concession, seller financing, or rate buy-down credit?
- Built in 1926 — when were the roof, HVAC, electrical panel, plumbing, and water heater last replaced?
- Why hasn't it sold? Are there any deal-killer items the seller is aware of (foundation, flood, title, zoning, code violations)?
- Is there a deadline driving the sale (1031 exchange, divorce, estate, relocation)? That informs how much negotiation room exists.
- Schools are D-rated, which usually means shorter tenancies and higher turnover. Who's the typical renter profile here, and what's been the actual vacancy rate?
- Crime grade is F in this area — have there been break-ins, vandalism, or insurance claims at this property in the last 3 years? What carrier currently insures it and at what premium?
- What's the average days-on-market for RENTAL listings here right now (not sales)? A rising rental-DOM trend means longer vacancies and softer asking-rent achievability than the comps imply.
- What's the recent tenant-quality profile in this submarket — average credit score on applications, eviction rate, late-payment / NSF rate, and stable-employment percentage? A property-management company in the area should have these aggregated.
- How much new for-sale + rental construction is in the pipeline within 1–3 miles? Heavy new supply typically softens prices + rents 12–24 months out; constrained supply supports both.
Investment metrics
- 1% rule
- 1.37% ✓
- Cap rate
- 11.23%
- Cash-on-cash
- 17.64%
- DSCR
- 1.79
- GRM
- 6.1
CMA / ARV
- ARV (on-the-fly)
- $118,800
- Comps found
- 12
Show comp detail 12 sales within ~0.75 mi
| Address | Dist | Beds/Ba | Sqft | Sold | Price | $/sf | Match |
|---|---|---|---|---|---|---|---|
| 1935 Grinnalds Ave | 0.00mi | 3/2.0 | 1,080 (0%) | 1mo | $119,000 | $110 | 95 |
| 1919 Grinnalds Ave | 0.02mi | 3/1.0 | 1,080 (0%) | 7mo | $130,000 | $120 | 93 |
| 2149 Harman Ave | 0.18mi | 2/1.0 (-1) | 1,050 (-3%) | 2mo | $115,000 | $110 | 80 |
| 2527 Tolley St | 0.18mi | 2/1.0 (-1) | 1,050 (-3%) | 6mo | $120,000 | $114 | 77 |
| 2809 Washington Blvd | 0.39mi | 3/1.0 | 1,110 (+3%) | 3mo | $80,000 | $72 | 75 |
| 2036 Deering Ave | 0.35mi | 3/1.5 | 1,112 (+3%) | 3mo | $129,900 | $117 | 74 |
| 2014 Grinnalds Ave | 0.04mi | 2/2.0 (-1) | 1,015 (-6%) | 6mo | $80,000 | $79 | 74 |
| 2521 S Paca St | 0.39mi | 3/1.5 | 1,152 (+7%) | 1mo | $30,000 | $26 | 68 |
| 1710 Wickes Ave | 0.38mi | 3/2.0 | 1,024 (-5%) | 3mo | $150,000 | $146 | 67 |
| 2012 Griffis Ave | 0.04mi | 3/1.5 | 1,242 (+15%) | 7mo | $107,000 | $86 | 65 |
| 2439 Ridgely St | 0.44mi | 4/2.5 (+1) | 1,152 (+7%) | 4mo | $222,000 | $193 | 54 |
| 2630 Alaska St | 0.69mi | 3/1.5 | 1,008 (-7%) | 7mo | $85,000 | $84 | 49 |
Match score weights: distance 35% · size 25% · config 20% · recency 20%. Top-matched comps best support the ARV.
Projected returns pro-forma
-3.0% appreciation · 0.0% rent growth · sell at horizon
- IRR
- 5.7%
- Equity multiple
- 1.21×
- Total profit
- $7,810
- Equity at exit
- $19,369
- IRR
- 12.3%
- Equity multiple
- 1.84×
- Total profit
- $30,567
- Equity at exit
- $11,231
Cash invested: $36,372 (down + closing). Projections, not guarantees.
Landlord ↔ Tenant lean methodology
- Overall (CITY)
- 12 Strongly Tenant-Friendly
- State Maryland
- 27 Tenant-Leaning · D+14
- County
- — inherits STATE
- City Baltimore
- 12 Strongly Tenant-Friendly · D+58
ZIP-level market 21230
- Rents YoY
- -1.0%
- Active inventory
- 362
- Price-to-rent
- 6.1×
Monthly cashflow live
- Estimated rent
- $1,777 high interval (Pro) →
- Mortgage (P&I)
- −$681
- Tax from tax record
- −$134 /mo · $1,607/yr
- Insurance
- −$54
- HOA
- −$0
- Vacancy / Maint / Mgmt
- −$373
- Net cashflow
- $535
Break-even live
UW: 25.0% down · 7.5% · 30yr · 1.5% tax · 5.0% vac · 8.0% maint · 8.0% mgmt
Financing live
Cash to close
- Down payment
- $32,475
- Closing costs
- $3,897
- Reserves months
- —
- Total cash needed
- —
Loan-product check · same deal, 3 products live
Conventional
25% down · 7.5% · 30yr
- Down + closing
- —
- Monthly P&I
- —
- Monthly cashflow
- —
- DSCR
- —
- Eligible?
- —
Personal DTI + credit; lowest rate.
DSCR
20% down · 8.5% · 30yr
- Down + closing
- —
- Monthly P&I
- —
- Monthly cashflow
- —
- DSCR
- —
- Eligible?
- —
No personal income docs; deal must DSCR.
Hard money
10% down · 12.0% · 12mo
- Down + closing
- —
- Monthly P&I
- —
- Monthly cashflow
- —
- DSCR
- —
- Eligible?
- —
Short-term bridge; refi at stabilization.
Rent comps 40 comps
| Address | Beds | Baths | Sqft | Rent | $/sqft | DOM | Units | Dist |
|---|---|---|---|---|---|---|---|---|
| 1931 Griffis Ave Baltimore, MD | 2.0 | 1.0 | 912 | $1,349 | $1.48 | 4d | 1 | 0.04mi |
| 2056 Griffis Ave Baltimore, MD | 3.0 | 1.5 | 1230 | $1,495 | $1.22 | 21d | 1 | 0.09mi |
| 3004 Elizabeth Ave Unit 1 Baltimore, MD | 3.0 | 1.0 | 1024 | $1,395 | $1.36 | 4d | 1 | 0.80mi |
| 3017 Janice Ave Baltimore, MD | 3.0 | 1.0 | 1024 | $1,995 | $1.95 | 23d | 1 | 0.81mi |
| 2737 Wilkens Ave Baltimore, MD | 3.0 | 1.5 | 1232 | $1,650 | $1.34 | 4d | 1 | 0.89mi |
| 2514 Wilkens Ave Baltimore, MD | 4.0 | 1.0 | 1344 | $1,800 | $1.34 | 43d | 1 | 0.90mi |
| 2514 Wilkens Ave Baltimore, MD | 4.0 | 1.0 | 1344 | $1,800 | $1.34 | 10d | 1 | 0.90mi |
| 2738 Wilkens Ave Baltimore, MD | 3.0 | 1.0 | 1183 | $1,500 | $1.27 | 43d | 1 | 0.92mi |
| 2671 Saint Benedict St Baltimore, MD | 2.0 | 1.0 | 1144 | $1,325 | $1.16 | 43d | 1 | 0.92mi |
| 2509 Christian St Baltimore, MD | 4.0 | 2.0 | 1248 | $1,699 | $1.36 | 3d | 1 | 0.92mi |
| 2600 W Patapsco Ave Baltimore, MD | 1.0–2.0 | 1.0 | 856 | $1,309 | $1.53 | 2d | 24 | 0.95mi |
| 514 S Payson St Unit 2 Baltimore, MD | 3.0 | 2.0 | 1264 | $1,750 | $1.38 | 43d | 1 | 0.97mi |
| 2657 Lehman St Unit 1 Baltimore, MD | 2.0 | 1.0 | 1056 | $1,000 | $0.95 | 43d | 1 | 1.01mi |
| 1432 Carroll St Baltimore, MD | 2.0 | 1.5 | 912 | $1,900 | $2.08 | 43d | 1 | 1.06mi |
| 2200 W Patapsco Ave Baltimore, MD | 3.0 | 1.0 | 890 | $1,569 | $1.76 | 43d | 1 | 1.07mi |
| 2540 Frederick Ave Baltimore, MD | 3.0 | 1.0 | 1075 | $1,400 | $1.30 | 23d | 1 | 1.16mi |
| 1708 Hall Ave Unit 2 Halethorpe, MD | 2.0 | 1.0 | 845 | $1,625 | $1.92 | 11d | 1 | 1.16mi |
| 307 S Smallwood St Baltimore, MD | 2.0 | 2.5 | 1400 | $1,350 | $0.96 | 43d | 1 | 1.17mi |
| 332 S Franklintown Rd Unit 2 Baltimore, MD | 2.0 | 1.0 | 776 | $795 | $1.02 | 23d | 1 | 1.18mi |
| 1303 James St Baltimore, MD | 2.0 | 1.5 | 1160 | $1,350 | $1.16 | 23d | 1 | 1.21mi |
| 1127 S Carey St Baltimore, MD | 3.0 | 2.5 | 1340 | $1,900 | $1.42 | 4d | 1 | 1.24mi |
| 1101 S Carey St Baltimore, MD | 2.0 | 2.0 | 1400 | $1,200 | $0.86 | 21d | 1 | 1.24mi |
| 1259 Washington Blvd Baltimore, MD | 3.0 | 3.0 | 1232 | $2,999 | $2.43 | 4d | 1 | 1.25mi |
| 1262 Glyndon Ave Baltimore, MD | 2.0 | 3.0 | 1258 | $1,850 | $1.47 | 23d | 1 | 1.26mi |
| 1243 Washington Blvd Baltimore, MD | 3.0 | 2.0 | 1148 | $1,950 | $1.70 | 43d | 1 | 1.27mi |
| 1253 Sargeant St Baltimore, MD | 2.0 | 1.5 | 1200 | $1,695 | $1.41 | 23d | 1 | 1.27mi |
| 1205 Cleveland St Baltimore, MD | 2.0 | 2.0 | 1232 | $1,900 | $1.54 | 43d | 1 | 1.30mi |
| 110 S Catherine St Unit 1 Baltimore, MD | 2.0 | 1.0 | 1330 | $1,500 | $1.13 | 43d | 1 | 1.30mi |
| 1215 James St Baltimore, MD | 2.0 | 1.0 | 960 | $1,500 | $1.56 | 43d | 1 | 1.31mi |
| 305 S Calhoun St Baltimore, MD | 2.0 | 1.0 | 1000 | $1,300 | $1.30 | 21d | 1 | 1.33mi |
| 3130 Stafford St Baltimore, MD | 3.0 | 1.0 | 1200 | $1,500 | $1.25 | 20d | 1 | 1.34mi |
| 1163 Washington Blvd Baltimore, MD | 2.0 | 2.5 | 1012 | $1,700 | $1.68 | 12d | 1 | 1.35mi |
| 1160 Washington Blvd Baltimore, MD | 2.0 | 1.0 | 960 | $1,575 | $1.64 | 23d | 1 | 1.37mi |
| 1125 Washington Blvd Baltimore, MD | 4.0 | 2.5 | 1200 | $2,750 | $2.29 | 17d | 1 | 1.39mi |
| 1142 Sargeant St Baltimore, MD | 3.0 | 2.0 | 1080 | $1,601 | $1.48 | 1d | 1 | 1.39mi |
| 3392 Saint Benedict St Baltimore, MD | 2.0 | 1.0 | 864 | $1,450 | $1.68 | 23d | 1 | 1.39mi |
| 1127 Sargeant St Baltimore, MD | 2.0 | 1.5 | 1080 | $1,275 | $1.18 | 23d | 1 | 1.39mi |
| 1132 Nanticoke St Baltimore, MD | 2.0 | 2.5 | 1500 | $1,875 | $1.25 | 23d | 1 | 1.40mi |
| 2537 Hollins St Baltimore, MD | 3.0 | 2.0 | 1200 | $1,450 | $1.21 | 23d | 1 | 1.41mi |
| 1125 Wicomico St Baltimore, MD | 3.0 | 3.0 | 1068 | $1,955 | $1.83 | 23d | 1 | 1.41mi |
Listing history 19 events
-
2026-04-13status Pending
-
2026-02-24price $129,900
-
2026-01-30$135,000 Active
-
2026-01-30price $135,000
-
2026-01-29historical $130,000
-
2012-09-24historical Withdrawn
-
2012-09-24historical
-
2012-08-21Active
-
2012-08-21$120,000
-
2006-06-13soldstatus $120,000
-
2006-05-26soldstatus $120,000
-
2006-04-03historical
-
2006-03-22$120,000
-
1997-05-01soldstatus $44,000
-
1997-04-10soldstatus $44,000
-
1997-03-07historical
-
1996-12-08$49,850
-
1996-11-20historical
-
1996-05-21
ⓘ Source: listings_history table (triggers on properties + properties_extension) + one-shot
backfill from property_details.listing_events for pre-trigger history.
Tax reassessment forecast MD · Partial reset (capped growth)
- Current annual tax
- $1,607 · $134/mo
- Projected year-2 tax
- $1,607 · $134/mo
- Expected delta
- $0/yr ($0/mo · 0.0%)
ⓘ Screening estimate from a state-policy table — verify with the county assessor before closing.
Climate risk First Street
- Flood 1/10 Low FEMA zone X (unshaded) · 0% chance over 30 yrs
- Wildfire 1/10 Low
- Heat 7/10 Severe 7 d/yr ≥103°F today · 15 d/yr by 30 yrs out
- Wind 6/10 Major 27% chance of damaging wind over 30 yrs
- Air quality 3/10 Moderate 3 unhealthy d/yr today · 4 by 30 yrs out
Nearby sold comps map
Loading sold comps map…
Walkable amenities ~0.75 mi
Loading nearby amenities…
Taxation est. · year 1
- Rental income
- $21,326
- − Mortgage interest
- −$7,276
- − Property taxes
- −$1,607
- − Insurance
- −$650
- − Repairs & maintenance
- −$1,706
- − Management
- −$1,706
- − Depreciation
- −$3,779
- Taxable income
- $4,602
- Est. tax owed @ 24.0%
- −$1,105
- After-tax cash flow
- $5,312/yr
For passive investors: Depreciation is non-cash, so a rental often shows a tax loss while cash-flowing — sheltering income. Rental losses are passive: they offset passive income freely, and up to $25,000/yr can offset ordinary (W-2) income if you actively participate and your MAGI is under $100k (phasing out to $0 by $150k); unused losses carry forward. On sale, claimed depreciation is recaptured at up to 25%, and gains may owe capital-gains tax (a 1031 exchange can defer both). Figures are a year-1 estimate at your 24.0% rate — not tax advice; consult a CPA.
Schools (NCES district)
- District
- Baltimore City Public Schools
- NCES district ID
- 2400090
- Math proficiency
- 7% ▼ -9.00%
- Reading proficiency
- 16% ▼ -5.00%
- Median HH income
- $42,108
- Composite
- 10.08/100
- National rank
- #9805
- State rank
- #24 of 24 in MD
Livability — Baltimore
- Score
- 76/100
- State rank
- #90
- US rank
- #3396
Category grades
Schools grade is shown separately in the Schools card above.
Census & demographics
- Census place
- Baltimore, MD
- County
- Baltimore City · 558,601 people
- City population
- 588,727
- Metro
- Baltimore-Columbia-Towson, MD
- Population (ZIP)
- 32,977
- Household income
- $91,842
- Rent vs Own
- Severe rent burden
- 1463.0
Population outlook (Baltimore County) Hauer SSP2
- Today (2025)
- 624,249 people
- By 2030
- 621,541 · -0.4%
- By 2040
- 609,756 · -2.3%
- By 2050
- 597,249 · -4.3%
- By 2075
- 552,236 · -11.5%
- By 2100
- 513,934 · -17.7%
Race, ethnicity, and origin ACS 2023
- Neighborhood character
- Diverse neighborhood (Simpson 0.63)
- Race & ethnicity
- White 55% Black 23% Hispanic / Latino 13% Two or more races 6% Asian 4%
- Hispanic origin (detail)
- Mexican 1% Puerto Rican 1%
- Common ancestry
- Romanian 5% Lithuanian 2% Italian 2%
- Foreign-born
- 10% · Canada, China
- Languages at home
- 85% English-only · Spanish 9% Other Indo-European 1% Other Asian/Pacific 1%
Political lean MEDSL · Baltimore
- 2024 margin
- Solid D (+73.0) · D 85.2% · R 12.2% · Other 2.6%
- 2008→2024 swing
- -2.5pp toward R · 2008: 75.5pp · 2024: 73.0pp
- All cycles
- 2024: D+73.0 2020: D+76.6 2016: D+74.6 2012: D+76.4 2008: D+75.5
Not yet ingested
- Civics
- —
Market trends
- HPI YoY
- ▼ -311.43%
- Current HPI
- 284.338
- Rent YoY
- ▼ -1.00%
- Metro
- Baltimore-Columbia-Towson, MD
- State GDP YoY
- ▲ 2.97%
- F500 in state
- 12
Industry mix (Fortune 500 HQ in MD)
| Industry | F500 HQs | Revenue |
|---|---|---|
| Aerospace / Defense | 1 | $71B |
|
||
| Utilities | 1 | $25B |
|
||
| Hotels | 1 | $24B |
|
||
| Consumer Goods | 1 | $7B |
|
||
| Real Estate | 1 | $6B |
|
||
| Chemicals | 1 | $2B |
|
||
Price history
+160.6% since first listed19 events — show timeline
- 2026-04-13 Pending — BRIGHT MLS
- 2026-02-24 Price Changed $129,900 BRIGHT MLS
- 2026-01-30 Listed $135,000 BRIGHT MLS
- 2026-01-30 Price Changed $135,000 BRIGHT MLS
- 2026-01-29 Coming Soon $130,000 BRIGHT MLS
- 2012-09-24 Delisted — MRIS
- 2012-09-24 Listing Removed — BRIGHT MLS
- 2012-08-21 Listed — MRIS
- 2012-08-21 Listed $120,000 BRIGHT MLS
- 2006-06-13 Sold (Public Records) $120,000 Public Records
- 2006-05-26 Sold (MLS) $120,000 MRIS
- 2006-04-03 Delisted — MRIS
- 2006-03-22 Listed $120,000 MRIS
- 1997-05-01 Sold (Public Records) $44,000 Public Records
- 1997-04-10 Sold (MLS) $44,000 MRIS
- 1997-03-07 Delisted — MRIS
- 1996-12-08 Listed $49,850 MRIS
- 1996-11-20 Delisted — MRIS
- 1996-05-21 Listed — MRIS
Property tax history
-1.3%/yrLatest (2025): $1,607 · +10.7% YoY. Source: county tax records.
Cash-flow waterfall
monthlySold comps — $/sqft
last 12 mo · ≤1 miLoading sold comps…