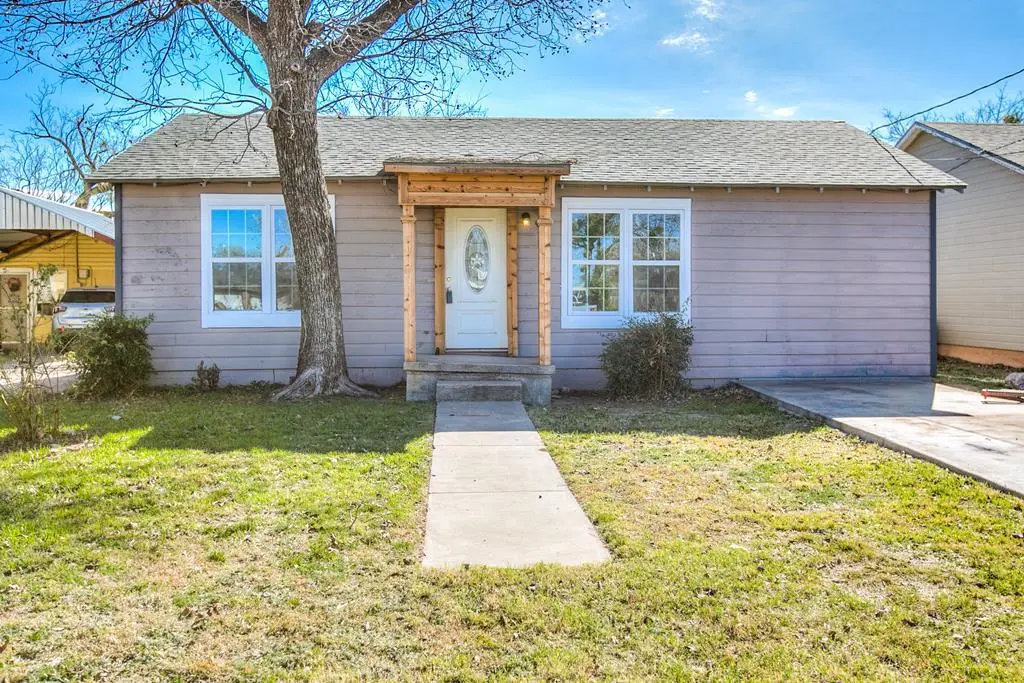
45 E 21st St · San Angelo, TX
Flood risk 1/10 · Minimal
- FEMA flood zone
- X (unshaded)
- Chance of flooding over 30 yrs
- 0.0%
- Est. flood insurance / yr
- $507 – $1,088
Fire risk 6/10 · Moderate
- Est. fire insurance / yr
- $1,222 – $2,270
Heat risk 7/10 · Major
- Hot days now (above 104°F)
- 7 days/yr
- Hot days in 30 yrs
- 23 days/yr
Wind risk 4/10 · Minor
- Chance of severe wind over 30 yrs
- 13.0%
Air-quality risk 1/10 · Minimal
- Unhealthy air days now
- 0 days/yr
- Unhealthy air days in 30 yrs
- 0 days/yr
Risk factors via First Street. Map © Google.
Why this score? — see what drove the B+ grade
The composite is a weighted blend of 9 inputs, each scored 0–100. Each bar is that input's sub-score; the figure is the points it added to the 100-point composite (weight × sub-score).
- Cash flow +29.7/30.0
- ARV discount +15.0/15.0
- DSCR +10.0/10.0
- 1% rule +8.4/10.0
- Rent growth +4.6/5.0
- Livability +3.7/5.0
- Schools +2.6/10.0
- Condition / age +2.5/5.0
- Appreciation +0.0/10.0
$95,000
🖨 Deal sheet 📄 Offer letter ✓ Due diligence
Listing remarks MLS
A GREAT STARTER HOME OR RENTAL PROPERTY THAT'S RECENTLY HAD NEW ROOF, WINDOWS, FLOORING, COUNTER TOPS, AND NEWLY PAINTED INSIDE AND OUT. HOME HAS A VERSATILE ARRANGEMENT THAT GIVES OPTIONS WITH THE SMALLER SUARE FOOTAGE. LARGE, FENCED BACK YARD AND EASY ACCESS TO SCHOOLS AND SHOPPING. DON'T MISS THIS ONE.
Key facts
- New counter tops
- Fenced back yard
- New flooring
Tags
Neighborhood map
What this means for you Summary
Snapshot
- This is a 3-bed/1.0-bath single-family listed at $95k.
Deal economics
- At list price, monthly cash flow is $344 ($4k/yr) — positive.
- The deal already cash-flows at list — no discount required.
- Meets the 1% rule at list price ($1k rent vs $95k).
- Recommended offer: $84k (12.0% below list) — sets the bar for market timing.
- Cap rate 10.6% vs local median 3.8% in San Angelo — top-decile yield for the area; either an underpriced asset or a hidden risk that comps aren't pricing in. Stress-test before assuming the spread holds.
Location & tenants
- Location reads 73/100 on livability (#199 in TX) — a middle-class / working-renter tenant base. Strengths: cost of living A+, housing A+, health & safety A+; Watch: employment C-, schools F, amenities F.
- San Angelo ISD (urban): math 27% / reading 33% proficiency, ranked #627 of 826 in TX (top 76%) — families likely to look elsewhere, expect single-tenant / working-renter base with shorter leases.
- Market conditions: Rents rising fast (+8.5%/yr); 227 active listings in the ZIP; 2 comparable units currently listed for rent nearby; 233 units permitted in Tom Green County in 2024 (0 in 5+ unit buildings).
- This rent runs 31% of the median local income ($49k/yr) — at the standard rent-burdened threshold; future hikes will face affordability resistance.
Forward outlook
- Local home prices are declining (-3.0%/yr); year-one equity from $657 of loan paydown is wiped out by about $3k of value loss. Plan a longer hold.
- Tom Green County population projected at +35% by 2050 — long-run rental-demand tailwind backs the buy-and-hold thesis.
- At projected returns (-3.0% appreciation + 8.0% rent growth), your $27k cash investment doubles in ~6 years — after that, you're playing with house money.
Negotiation context
- It's been on market 125 days — a 12% lower offer ($84k) is reasonable based on typical stale-listing flexibility.
- Current owner paid $37k; list at $95k implies a 154% gain — meaningful room to come down on a strong offer.
Risks & watch-outs
- Watch-outs: built in 1959 — expect roof / HVAC / electrical / plumbing capex.
- Climate carrying-cost: major wildfire risk; extreme-heat days projected 7→23/yr by 2055 (HVAC capex compounding) — expect insurance premiums to compound above CPI over the hold.
Questions for the listing agent
- It's been on market 125 days. Have you received any prior offers? Is the seller open to a 12% concession, seller financing, or rate buy-down credit?
- Built in 1959 — when were the roof, HVAC, electrical panel, plumbing, and water heater last replaced?
- Why hasn't it sold? Are there any deal-killer items the seller is aware of (foundation, flood, title, zoning, code violations)?
- Is there a deadline driving the sale (1031 exchange, divorce, estate, relocation)? That informs how much negotiation room exists.
- Schools are F-rated, which usually means shorter tenancies and higher turnover. Who's the typical renter profile here, and what's been the actual vacancy rate?
- What's the average days-on-market for RENTAL listings here right now (not sales)? A rising rental-DOM trend means longer vacancies and softer asking-rent achievability than the comps imply.
- What's the recent tenant-quality profile in this submarket — average credit score on applications, eviction rate, late-payment / NSF rate, and stable-employment percentage? A property-management company in the area should have these aggregated.
- How much new for-sale + rental construction is in the pipeline within 1–3 miles? Heavy new supply typically softens prices + rents 12–24 months out; constrained supply supports both.
Investment metrics
- 1% rule
- 1.34% ✓
- Cap rate
- 10.64%
- Cash-on-cash
- 15.53%
- DSCR
- 1.69
- GRM
- 6.2
CMA / ARV
- ARV (median comp)
- $136,247
- List price
- $95,000
- Delta
- -30.27%
- Verdict
- UNDERPRICED
- Comps
- 20 within 1.0 mi
Show comp detail 4 sales within ~0.75 mi
| Address | Dist | Beds/Ba | Sqft | Sold | Price | $/sf | Match |
|---|---|---|---|---|---|---|---|
| 2002 N Oakes St | 0.14mi | 2/1.0 (-1) | 798 (+10%) | 4mo | $40,000 | $50 | 70 |
| 203 E 11th St | 0.72mi | 2/1.0 (-1) | 816 (+12%) | 2mo | $125,000 | $153 | 40 |
| 630 E 25th St | 0.68mi | 2/1.0 (-1) | 776 (+7%) | 15mo | $65,000 | $84 | 40 |
| 1914 Hudson St | 0.58mi | 2/1.0 (-1) | 633 (-13%) | 15mo | $75,000 | $118 | 34 |
Match score weights: distance 35% · size 25% · config 20% · recency 20%. Top-matched comps best support the ARV.
Projected returns pro-forma
-3.0% appreciation · 8.0% rent growth · sell at horizon
- IRR
- 11.9%
- Equity multiple
- 1.50×
- Total profit
- $13,262
- Equity at exit
- $14,165
- IRR
- 24.5%
- Equity multiple
- 3.65×
- Total profit
- $70,387
- Equity at exit
- $8,214
Cash invested: $26,600 (down + closing). Projections, not guarantees.
Landlord ↔ Tenant lean methodology
- Overall (STATE)
- 87 Strongly Landlord-Friendly
- State Texas
- 87 Strongly Landlord-Friendly · R+5
- County
- — inherits STATE
- City
- — inherits STATE
ZIP-level market 76903
- Rents YoY
- 8.5%
- Active inventory
- 227
- Price-to-rent
- 6.2×
Monthly cashflow live
- Estimated rent
- $1,269 medium interval (Pro) →
- Mortgage (P&I)
- −$498
- Tax from tax record
- −$120 /mo · $1,443/yr
- Insurance
- −$40
- HOA
- −$0
- Vacancy / Maint / Mgmt
- −$266
- Net cashflow
- $344
Break-even live
UW: 25.0% down · 7.5% · 30yr · 1.5% tax · 5.0% vac · 8.0% maint · 8.0% mgmt
Financing live
Cash to close
- Down payment
- $23,750
- Closing costs
- $2,850
- Reserves months
- —
- Total cash needed
- —
Loan-product check · same deal, 3 products live
Conventional
25% down · 7.5% · 30yr
- Down + closing
- —
- Monthly P&I
- —
- Monthly cashflow
- —
- DSCR
- —
- Eligible?
- —
Personal DTI + credit; lowest rate.
DSCR
20% down · 8.5% · 30yr
- Down + closing
- —
- Monthly P&I
- —
- Monthly cashflow
- —
- DSCR
- —
- Eligible?
- —
No personal income docs; deal must DSCR.
Hard money
10% down · 12.0% · 12mo
- Down + closing
- —
- Monthly P&I
- —
- Monthly cashflow
- —
- DSCR
- —
- Eligible?
- —
Short-term bridge; refi at stabilization.
Rent comps 2 comps
| Address | Beds | Baths | Sqft | Rent | $/sqft | DOM | Units | Dist |
|---|---|---|---|---|---|---|---|---|
| 3302 N Bryant Blvd San Angelo, TX | 3.0 | 1.0 | 559 | $975 | $1.74 | 20d | 1 | 1.37mi |
| 3310 N Bryant Blvd San Angelo, TX | 2.0 | 1.0 | 610 | $750 | $1.23 | 20d | 1 | 1.46mi |
Listing history 10 events
-
2026-05-18status Pending 307-char remark
Show marketing remark (307 chars)
A GREAT STARTER HOME OR RENTAL PROPERTY THAT'S RECENTLY HAD NEW ROOF, WINDOWS, FLOORING, COUNTER TOPS, AND NEWLY PAINTED INSIDE AND OUT. HOME HAS A VERSATILE ARRANGEMENT THAT GIVES OPTIONS WITH THE SMALLER SUARE FOOTAGE. LARGE, FENCED BACK YARD AND EASY ACCESS TO SCHOOLS AND SHOPPING. DON'T MISS THIS ONE.
-
2026-04-20price $95,000 307-char remark
Show marketing remark (307 chars)
A GREAT STARTER HOME OR RENTAL PROPERTY THAT'S RECENTLY HAD NEW ROOF, WINDOWS, FLOORING, COUNTER TOPS, AND NEWLY PAINTED INSIDE AND OUT. HOME HAS A VERSATILE ARRANGEMENT THAT GIVES OPTIONS WITH THE SMALLER SUARE FOOTAGE. LARGE, FENCED BACK YARD AND EASY ACCESS TO SCHOOLS AND SHOPPING. DON'T MISS THIS ONE.
-
2026-03-17price $114,500 307-char remark
Show marketing remark (307 chars)
A GREAT STARTER HOME OR RENTAL PROPERTY THAT'S RECENTLY HAD NEW ROOF, WINDOWS, FLOORING, COUNTER TOPS, AND NEWLY PAINTED INSIDE AND OUT. HOME HAS A VERSATILE ARRANGEMENT THAT GIVES OPTIONS WITH THE SMALLER SUARE FOOTAGE. LARGE, FENCED BACK YARD AND EASY ACCESS TO SCHOOLS AND SHOPPING. DON'T MISS THIS ONE.
-
2026-01-13$124,500 Active 307-char remark
Show marketing remark (307 chars)
A GREAT STARTER HOME OR RENTAL PROPERTY THAT'S RECENTLY HAD NEW ROOF, WINDOWS, FLOORING, COUNTER TOPS, AND NEWLY PAINTED INSIDE AND OUT. HOME HAS A VERSATILE ARRANGEMENT THAT GIVES OPTIONS WITH THE SMALLER SUARE FOOTAGE. LARGE, FENCED BACK YARD AND EASY ACCESS TO SCHOOLS AND SHOPPING. DON'T MISS THIS ONE.
-
2025-05-05soldstatus
-
2023-03-15soldstatus
-
2023-03-15soldstatus
-
2006-08-17soldstatus $37,400
-
2005-07-28soldstatus $37,400
-
2005-06-01soldstatus
ⓘ Source: listings_history table (triggers on properties + properties_extension) + one-shot
backfill from property_details.listing_events for pre-trigger history.
Tax reassessment forecast TX · Resets to sale price
- Current annual tax
- $1,443 · $120/mo
- Projected year-2 tax
- $1,738 · $145/mo
- Expected delta
- +$296/yr (+$25/mo · 20.5%)
ⓘ Screening estimate from a state-policy table — verify with the county assessor before closing.
Climate risk First Street
- Flood 1/10 Low FEMA zone X (unshaded) · 0% chance over 30 yrs
- Wildfire 6/10 Major
- Heat 7/10 Severe 7 d/yr ≥104°F today · 23 d/yr by 30 yrs out
- Wind 4/10 Moderate 13% chance of damaging wind over 30 yrs
- Air quality 1/10 Low 0 unhealthy d/yr today · 0 by 30 yrs out
Nearby sold comps map
Loading sold comps map…
Walkable amenities ~0.75 mi
Loading nearby amenities…
Taxation est. · year 1
- Rental income
- $15,226
- − Mortgage interest
- −$5,321
- − Property taxes
- −$1,443
- − Insurance
- −$475
- − Repairs & maintenance
- −$1,218
- − Management
- −$1,218
- − Depreciation
- −$2,764
- Taxable income
- $2,786
- Est. tax owed @ 24.0%
- −$669
- After-tax cash flow
- $3,463/yr
For passive investors: Depreciation is non-cash, so a rental often shows a tax loss while cash-flowing — sheltering income. Rental losses are passive: they offset passive income freely, and up to $25,000/yr can offset ordinary (W-2) income if you actively participate and your MAGI is under $100k (phasing out to $0 by $150k); unused losses carry forward. On sale, claimed depreciation is recaptured at up to 25%, and gains may owe capital-gains tax (a 1031 exchange can defer both). Figures are a year-1 estimate at your 24.0% rate — not tax advice; consult a CPA.
Schools (NCES district)
- District
- San Angelo ISD
- NCES district ID
- 4838700
- Math proficiency
- 27% ▼ -9.00%
- Reading proficiency
- 33% ▼ -3.00%
- Median HH income
- $43,501
- Composite
- 25.56/100
- National rank
- #7427
- State rank
- #627 of 826 in TX
Livability — San Angelo
- Score
- 73/100
- State rank
- #199
- US rank
- #5030
Category grades
Schools grade is shown separately in the Schools card above.
Census & demographics
- Census place
- San Angelo, TX
- County
- Tom Green County · 113,188 people
- City population
- 81,357
- Metro
- San Angelo, TX
- Population (ZIP)
- 29,947
- Household income
- $49,498
- Rent vs Own
- Severe rent burden
- 1255.0
Population outlook (Tom Green County) Hauer SSP2
- Today (2025)
- 135,110 people
- By 2030
- 144,090 · +6.6%
- By 2040
- 162,561 · +20.3%
- By 2050
- 182,158 · +34.8%
- By 2075
- 232,274 · +71.9%
- By 2100
- 268,218 · +98.5%
Race, ethnicity, and origin ACS 2023
- Neighborhood character
- Diverse neighborhood (Simpson 0.56)
- Race & ethnicity
- Hispanic / Latino 56% White 36% Two or more races 26% Black 5%
- Hispanic origin (detail)
- Mexican 49% Puerto Rican 1%
- Common ancestry
- Italian 1% Serbian 1% Slovak 1%
- Foreign-born
- 10% · Canada
- Languages at home
- 66% English-only · Spanish 33%
Political lean MEDSL · Tom Green
- 2024 margin
- Solid R (+48.0) · D 25.5% · R 73.5% · Other 1.0%
- 2008→2024 swing
- -6.3pp toward R · 2008: -41.7pp · 2024: -48.0pp
- All cycles
- 2024: R+48.0 2020: R+44.4 2016: R+47.9 2012: R+47.9 2008: R+41.7
Not yet ingested
- Civics
- —
Market trends
- HPI YoY
- ▼ -164.90%
- Current HPI
- 217.0406
- Rent YoY
- ▲ 8.46%
- Metro
- San Angelo, TX
- State GDP YoY
- ▲ 3.95%
- F500 in state
- 110
Industry mix (Fortune 500 HQ in TX)
| Industry | F500 HQs | Revenue |
|---|---|---|
| Energy | 16 | $1,198B |
|
||
| Technology | 5 | $198B |
|
||
| Engineering / Construction | 4 | $72B |
|
||
| Energy Services | 3 | $60B |
|
||
| Utilities | 3 | $41B |
|
||
| Healthcare | 2 | $330B |
|
||
Price history
+154.0% since first listed10 events — show timeline
- 2026-05-18 Pending — SAAR TX
- 2026-04-20 Price Changed $95,000 SAAR TX
- 2026-03-17 Price Changed $114,500 SAAR TX
- 2026-01-13 Listed $124,500 SAAR TX
- 2025-05-05 Sold (Public Records) — Public Records
- 2023-03-15 Sold (Public Records) — Public Records
- 2023-03-15 Sold (Public Records) — Public Records
- 2006-08-17 Sold (Public Records) $37,400 Public Records
- 2005-07-28 Sold (Public Records) $37,400 Public Records
- 2005-06-01 Sold (Public Records) — Public Records
Property tax history
+9.1%/yrLatest (2025): $1,443 · +25.7% YoY. Source: county tax records.
Cash-flow waterfall
monthlySold comps — $/sqft
last 12 mo · ≤1 miLoading sold comps…