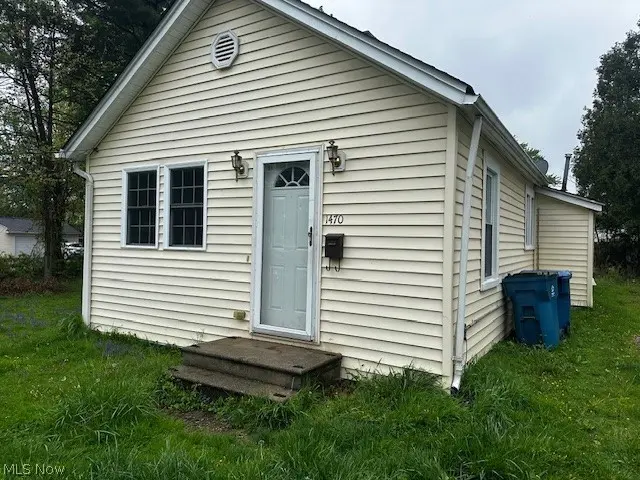
1470 E 332nd · Eastlake, OH
Flood risk 5/10 · Moderate
- FEMA flood zone
- X (unshaded)
- Chance of flooding over 30 yrs
- 0.52%
- Est. flood insurance / yr
- $507 – $1,088
Fire risk 1/10 · Minimal
- Est. fire insurance / yr
- $713 – $1,323
Heat risk 3/10 · Minor
- Hot days now (above 95°F)
- 7 days/yr
- Hot days in 30 yrs
- 18 days/yr
Wind risk 1/10 · Minimal
- Chance of severe wind over 30 yrs
- —
Air-quality risk 3/10 · Minor
- Unhealthy air days now
- 3 days/yr
- Unhealthy air days in 30 yrs
- 4 days/yr
Risk factors via First Street. Map © Google.
Why this score? — see what drove the B grade
The composite is a weighted blend of 9 inputs, each scored 0–100. Each bar is that input's sub-score; the figure is the points it added to the 100-point composite (weight × sub-score).
- Cash flow +25.3/30.0
- ARV discount +15.0/15.0
- DSCR +8.3/10.0
- 1% rule +7.6/10.0
- Schools +4.3/10.0
- Rent growth +3.7/5.0
- Livability +3.4/5.0
- Condition / age +2.5/5.0
- Appreciation +0.0/10.0
$135,000
🖨 Deal sheet 📄 Offer letter ✓ Due diligence
Listing remarks
Check out this affordable 3-bedroom, 1-bath ranch in Eastlake, Ohio. The interior has been freshly painted, giving it a clean look. Replacement windows help with energy efficiency, and the vinyl siding makes the exterior easy to maintain. The kitchen and bathroom have both been updated. This move-in ready home offers a practical option for comfortable living.
Key facts
- 0.28 acre lot
- Parking
- Built 1930
Property features AI
Exterior
- Parking: Driveway parking
- Utilities: Public water; Public sewer; Has heating (forced air)
- Home design: Single-story home; Vinyl siding exterior; Asphalt roof
- Construction: Vinyl siding construction; Asphalt roof; Year built according to public records
- Exterior features: Driveway; Lot approximately 0.2755 acres
Interior
- Kitchen: Eat-in kitchen (on the first floor)
- Bedrooms: Three main-level bedrooms (all on the first floor)
- Bathrooms: One full main-level bathroom
- Heating & cooling: Forced air heating
- Interior features: Total of 6 rooms
Neighborhood map
What this means for you Summary
Snapshot
- This is a 3-bed/1.0-bath single-family listed at $135k.
Deal economics
- At list price, monthly cash flow is $306 ($4k/yr) — positive.
- The deal already cash-flows at list — no discount required.
- Meets the 1% rule at list price ($2k rent vs $135k).
- Recommended offer: $131k (3.0% below list) — sets the bar for market timing.
- Cap rate 9.0% vs local median 4.8% in Eastlake — top-decile yield for the area; either an underpriced asset or a hidden risk that comps aren't pricing in. Stress-test before assuming the spread holds.
Location & tenants
- Location reads 68/100 on livability (#550 in OH) — a middle-class / working-renter tenant base. Strengths: cost of living A+, housing A+, health & safety A-; Watch: employment D+, amenities F, commute F.
- Willoughby-Eastlake City (suburban): math 42% / reading 58% proficiency, ranked #434 of 656 in OH (top 66%) — acceptable for families but not a draw, mixed tenant base, ~2y average lease.
- Market conditions: Rents rising fast (+4.8%/yr); 129 active listings in the ZIP; 7 comparable units currently listed for rent nearby; rentals leasing fast (median 3d on market — plan ~1-2 weeks tenant-placement turnaround); 448 units permitted in Lake County in 2024 (0 in 5+ unit buildings).
Forward outlook
- Local home prices are declining (-3.0%/yr); year-one equity from $933 of loan paydown is wiped out by about $4k of value loss. Plan a longer hold.
- Lake County population projected to shrink 8% by 2050 — rents likely to lag national; underwrite the cash flow, not the appreciation.
- At projected returns (-3.0% appreciation + 4.8% rent growth), your $38k cash investment doubles in ~9 years — after that, you're playing with house money.
Negotiation context
- It's been on market 34 days — a 3% lower offer ($131k) is reasonable based on typical stale-listing flexibility.
- 14 sale attempts since 33y ago with the ask held roughly flat each time — persistent listings suggest the price (not the market) is what's stuck; bring a comps-based counter.
Risks & watch-outs
- Watch-outs: built in 1930 — expect roof / HVAC / electrical / plumbing capex.
- Climate carrying-cost: moderate flood risk — expect insurance premiums to compound above CPI over the hold.
Questions for the listing agent
- It's been on market 34 days. Have you received any prior offers? Is the seller open to a 3% concession, seller financing, or rate buy-down credit?
- Built in 1930 — when were the roof, HVAC, electrical panel, plumbing, and water heater last replaced?
- Is there a deadline driving the sale (1031 exchange, divorce, estate, relocation)? That informs how much negotiation room exists.
- Schools are B-rated — typically a magnet for longer-tenancy family renters. What's the average tenant stay here, and is there a school-zone premium baked into asking?
- What's the average days-on-market for RENTAL listings here right now (not sales)? A rising rental-DOM trend means longer vacancies and softer asking-rent achievability than the comps imply.
- What's the recent tenant-quality profile in this submarket — average credit score on applications, eviction rate, late-payment / NSF rate, and stable-employment percentage? A property-management company in the area should have these aggregated.
- How much new for-sale + rental construction is in the pipeline within 1–3 miles? Heavy new supply typically softens prices + rents 12–24 months out; constrained supply supports both.
Investment metrics
- 1% rule
- 1.26% ✓
- Cap rate
- 9.02%
- Cash-on-cash
- 9.73%
- DSCR
- 1.43
- GRM
- 6.6
CMA / ARV
- ARV (median comp)
- $176,262
- List price
- $135,000
- Delta
- -23.41%
- Verdict
- UNDERPRICED
- Comps
- 20 within 1.0 mi
Show comp detail 12 sales within ~0.75 mi
| Address | Dist | Beds/Ba | Sqft | Sold | Price | $/sf | Match |
|---|---|---|---|---|---|---|---|
| 1470 E 332nd | 0.00mi | 3/1.0 | 1,046 (0%) | 1mo | $135,000 | $129 | 100 |
| 32222 Densmore Rd | 0.17mi | 3/2.0 | 1,064 (+2%) | 0mo | $225,000 | $211 | 85 |
| 483 E 330th St | 0.36mi | 3/1.0 | 1,047 (+0%) | 0mo | $179,000 | $171 | 82 |
| 32118 Pendley Rd | 0.23mi | 3/1.0 | 983 (-6%) | 3mo | $191,000 | $194 | 77 |
| 484 E 328th St | 0.31mi | 3/1.0 | 1,003 (-4%) | 4mo | $170,000 | $169 | 76 |
| 1262 E 346th St | 0.66mi | 3/1.5 | 1,056 (+1%) | 3mo | $171,900 | $163 | 63 |
| 287 E 330th St | 0.75mi | 3/1.0 | 1,030 (-2%) | 1mo | $205,000 | $199 | 61 |
| 1270 E 348th St | 0.70mi | 3/1.0 | 1,020 (-2%) | 4mo | $160,000 | $157 | 60 |
| 1301 E 346th St | 0.65mi | 3/1.5 | 1,080 (+3%) | 3mo | $75,000 | $69 | 59 |
| 280 E 328th St | 0.71mi | 3/1.0 | 1,100 (+5%) | 2mo | $215,000 | $195 | 57 |
| 845 Charles St | 0.73mi | 3/1.0 | 1,102 (+5%) | 3mo | $253,400 | $230 | 55 |
| 325 E 327th St | 0.62mi | 4/2.0 (+1) | 1,163 (+11%) | 3mo | $225,000 | $193 | 41 |
Match score weights: distance 35% · size 25% · config 20% · recency 20%. Top-matched comps best support the ARV.
Projected returns pro-forma
-3.0% appreciation · 4.81% rent growth · sell at horizon
- IRR
- 0.6%
- Equity multiple
- 1.02×
- Total profit
- $882
- Equity at exit
- $20,129
- IRR
- 12.2%
- Equity multiple
- 2.05×
- Total profit
- $39,674
- Equity at exit
- $11,672
Cash invested: $37,800 (down + closing). Projections, not guarantees.
Landlord ↔ Tenant lean methodology
- Overall (STATE)
- 73 Landlord-Friendly
- State Ohio
- 73 Landlord-Friendly · R+6
- County
- — inherits STATE
- City
- — inherits STATE
ZIP-level market 44095
- Rents YoY
- 4.8%
- Active inventory
- 129
- Price-to-rent
- 6.6×
Monthly cashflow live
- Estimated rent
- $1,699 high interval (Pro) →
- Mortgage (P&I)
- −$708
- Tax from tax record
- −$271 /mo · $3,255/yr
- Insurance
- −$56
- HOA
- −$0
- Vacancy / Maint / Mgmt
- −$357
- Net cashflow
- $306
Break-even live
UW: 25.0% down · 7.5% · 30yr · 1.5% tax · 5.0% vac · 8.0% maint · 8.0% mgmt
Financing live
Cash to close
- Down payment
- $33,750
- Closing costs
- $4,050
- Reserves months
- —
- Total cash needed
- —
Loan-product check · same deal, 3 products live
Conventional
25% down · 7.5% · 30yr
- Down + closing
- —
- Monthly P&I
- —
- Monthly cashflow
- —
- DSCR
- —
- Eligible?
- —
Personal DTI + credit; lowest rate.
DSCR
20% down · 8.5% · 30yr
- Down + closing
- —
- Monthly P&I
- —
- Monthly cashflow
- —
- DSCR
- —
- Eligible?
- —
No personal income docs; deal must DSCR.
Hard money
10% down · 12.0% · 12mo
- Down + closing
- —
- Monthly P&I
- —
- Monthly cashflow
- —
- DSCR
- —
- Eligible?
- —
Short-term bridge; refi at stabilization.
Rent comps 7 comps
| Address | Beds | Baths | Sqft | Rent | $/sqft | DOM | Units | Dist |
|---|---|---|---|---|---|---|---|---|
| 360 E 326th St Willowick, OH | 2.0 | 2.0 | 1053 | $1,447 | $1.37 | 2d | 1 | 0.53mi |
| 679 Dickerson Rd Willowick, OH | 4.0 | 2.0 | 806 | $1,649 | $2.05 | 1d | 1 | 0.56mi |
| 31621 N Marginal Dr Unit B Willowick, OH | 3.0 | 1.5 | 1200 | $1,550 | $1.29 | 2d | 1 | 1.01mi |
| 1323 E 360th St Eastlake, OH | 3.0 | 1.0 | 1036 | $1,599 | $1.54 | 16d | 1 | 1.15mi |
| 30620 Euclid Ave Wickliffe, OH | 2.0 | 1.0 | 1500 | $1,500 | $1.00 | 2d | 1 | 1.40mi |
| 459 Clarmont Rd Willowick, OH | 4.0 | 2.0 | 1488 | $1,875 | $1.26 | 43d | 1 | 1.41mi |
| 29210 Green Dr Willowick, OH | 3.0 | 1.0 | 1002 | $1,700 | $1.70 | 1d | 1 | 1.49mi |
Listing history 45 events
-
2026-06-03status $135,000 Pending 34 DOM
-
2026-06-02days on market $135,000 Contingent 34 DOM
-
2026-06-01days on market $135,000 Contingent 33 DOM
-
2026-05-31days on market $135,000 Contingent 32 DOM
-
2026-05-06historical Contingent 361-char remark
-
2026-04-28$135,000 Active 361-char remark
-
2025-05-22historical
-
2025-05-21historical $1,375
-
2025-04-30price $1,375
-
2025-04-11price $129,900
-
2025-02-21status Active
-
2025-02-18historical Contingent
-
2025-02-11$1,500
-
2025-02-09$135,000 Active
-
2024-12-31historical $1,550
-
2024-12-30historical
-
2024-11-07price $1,550
-
2024-10-24$2,000
-
2024-09-09status Active
-
2024-08-31historical Contingent
-
2024-08-22price $137,500
-
2024-08-22$137,900 Active
-
2024-03-31historical
-
2024-01-10$137,500 Active
-
2023-08-06historical
-
2023-07-23
-
2023-06-12status Pending
-
2023-06-12historical
-
2023-06-05price $119,000
-
2023-05-18$120,000 Active
-
2022-01-10soldstatus $75,000
-
2022-01-07soldstatus $75,000 Closed
-
2022-01-01status Pending
-
2021-12-03historical Contingent
-
2021-11-22price $92,000
-
2021-11-16status Active
-
2021-11-11status Pending
-
2021-11-07price $94,900
-
2021-10-24$99,900 Active
-
1994-04-28soldstatus $61,900
-
1994-04-28soldstatus $61,900
-
1994-02-04soldstatus $34,400
-
1994-02-02$61,900
-
1993-10-12soldstatus $34,400
-
1993-09-02$34,400
ⓘ Source: listings_history table (triggers on properties + properties_extension) + one-shot
backfill from property_details.listing_events for pre-trigger history.
Tax reassessment forecast OH · Partial reset (capped growth)
- Current annual tax
- $3,255 · $271/mo
- Projected year-2 tax
- $3,255 · $271/mo
- Expected delta
- $0/yr ($0/mo · 0.0%)
ⓘ Screening estimate from a state-policy table — verify with the county assessor before closing.
Climate risk First Street
- Flood 5/10 Major FEMA zone X (unshaded) · 52% chance over 30 yrs
- Wildfire 1/10 Low
- Heat 3/10 Moderate 7 d/yr ≥95°F today · 18 d/yr by 30 yrs out
- Wind 1/10 Low
- Air quality 3/10 Moderate 3 unhealthy d/yr today · 4 by 30 yrs out
Nearby sold comps map
Loading sold comps map…
Walkable amenities ~0.75 mi
Loading nearby amenities…
Taxation est. · year 1
- Rental income
- $20,384
- − Mortgage interest
- −$7,562
- − Property taxes
- −$3,255
- − Insurance
- −$675
- − Repairs & maintenance
- −$1,631
- − Management
- −$1,631
- − Depreciation
- −$3,927
- Taxable income
- $1,703
- Est. tax owed @ 24.0%
- −$409
- After-tax cash flow
- $3,269/yr
For passive investors: Depreciation is non-cash, so a rental often shows a tax loss while cash-flowing — sheltering income. Rental losses are passive: they offset passive income freely, and up to $25,000/yr can offset ordinary (W-2) income if you actively participate and your MAGI is under $100k (phasing out to $0 by $150k); unused losses carry forward. On sale, claimed depreciation is recaptured at up to 25%, and gains may owe capital-gains tax (a 1031 exchange can defer both). Figures are a year-1 estimate at your 24.0% rate — not tax advice; consult a CPA.
Schools (NCES district)
- District
- Willoughby-Eastlake City
- NCES district ID
- 3904510
- Math proficiency
- 42% ▼ -21.00%
- Reading proficiency
- 58% ▼ -11.00%
- Median HH income
- $52,500
- Composite
- 42.96/100
- National rank
- #3110
- State rank
- #434 of 656 in OH
Livability — Eastlake
- Score
- 68/100
- State rank
- #550
- US rank
- #9388
Category grades
Schools grade is shown separately in the Schools card above.
Census & demographics
- Census place
- Eastlake, OH
- County
- Lake County · 204,927 people
- City population
- 32,363
- Metro
- Cleveland-Elyria, OH
- Population (ZIP)
- 32,363
- Household income
- $71,543
- Rent vs Own
- Severe rent burden
- 590.0
Population outlook (Lake County) Hauer SSP2
- Today (2025)
- 230,022 people
- By 2030
- 228,151 · -0.8%
- By 2040
- 221,018 · -3.9%
- By 2050
- 212,754 · -7.5%
- By 2075
- 200,309 · -12.9%
- By 2100
- 183,315 · -20.3%
Race, ethnicity, and origin ACS 2023
- Neighborhood character
- Predominantly White (87%)
- Race & ethnicity
- White 87% Black 5% Two or more races 5% Hispanic / Latino 3%
- Common ancestry
- Romanian 8% Slovak 2% Lithuanian 2%
- Foreign-born
- 3% · Canada
- Languages at home
- 94% English-only · Russian/Polish/Slavic 3% Spanish 1% German/W. Germanic 1%
Political lean MEDSL · Lake
- 2024 margin
- R (+14.3) · D 42.4% · R 56.7%
- 2008→2024 swing
- -15.2pp toward R · 2008: 0.8pp · 2024: -14.3pp
- All cycles
- 2024: R+14.3 2020: R+13.6 2016: R+15.6 2012: R+1.7 2008: D+0.8
Not yet ingested
- Civics
- —
Market trends
- HPI YoY
- ▼ -187.78%
- Current HPI
- 171.8121
- Rent YoY
- ▲ 4.81%
- Metro
- Cleveland-Elyria, OH
- State GDP YoY
- ▲ 1.98%
- F500 in state
- 48
Industry mix (Fortune 500 HQ in OH)
| Industry | F500 HQs | Revenue |
|---|---|---|
| Insurance | 3 | $145B |
|
||
| Industrial Machinery | 3 | $49B |
|
||
| Financial Services | 3 | $24B |
|
||
| Consumer Goods | 2 | $93B |
|
||
| Aerospace / Defense | 2 | $47B |
|
||
| Utilities | 2 | $33B |
|
||
Price history
+292.8% since first listed44 events — show timeline
- 2026-06-03 Sold (Public Records) $135,125 Public Records
- 2026-06-03 Sold (MLS) $135,000 MLSNOW
- 2026-06-03 Pending — MLSNOW
- 2026-05-06 Contingent — MLSNOW
- 2026-04-28 Listed $135,000 MLSNOW
- 2025-05-22 Listing Removed — MLSNOW
- 2025-05-21 Rental Removed $1,375 YESMLS
- 2025-04-30 Price Changed $1,375 YESMLS
- 2025-04-11 Price Changed $129,900 MLSNOW
- 2025-02-21 Relisted — MLSNOW
- 2025-02-18 Contingent — MLSNOW
- 2025-02-11 Listed for Rent $1,500 YESMLS
- 2025-02-09 Listed $135,000 MLSNOW
- 2024-12-31 Rental Removed $1,550 YESMLS
- 2024-12-30 Listing Removed — MLSNOW
- 2024-11-07 Price Changed $1,550 YESMLS
- 2024-10-24 Listed for Rent $2,000 YESMLS
- 2024-09-09 Relisted — MLSNOW
- 2024-08-31 Contingent — MLSNOW
- 2024-08-22 Price Changed $137,500 MLSNOW
- 2024-08-22 Listed $137,900 MLSNOW
- 2024-03-31 Listing Removed — MLSNOW
- 2024-01-10 Listed $137,500 MLSNOW
- 2023-08-06 Rental Removed — APPFOLIO
- 2023-07-23 Listed for Rent — APPFOLIO
- 2023-06-12 Pending — MLSNOW
- 2023-06-12 Listing Removed — MLSNOW
- 2023-06-05 Price Changed $119,000 MLSNOW
- 2023-05-18 Listed $120,000 MLSNOW
- 2022-01-10 Sold (Public Records) $75,000 Public Records
- 2022-01-07 Sold (MLS) $75,000 MLSNOW
- 2022-01-01 Pending — MLSNOW
- 2021-12-03 Contingent — MLSNOW
- 2021-11-22 Price Changed $92,000 MLSNOW
- 2021-11-16 Relisted — MLSNOW
- 2021-11-11 Pending — MLSNOW
- 2021-11-07 Price Changed $94,900 MLSNOW
- 2021-10-24 Listed $99,900 MLSNOW
- 1994-04-28 Sold (Public Records) $61,900 Public Records
- 1994-04-28 Sold (MLS) $61,900 MLSNOW
- 1994-02-04 Sold (MLS) $34,400 MLSNOW
- 1994-02-02 Listed $61,900 MLSNOW
- 1993-10-12 Sold (Public Records) $34,400 Public Records
- 1993-09-02 Listed $34,400 MLSNOW
Property tax history
+6.0%/yrLatest (2025): $3,255 · +10.5% YoY. Source: county tax records.
Cash-flow waterfall
monthlySold comps — $/sqft
last 12 mo · ≤1 miLoading sold comps…