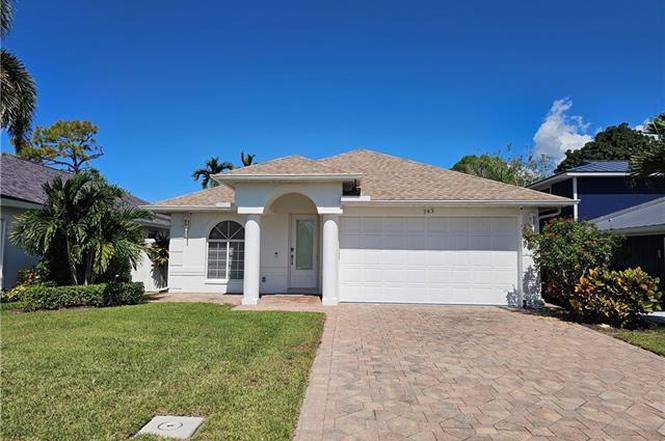
743 98th Ave N · Naples Park, FL
Flood risk 6/10 · Moderate
- FEMA flood zone
- X (shaded)
- Chance of flooding over 30 yrs
- 0.54%
- Est. flood insurance / yr
- $507 – $1,088
Fire risk 1/10 · Minimal
- Est. fire insurance / yr
- $947 – $1,759
Heat risk 10/10 · Severe
- Hot days now (above 107°F)
- 7 days/yr
- Hot days in 30 yrs
- 31 days/yr
Wind risk 10/10 · Severe
- Chance of severe wind over 30 yrs
- 99.0%
Air-quality risk 2/10 · Minimal
- Unhealthy air days now
- 1 days/yr
- Unhealthy air days in 30 yrs
- 1 days/yr
Risk factors via First Street. Map © Google.
Why this score? — see what drove the D grade
The composite is a weighted blend of 9 inputs, each scored 0–100. Each bar is that input's sub-score; the figure is the points it added to the 100-point composite (weight × sub-score).
- Cash flow +11.8/30.0
- ARV discount +7.5/15.0
- Schools +5.0/10.0
- Rent growth +4.7/5.0
- DSCR +3.5/10.0
- Livability +3.2/5.0
- 1% rule +2.5/10.0
- Condition / age +2.5/5.0
- Appreciation +0.0/10.0
$979,000
🖨 Deal sheet (PDF) 📄 Offer letter ✓ Due diligence
Listing remarks
THIS STUNNING POOL HOME IN DESIRABLE NAPLE PARK LOCATION IS THE PERFECT INVESTMENT PROPERTY WITH THE POTENTIAL TO GENERATE EXELLENT INCOME THROUGH VRBO AND SHORT TERM RENTALS. THE INTERIOR IS A BEAUTIFULLY DESIGNED AND FURNISHED PROVIDED A LUXURY FEEL FOR GUESTS. FEW MONTHS AGO THIS HOME WAS UPDATED WITH NEW ROOF 2023, BRAND NEW ALL SAMSUNG APPLIANCE, NEW FURNITURE, AND RECENTHLY WITH NEW HVAC SYSTEM2023. THE INVITING POOL IS PERFECT FOR ENJOYING THE FLORIDA SUNSHINE AND THE LARGE DECK AREA PROVIDES PLANTY SPACE FOR LOUNGING AND ENTERTAINING. THE SCREENED LANAI IS A GREAT ADDITION, PROVIDING A SHADED RETREAT FOR WHEN THE SUN GETS TO HOT. LOCATED IN NAPLES PAK, THIS HOME IS CLOSE TO ALL THE
Key facts
- New furniture
- Large deck area
- Screened lanai
Tags
Property features AI
Finance
- Other: Property type: Residential; Development: Naples Park; Lot is regular, approx. 0.15 acres with paved road access; Irrigation: Central; Landscaped view; One unit, one floor
- HOA & community: No community amenities; No HOA maintenance; Non-gated community
Exterior
- Parking: Attached 2-car garage; Paved driveway
- Utilities: Central water; Central sewer; Cable available
- Home design: Single-family residence; One-story (ranch); Rear exposure faces southwest
- Construction: Concrete block construction; Stucco exterior finish; Shingle roof; Built in 2000
- Exterior features: Fence; Patio; Privacy wall; Screened below-ground private pool; Windows: see remarks
Interior
- Kitchen: Cooktop (electric); Self-cleaning oven; Dishwasher; Disposal; Microwave; Refrigerator/freezer
- Bedrooms: 3 bedrooms; Split bedroom floor plan
- Flooring: Tile flooring
- Bathrooms: 2 full bathrooms; Master bath with dual sinks and shower (no tub)
- Heating & cooling: Central electric heat; Central electric air conditioning; Ceiling fans; Exhaust fan
- Interior features: Cable prewire; Cathedral ceiling; High-speed internet available; Laundry tub; Walk-in closet; Window coverings; Breakfast bar; Eat-in kitchen; Screened lanai/porch; Auto garage door; Smoke detector; Furnished
- Laundry & utility: Washer; Dryer; Laundry tub
Neighborhood map
What this means for you Summary
Snapshot
- This is a 3-bed/2.0-bath single-family listed at $979k.
Deal economics
- At list price, monthly cash flow is $-265 ($-3k/yr) — negative.
- To cash-flow at today's rent, offer at most $932k (4.8% below list).
- To meet the 1% rule (rent ≥ 1% of price), the offer needs to be $733k (25.1% below list).
- Recommended offer: $733k (25.1% below list) — sets the bar for 1% rule.
Location & tenants
- Location reads 64/100 on livability (#696 in FL) — a middle-class / working-renter tenant base. Strengths: crime A+, housing A-, employment B+; Watch: health & safety D, amenities F, commute F.
- Collier (suburban): math 60% / reading 56% proficiency, ranked #16 of 73 in FL (top 22%) — acceptable for families but not a draw, mixed tenant base, ~2y average lease.
- Zoned schools: Naples Park Elementary School (math 67% / reading 57%, grade B, #608 of 2,144 statewide, top 29%, 395 students, 48% FRL); Pine Ridge Middle School (math 74% / reading 70%, grade A, #52 of 571 statewide, top 10%, 832 students, 31% FRL); Barron Collier High School (math 62% / reading 68%, grade B, #76 of 667 statewide, top 11%, 1,650 students, 26% FRL) — zoned schools average 35% FRL vs 55% district-wide (20 pts lower); this property's tenant base skews higher-income than the district average.
- Market conditions: Rents rising fast (+8.7%/yr); 684 active listings in the ZIP; 40 comparable units currently listed for rent nearby; rentals at typical pace (median 25d on market — plan ~3-4 weeks tenant-placement turnaround); high-income renter base; 3,520 units permitted in Collier County in 2024 (959 in 5+ unit buildings).
- At $7,334/mo this rent would consume 74% of the median local household income ($119k/yr) (locally 237% of renters already pay >50% of income on rent) — very limited rent-growth headroom before tenants either downsize or default.
Forward outlook
- Local home prices are declining (-3.0%/yr); year-one equity from $7k of loan paydown is wiped out by about $29k of value loss. Plan a longer hold.
- Collier County population projected at +30% by 2050 — long-run rental-demand tailwind backs the buy-and-hold thesis.
Negotiation context
- It's been on market 227 days — a 12% lower offer ($862k) is reasonable based on typical stale-listing flexibility.
- 8 sale attempts since 9y ago with the ask held roughly flat each time — persistent listings suggest the price (not the market) is what's stuck; bring a comps-based counter.
Risks & watch-outs
- Climate carrying-cost: major flood risk; severe wind risk, 99% chance of damaging wind over 30y; extreme-heat days projected 7→31/yr by 2055 (HVAC capex compounding) — expect insurance premiums to compound above CPI over the hold.
Questions for the listing agent
- What do current leases actually rent for vs. the listed asking? Can we see a recent rent roll and the last 12 months of T-12 income?
- It's been on market 227 days. Have you received any prior offers? Is the seller open to a 25% concession, seller financing, or rate buy-down credit?
- Why hasn't it sold? Are there any deal-killer items the seller is aware of (foundation, flood, title, zoning, code violations)?
- Is there a deadline driving the sale (1031 exchange, divorce, estate, relocation)? That informs how much negotiation room exists.
- Schools are F-rated, which usually means shorter tenancies and higher turnover. Who's the typical renter profile here, and what's been the actual vacancy rate?
- The area grade is low — what's the realistic commute time and amenity access for the typical tenant pool here? Any planned neighborhood developments (good or bad) we should know about?
- What's the average days-on-market for RENTAL listings here right now (not sales)? A rising rental-DOM trend means longer vacancies and softer asking-rent achievability than the comps imply.
- What's the recent tenant-quality profile in this submarket — average credit score on applications, eviction rate, late-payment / NSF rate, and stable-employment percentage? A property-management company in the area should have these aggregated.
- How much new for-sale + rental construction is in the pipeline within 1–3 miles? Heavy new supply typically softens prices + rents 12–24 months out; constrained supply supports both.
Investment metrics
- 1% rule
- 0.75% ✗
- Cap rate
- 5.97%
- Cash-on-cash
- -1.16%
- DSCR
- 0.95
- GRM
- 11.1
CMA / ARV
No comps found within radius.
Projected returns pro-forma
-3.0% appreciation · 8.0% rent growth · sell at horizon
- IRR
- -13.4%
- Equity multiple
- 0.50×
- Total profit
- $-137,092
- Equity at exit
- $145,972
- IRR
- 1.5%
- Equity multiple
- 1.12×
- Total profit
- $33,973
- Equity at exit
- $84,646
Cash invested: $274,120 (down + closing). Projections, not guarantees.
Landlord ↔ Tenant lean methodology
- Overall (STATE)
- 87 Strongly Landlord-Friendly
- State Florida
- 87 Strongly Landlord-Friendly · R+3
- County
- — inherits STATE
- City
- — inherits STATE
ZIP-level market 34108
- Rents YoY
- 8.7%
- Active inventory
- 684
- Price-to-rent
- 11.1×
Monthly cashflow live
- Estimated rent
- $7,334 high interval (Pro) →
- Mortgage (P&I)
- −$5,134
- Tax from tax record
- −$517 /mo · $6,207/yr
- Insurance
- −$408
- HOA
- −$0
- Vacancy / Maint / Mgmt
- −$1,540
- Net cashflow
- $-265
Break-even live
Sensitivity live
| Price | -10% $289 | -5% $12 | +0% $-265 | +5% $-542 | +10% $-819 |
|---|---|---|---|---|---|
| Rent | -10% $-845 | -5% $-555 | +0% $-265 | +5% $25 | +10% $314 |
| Rate | -1.0pp $228 | -0.5pp $-16 | base $-265 | +0.5pp $-519 | +1.0pp $-777 |
UW: 25.0% down · 7.5% · 30yr · 1.5% tax · 5.0% vac · 8.0% maint · 8.0% mgmt
Financing live
Cash to close
- Down payment
- $244,750
- Closing costs
- $29,370
- Reserves months
- —
- Total cash needed
- —
Loan-product check · same deal, 3 products live
Conventional
25% down · 7.5% · 30yr
- Down + closing
- —
- Monthly P&I
- —
- Monthly cashflow
- —
- DSCR
- —
- Eligible?
- —
Personal DTI + credit; lowest rate.
DSCR
20% down · 8.5% · 30yr
- Down + closing
- —
- Monthly P&I
- —
- Monthly cashflow
- —
- DSCR
- —
- Eligible?
- —
No personal income docs; deal must DSCR.
Hard money
10% down · 12.0% · 12mo
- Down + closing
- —
- Monthly P&I
- —
- Monthly cashflow
- —
- DSCR
- —
- Eligible?
- —
Short-term bridge; refi at stabilization.
Rent comps 40 comps
| Address | Beds | Baths | Sqft | Rent | $/sqft | DOM | Units | Dist |
|---|---|---|---|---|---|---|---|---|
| 684 98th Ave N Naples, FL | 3.0 | 2.0 | 1702 | $4,500 | $2.64 | 15d | 1 | 0.12mi |
| 690 100th Ave N Naples, FL | 3.0 | 2.0 | 1800 | $12,500 | $6.94 | 25d | 1 | 0.13mi |
| 772 100th Ave N Naples, FL | 3.0 | 2.0 | 1712 | $3,200 | $1.87 | 25d | 1 | 0.13mi |
| 793 97th Ave N Naples, FL | 3.0 | 2.0 | 1700 | $10,500 | $6.18 | 25d | 1 | 0.17mi |
| 757 101st Ave N Naples, FL | 3.0 | 2.0 | 1366 | $3,900 | $2.86 | 25d | 1 | 0.19mi |
| 717 95th Ave N Unit 1 Naples, FL | 2.0 | 1.0 | 1500 | $2,100 | $1.40 | 25d | 1 | 0.19mi |
| 801 99th Ave N Naples, FL | 2.0 | 2.0 | 1781 | $3,500 | $1.97 | 25d | 1 | 0.19mi |
| 768 96th Ave N Naples, FL | 3.0 | 2.0 | 1735 | $11,500 | $6.63 | 25d | 1 | 0.19mi |
| 660 100th Ave N Unit 1404250P Naples, FL | 3.0 | 2.0 | 1571 | $6,068 | $3.86 | 15d | 1 | 0.20mi |
| 671 100th Ave N Naples, FL | 3.0 | 2.0 | 1164 | $5,500 | $4.73 | 25d | 1 | 0.20mi |
| 757 95th Ave N Naples, FL | 2.0 | 2.0 | 1100 | $2,150 | $1.95 | 25d | 1 | 0.21mi |
| 670 101st Ave N Naples, FL | 4.0 | 3.0 | 2208 | $15,000 | $6.79 | 25d | 1 | 0.22mi |
| 10022 8th St N Unit B Naples, FL | 2.0 | 2.0 | 1249 | $2,225 | $1.78 | 15d | 1 | 0.22mi |
| 10022 8th St N Unit 22 Naples, FL | 2.0 | 2.0 | 1250 | $2,250 | $1.80 | 25d | 1 | 0.23mi |
| 715 102nd Ave N Unit 1504167P Naples, FL | 3.0 | 3.0 | 1991 | $7,661 | $3.85 | 15d | 1 | 0.25mi |
| 682 95th Ave N Naples, FL | 3.0 | 2.0 | 1600 | $12,500 | $7.81 | 25d | 1 | 0.26mi |
| 648 96th Ave N Naples, FL | 3.0 | 2.0 | 1768 | $12,000 | $6.79 | 25d | 1 | 0.26mi |
| 625 97th Ave N Naples, FL | 3.0 | 2.0 | 1496 | $3,800 | $2.54 | 25d | 1 | 0.27mi |
| 691 102nd Ave N Naples, FL | 3.0 | 2.0 | 1311 | $7,000 | $5.34 | 25d | 1 | 0.27mi |
| 794 95th Ave N Naples, FL | 3.0 | 2.0 | 1805 | $6,500 | $3.60 | 25d | 1 | 0.28mi |
| 837 99th Ave N Naples, FL | 4.0 | 3.0 | 2100 | $18,000 | $8.57 | 25d | 1 | 0.28mi |
| 736 94th Ave N Naples, FL | 3.0 | 2.0 | 1820 | $3,500 | $1.92 | 25d | 1 | 0.29mi |
| 671 94th Ave N Naples, FL | 3.0 | 2.0 | 1464 | $6,800 | $4.64 | 25d | 1 | 0.29mi |
| 791 94th Ave N Naples, FL | 3.0 | 2.0 | 1400 | $9,000 | $6.43 | 25d | 1 | 0.30mi |
| 847 98th Ave N Naples, FL | 3.0 | 2.0 | 2084 | $4,400 | $2.11 | 15d | 1 | 0.30mi |
| 799 94th Ave N Naples, FL | 3.0 | 2.0 | 1674 | $5,000 | $2.99 | 25d | 1 | 0.30mi |
| 856 98th Ave N Naples, FL | 3.0 | 2.0 | 1711 | $4,500 | $2.63 | 25d | 1 | 0.33mi |
| 630 95th Ave N Unit A Naples, FL | 3.0 | 2.0 | 1411 | $2,995 | $2.12 | 25d | 1 | 0.33mi |
| 630 95th Ave N Unit S Naples, FL | 3.0 | 2.0 | 1411 | $5,500 | $3.90 | 25d | 1 | 0.33mi |
| 598 100th Ave N Naples, FL | 3.0 | 2.0 | 2018 | $5,884 | $2.92 | 25d | 1 | 0.36mi |
| 731 104th Ave N Naples, FL | 2.0 | 2.0 | 1388 | $12,000 | $8.65 | 25d | 1 | 0.36mi |
| 707 104th Ave N Naples, FL | 3.0 | 2.0 | 1745 | $14,500 | $8.31 | 25d | 1 | 0.37mi |
| 604 102nd Ave N Naples, FL | 3.0 | 2.0 | 1197 | $3,150 | $2.63 | 15d | 1 | 0.38mi |
| 645 103rd Ave N Unit 1534775P Naples, FL | 4.0 | 2.0 | 1840 | $8,513 | $4.63 | 23d | 1 | 0.38mi |
| 637 103rd Ave N Naples, FL | 3.0 | 2.0 | 1669 | $3,100 | $1.86 | 25d | 1 | 0.39mi |
| 714 105th Ave N Naples, FL | 3.0 | 2.0 | 1491 | $4,150 | $2.78 | 25d | 1 | 0.40mi |
| 650 93rd Ave N Unit 1073498P Naples, FL | 3.0 | 2.0 | 1442 | $5,136 | $3.56 | 15d | 1 | 0.40mi |
| 749 105th Ave N Naples, FL | 3.0 | 2.0 | 1394 | $4,000 | $2.87 | 25d | 1 | 0.43mi |
| 575 101st Ave N Naples, FL | 4.0 | 2.0 | 1800 | $12,500 | $6.94 | 25d | 1 | 0.43mi |
| 693 105th Ave N Naples, FL | 4.0 | 3.0 | 2014 | $10,500 | $5.21 | 25d | 1 | 0.44mi |
Listing history 46 events
-
2026-06-22days on market $979,000 Active 227 DOM
-
2026-06-18days on market $979,000 Active 224 DOM
-
2026-06-17days on market $979,000 Active 223 DOM
-
2026-06-16days on market $979,000 Active 222 DOM
-
2026-06-15days on market $979,000 Active 221 DOM
-
2026-06-10days on market $979,000 Active 216 DOM
-
2026-06-09days on market $979,000 Active 215 DOM
-
2026-06-08days on market $979,000 Active 214 DOM
-
2026-06-07days on market $979,000 Active 213 DOM
-
2026-06-03days on market $979,000 Active 209 DOM
-
2026-06-02days on market $979,000 Active 208 DOM
-
2026-06-01days on market $979,000 Active 207 DOM
-
2026-05-31days on market $979,000 Active 206 DOM
-
2026-05-30days on market $979,000 Active 205 DOM
-
2026-03-06price $979,000
-
2026-02-05price $989,000
-
2025-11-06$999,000 Active
-
2025-04-30historical
-
2024-11-05price $1,079,000
-
2024-06-05price $1,099,000
-
2024-06-02$1,150,000 Active
-
2024-05-31historical
-
2024-02-03price $1,150,000
-
2024-02-02status Active
-
2024-01-29historical
-
2024-01-16price $1,179,000
-
2023-11-17price $1,199,000
-
2023-11-16status Active
-
2023-08-23historical
-
2023-06-29price $1,269,000
-
2023-06-24$1,299,000 Active
-
2023-01-09historical
-
2022-12-21price $1,199,000
-
2022-12-20$1,199 Active
-
2022-07-01soldstatus $1,150,000
-
2022-06-28soldstatus $1,150,000 Closed
-
2022-05-14status Pending
-
2022-05-06$1,150,000 Active
-
2018-05-16soldstatus $485,000
-
2018-05-08soldstatus $485,000 Sold
-
2018-03-24status Pending With Contingencies
-
2018-03-07price $495,000
-
2018-02-24price $509,000
-
2017-11-20$529,000 Active
-
2002-06-20soldstatus $275,000
-
1998-09-02soldstatus $70,000
ⓘ Source: listings_history table (triggers on properties + properties_extension) + one-shot
backfill from property_details.listing_events for pre-trigger history.
Tax reassessment forecast FL · Resets to sale price
- Current annual tax
- $6,207 · $517/mo
- Projected year-2 tax
- $8,126 · $677/mo
- Expected delta
- +$1,919/yr (+$160/mo · 30.9%)
ⓘ Screening estimate from a state-policy table — verify with the county assessor before closing.
Climate risk First Street
- Flood 6/10 Major FEMA zone X (shaded) · 54% chance over 30 yrs
- Wildfire 1/10 Low
- Heat 10/10 Extreme 7 d/yr ≥107°F today · 31 d/yr by 30 yrs out
- Wind 10/10 Extreme 99% chance of damaging wind over 30 yrs
- Air quality 2/10 Low 1 unhealthy d/yr today · 1 by 30 yrs out
Nearby sold comps map
Loading sold comps map…
Walkable amenities ~0.75 mi
Loading nearby amenities…
Taxation est. · year 1
- Rental income
- $88,010
- − Mortgage interest
- −$54,839
- − Property taxes
- −$6,207
- − Insurance
- −$4,895
- − Repairs & maintenance
- −$7,041
- − Management
- −$7,041
- − Depreciation
- −$28,480
- Taxable loss
- −$20,493
- Est. tax savings @ 24.0%
- +$4,918
- After-tax cash flow
- $1,736/yr
For passive investors: Depreciation is non-cash, so a rental often shows a tax loss while cash-flowing — sheltering income. Rental losses are passive: they offset passive income freely, and up to $25,000/yr can offset ordinary (W-2) income if you actively participate and your MAGI is under $100k (phasing out to $0 by $150k); unused losses carry forward. On sale, claimed depreciation is recaptured at up to 25%, and gains may owe capital-gains tax (a 1031 exchange can defer both). Figures are a year-1 estimate at your 24.0% rate — not tax advice; consult a CPA.
Schools (NCES district)
- District
- Collier
- NCES district ID
- 1200330
- Math proficiency
- 60% ▼ -4.00%
- Reading proficiency
- 56% ▼ -2.00%
- Median HH income
- $58,275
- Composite
- 50.23/100
- National rank
- #1892
- State rank
- #16 of 73 in FL
Livability — Naples Park
- Score
- 64/100
- State rank
- #696
- US rank
- #14564
Category grades
Schools grade is shown separately in the Schools card above.
Census & demographics
- Census place
- Naples Park, FL
- County
- Collier County · 396,295 people
- Metro
- Naples-Marco Island, FL
- Population (ZIP)
- 16,237
- Household income
- $119,212
- Rent vs Own
- Severe rent burden
- 237.0
Population outlook (Collier County) Hauer SSP2
- Today (2025)
- 420,858 people
- By 2030
- 450,054 · +6.9%
- By 2040
- 502,232 · +19.3%
- By 2050
- 544,932 · +29.5%
- By 2075
- 627,203 · +49.0%
- By 2100
- 659,015 · +56.6%
Race, ethnicity, and origin ACS 2023
- Neighborhood character
- Predominantly White (87%)
- Race & ethnicity
- White 87% Hispanic / Latino 8% Two or more races 7% Asian 1% Black 1%
- Hispanic origin (detail)
- Mexican 2% Cuban 3%
- Common ancestry
- Romanian 5% Lithuanian 3% Slovak 3%
- Foreign-born
- 16% · Canada, Dominican Republic, South Korea
- Languages at home
- 86% English-only · Spanish 6% Russian/Polish/Slavic 2% Other Indo-European 2%
Political lean MEDSL · Collier
- 2024 margin
- Solid R (+33.1) · D 33.1% · R 66.2%
- 2008→2024 swing
- -10.6pp toward R · 2008: -22.5pp · 2024: -33.1pp
- All cycles
- 2024: R+33.1 2020: R+24.7 2016: R+26.0 2012: R+30.1 2008: R+22.5
Not yet ingested
- Civics
- —
Market trends
- HPI YoY
- ▼ -587.97%
- Current HPI
- 275.1872
- Rent YoY
- ▲ 8.74%
- Metro
- Naples-Marco Island, FL
- State GDP YoY
- ▲ 3.28%
- F500 in state
- 36
Industry mix (Fortune 500 HQ in FL)
| Industry | F500 HQs | Revenue |
|---|---|---|
| Industrial Technology | 2 | $29B |
|
||
| Insurance | 2 | $17B |
|
||
| Retail | 1 | $60B |
|
||
| Technology Distribution | 1 | $58B |
|
||
| Homebuilding | 1 | $35B |
|
||
| Technology Manufacturing | 1 | $35B |
|
||
Price history
+1298.6% since first listed32 events — show timeline
- 2026-03-06 Price Changed $979,000 NAPLESMLS
- 2026-02-05 Price Changed $989,000 NAPLESMLS
- 2025-11-06 Listed $999,000 NAPLESMLS
- 2025-04-30 Listing Removed — NAPLESMLS
- 2024-11-05 Price Changed $1,079,000 NAPLESMLS
- 2024-06-05 Price Changed $1,099,000 NAPLESMLS
- 2024-06-02 Listed $1,150,000 NAPLESMLS
- 2024-05-31 Listing Removed — NAPLESMLS
- 2024-02-03 Price Changed $1,150,000 NAPLESMLS
- 2024-02-02 Relisted — NAPLESMLS
- 2024-01-29 Listing Removed — NAPLESMLS
- 2024-01-16 Price Changed $1,179,000 NAPLESMLS
- 2023-11-17 Price Changed $1,199,000 NAPLESMLS
- 2023-11-16 Relisted — NAPLESMLS
- 2023-08-23 Listing Removed — NAPLESMLS
- 2023-06-29 Price Changed $1,269,000 NAPLESMLS
- 2023-06-24 Listed $1,299,000 NAPLESMLS
- 2023-01-09 Listing Removed — NAPLESMLS
- 2022-12-21 Price Changed $1,199,000 NAPLESMLS
- 2022-12-20 Listed $1,199 NAPLESMLS
- 2022-07-01 Sold (Public Records) $1,150,000 Public Records
- 2022-06-28 Sold (MLS) $1,150,000 FORTMLS
- 2022-05-14 Pending — FORTMLS
- 2022-05-06 Listed $1,150,000 FORTMLS
- 2018-05-16 Sold (Public Records) $485,000 Public Records
- 2018-05-08 Sold (MLS) $485,000 NAPLESMLS
- 2018-03-24 Pending — NAPLESMLS
- 2018-03-07 Price Changed $495,000 NAPLESMLS
- 2018-02-24 Price Changed $509,000 NAPLESMLS
- 2017-11-20 Listed $529,000 NAPLESMLS
- 2002-06-20 Sold (Public Records) $275,000 Public Records
- 1998-09-02 Sold (Public Records) $70,000 Public Records
Property tax history
+7.9%/yrLatest (2025): $6,207 · -16.3% YoY. Source: county tax records.
Cash-flow waterfall
monthlySold comps — $/sqft
last 12 mo · ≤1 miLoading sold comps…