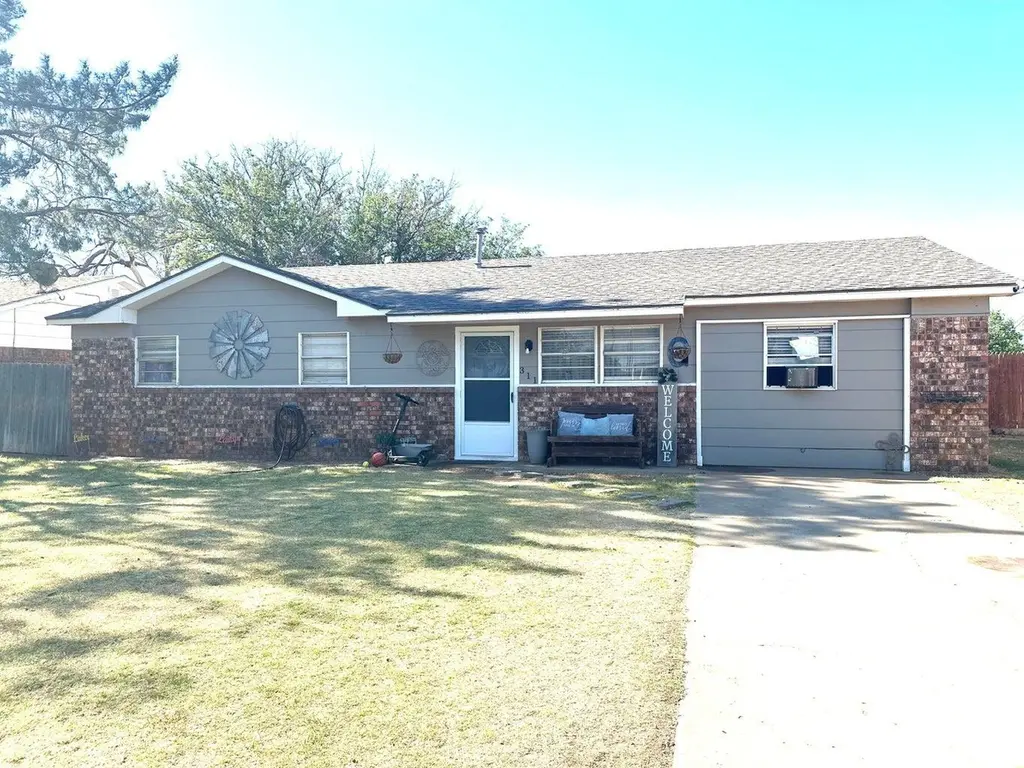
311 W 13th St · Hale Center, TX
Flood risk 1/10 · Minimal
- FEMA flood zone
- X (unshaded)
- Chance of flooding over 30 yrs
- 0.0%
- Est. flood insurance / yr
- $507 – $1,088
Fire risk 6/10 · Moderate
- Est. fire insurance / yr
- $1,222 – $2,270
Heat risk 5/10 · Moderate
- Hot days now (above 99°F)
- 7 days/yr
- Hot days in 30 yrs
- 20 days/yr
Wind risk 2/10 · Minimal
- Chance of severe wind over 30 yrs
- —
Air-quality risk 2/10 · Minimal
- Unhealthy air days now
- 0 days/yr
- Unhealthy air days in 30 yrs
- 1 days/yr
Risk factors via First Street. Map © Google.
Why this score? — see what drove the C+ grade
The composite is a weighted blend of 9 inputs, each scored 0–100. Each bar is that input's sub-score; the figure is the points it added to the 100-point composite (weight × sub-score).
- Cash flow +24.9/30.0
- DSCR +8.1/10.0
- ARV discount +7.5/15.0
- 1% rule +6.4/10.0
- Appreciation +3.5/10.0
- Livability +3.5/5.0
- Schools +2.8/10.0
- Rent growth +2.5/5.0
- Condition / age +2.5/5.0
$110,500
🖨 Deal sheet 📄 Offer letter ✓ Due diligence
Listing remarks MLS
Great 4 bedroom, 1.5 bath home in Hale Center! This home offers a nice floor plan with plenty of space for comfortable living. Enjoy the large backyard and patio area, perfect for entertaining, relaxing, or family gatherings. Don't miss this great opportunity!
Key facts
- Large backyard
- Patio area
- 8,407 sq ft lot
Tags
Property features AI
Exterior
- Parking: Driveway
- Home design: Single-family residential property
- Construction: Brick veneer exterior; Other foundation detail
- Exterior features: Chain link fencing; Other exterior features; Composition roof
Interior
- Bathrooms: 1 full bathroom; 1 half bathroom
- Heating & cooling: Central heating (natural gas); Central air conditioning; Ceiling fan(s)
- Interior features: Ceiling fans; Other interior features
Neighborhood map
What this means for you Summary
Snapshot
- This is a 4-bed/1.5-bath single-family listed at $110k.
Deal economics
- At list price, monthly cash flow is $236 ($3k/yr) — positive.
- The deal already cash-flows at list — no discount required.
- Meets the 1% rule at list price ($1k rent vs $110k).
- Recommended offer: $107k (3.0% below list) — sets the bar for market timing.
Location & tenants
- Location reads 70/100 on livability (#370 in TX) — a middle-class / working-renter tenant base. Strengths: crime A+, cost of living A+, housing A+; Watch: health & safety C-, employment D, amenities F.
- Hale Center ISD (rural): math 28% / reading 39% proficiency, ranked #569 of 826 in TX (top 69%) — families likely to look elsewhere, expect single-tenant / working-renter base with shorter leases; 63% free/reduced lunch — lower-income household profile, screen leases tightly.
- Zoned schools: Akin El (math 42% / reading 42%, grade F, #1,335 of 4,322 statewide, top 33%, 248 students, 80% FRL); Carr Middle (math 17% / reading 37%, grade F, #1,177 of 1,662 statewide, top 72%, 178 students, 60% FRL); Hale Center H S (math 44% / reading 44%, grade F, #652 of 1,632 statewide, top 43%, 159 students, 54% FRL) — zoned schools at 65% FRL track the district average.
- Market conditions: 13 active listings in the ZIP; 13 units permitted in Hale County in 2024 (0 in 5+ unit buildings).
Forward outlook
- Local home prices are declining (-3.0%/yr); year-one equity from $764 of loan paydown is wiped out by about $3k of value loss. Plan a longer hold.
- Hale County population projected at -27% by 2050 — secular population decline; favor cash flow + early exit over multi-decade hold.
Negotiation context
- It's been on market 31 days — a 3% lower offer ($107k) is reasonable based on typical stale-listing flexibility.
- 3 sale attempts since 10y ago; this cycle's ask has dropped $6k (5%) from the opening price — seller is motivated, your offer sets the floor, not the list.
Risks & watch-outs
- Climate carrying-cost: major wildfire risk; extreme-heat days projected 7→20/yr by 2055 (HVAC capex compounding) — expect insurance premiums to compound above CPI over the hold.
Questions for the listing agent
- It's been on market 31 days. Have you received any prior offers? Is the seller open to a 3% concession, seller financing, or rate buy-down credit?
- Built in 1969 — when were the roof, HVAC, electrical panel, plumbing, and water heater last replaced?
- Is there a deadline driving the sale (1031 exchange, divorce, estate, relocation)? That informs how much negotiation room exists.
- Schools are D-rated, which usually means shorter tenancies and higher turnover. Who's the typical renter profile here, and what's been the actual vacancy rate?
- What's the average days-on-market for RENTAL listings here right now (not sales)? A rising rental-DOM trend means longer vacancies and softer asking-rent achievability than the comps imply.
- What's the recent tenant-quality profile in this submarket — average credit score on applications, eviction rate, late-payment / NSF rate, and stable-employment percentage? A property-management company in the area should have these aggregated.
- How much new for-sale + rental construction is in the pipeline within 1–3 miles? Heavy new supply typically softens prices + rents 12–24 months out; constrained supply supports both.
Investment metrics
- 1% rule
- 1.14% ✓
- Cap rate
- 8.86%
- Cash-on-cash
- 9.17%
- DSCR
- 1.41
- GRM
- 7.3
CMA / ARV
- ARV (on-the-fly)
- $54,880
- Comps found
- 1
Show comp detail 1 sale within ~0.75 mi
| Address | Dist | Beds/Ba | Sqft | Sold | Price | $/sf | Match |
|---|---|---|---|---|---|---|---|
| 522 W 9th St | 0.35mi | 3/2.0 (-1) | 1,495 (+9%) | 15mo | $59,999 | $40 | 50 |
Match score weights: distance 35% · size 25% · config 20% · recency 20%. Top-matched comps best support the ARV.
Projected returns pro-forma
-3.0% appreciation · 3.0% rent growth · sell at horizon
- IRR
- -2.4%
- Equity multiple
- 0.91×
- Total profit
- $-2,831
- Equity at exit
- $16,476
- IRR
- 7.3%
- Equity multiple
- 1.55×
- Total profit
- $16,983
- Equity at exit
- $9,554
Cash invested: $30,940 (down + closing). Projections, not guarantees.
Landlord ↔ Tenant lean methodology
- Overall (STATE)
- 87 Strongly Landlord-Friendly
- State Texas
- 87 Strongly Landlord-Friendly · R+5
- County
- — inherits STATE
- City
- — inherits STATE
ZIP-level market 79041
- Home prices YoY
- -2.8%
- Active inventory
- 13
- Price-to-rent
- 7.3×
Monthly cashflow live
- Estimated rent
- $1,254 medium interval (Pro) →
- Mortgage (P&I)
- −$579
- Tax from tax record
- −$129 /mo · $1,546/yr
- Insurance
- −$46
- HOA
- −$0
- Vacancy / Maint / Mgmt
- −$263
- Net cashflow
- $236
Break-even live
UW: 25.0% down · 7.5% · 30yr · 1.5% tax · 5.0% vac · 8.0% maint · 8.0% mgmt
Financing live
Cash to close
- Down payment
- $27,625
- Closing costs
- $3,315
- Reserves months
- —
- Total cash needed
- —
Loan-product check · same deal, 3 products live
Conventional
25% down · 7.5% · 30yr
- Down + closing
- —
- Monthly P&I
- —
- Monthly cashflow
- —
- DSCR
- —
- Eligible?
- —
Personal DTI + credit; lowest rate.
DSCR
20% down · 8.5% · 30yr
- Down + closing
- —
- Monthly P&I
- —
- Monthly cashflow
- —
- DSCR
- —
- Eligible?
- —
No personal income docs; deal must DSCR.
Hard money
10% down · 12.0% · 12mo
- Down + closing
- —
- Monthly P&I
- —
- Monthly cashflow
- —
- DSCR
- —
- Eligible?
- —
Short-term bridge; refi at stabilization.
Listing history 21 events
-
2026-06-19days on market $110,500 Active 31 DOM
-
2026-06-18days on market $110,500 Active 30 DOM
-
2026-06-17days on market $110,500 Active 29 DOM
-
2026-06-16days on market $110,500 Active 28 DOM
-
2026-06-15days on market $110,500 Active 27 DOM
-
2026-06-14days on market $110,500 Active 25 DOM
-
2026-06-12pricedays on market $110,500 Active 24 DOM
-
2026-06-09days on market $112,500 Active 21 DOM
-
2026-06-08days on market $112,500 Active 20 DOM
-
2026-06-07pricedays on market $112,500 Active 19 DOM
-
2026-06-05days on market $114,500 Active 17 DOM
-
2026-06-02days on market $114,500 Active 14 DOM
-
2026-06-01days on market $114,500 Active 13 DOM
-
2026-05-31days on market $114,500 Active 12 DOM
-
2026-05-30days on market $114,500 Active 11 DOM
-
2026-05-18$116,500 Active 260-char remark
Show marketing remark (260 chars)
Great 4 bedroom, 1.5 bath home in Hale Center! This home offers a nice floor plan with plenty of space for comfortable living. Enjoy the large backyard and patio area, perfect for entertaining, relaxing, or family gatherings. Don't miss this great opportunity!
-
2026-05-18$116,500 Active
Show marketing remark (260 chars)
Great 4 bedroom, 1.5 bath home in Hale Center! This home offers a nice floor plan with plenty of space for comfortable living. Enjoy the large backyard and patio area, perfect for entertaining, relaxing, or family gatherings. Don't miss this great opportunity!
-
2016-12-14soldstatus
-
2016-12-13soldstatus 200-char remark
Show marketing remark (200 chars)
Great investment property. House has nice single lot and great bones. Needs a lot of work but not too drastic. This could be a first home project for the right buyer. A must see! Cosmetic work mostly.
-
2016-10-28$40,000 200-char remark
Show marketing remark (200 chars)
Great investment property. House has nice single lot and great bones. Needs a lot of work but not too drastic. This could be a first home project for the right buyer. A must see! Cosmetic work mostly.
-
2004-03-16soldstatus
ⓘ Source: listings_history table (triggers on properties + properties_extension) + one-shot
backfill from property_details.listing_events for pre-trigger history.
Tax reassessment forecast TX · Resets to sale price
- Current annual tax
- $1,546 · $129/mo
- Projected year-2 tax
- $2,022 · $169/mo
- Expected delta
- +$476/yr (+$40/mo · 30.8%)
ⓘ Screening estimate from a state-policy table — verify with the county assessor before closing.
Climate risk First Street
- Flood 1/10 Low FEMA zone X (unshaded) · 0% chance over 30 yrs
- Wildfire 6/10 Major
- Heat 5/10 Major 7 d/yr ≥99°F today · 20 d/yr by 30 yrs out
- Wind 2/10 Low
- Air quality 2/10 Low 0 unhealthy d/yr today · 1 by 30 yrs out
Nearby sold comps map
Loading sold comps map…
Walkable amenities ~0.75 mi
Loading nearby amenities…
Taxation est. · year 1
- Rental income
- $15,051
- − Mortgage interest
- −$6,190
- − Property taxes
- −$1,546
- − Insurance
- −$552
- − Repairs & maintenance
- −$1,204
- − Management
- −$1,204
- − Depreciation
- −$3,215
- Taxable income
- $1,140
- Est. tax owed @ 24.0%
- −$274
- After-tax cash flow
- $2,564/yr
For passive investors: Depreciation is non-cash, so a rental often shows a tax loss while cash-flowing — sheltering income. Rental losses are passive: they offset passive income freely, and up to $25,000/yr can offset ordinary (W-2) income if you actively participate and your MAGI is under $100k (phasing out to $0 by $150k); unused losses carry forward. On sale, claimed depreciation is recaptured at up to 25%, and gains may owe capital-gains tax (a 1031 exchange can defer both). Figures are a year-1 estimate at your 24.0% rate — not tax advice; consult a CPA.
Schools (NCES district)
- District
- Hale Center ISD
- NCES district ID
- 4822050
- Math proficiency
- 28% ▼ -2.00%
- Reading proficiency
- 39% ▲ 2.00%
- Median HH income
- $38,588
- Composite
- 27.98/100
- National rank
- #6854
- State rank
- #569 of 826 in TX
Livability — Hale Center
- Score
- 70/100
- State rank
- #370
- US rank
- #7841
Category grades
Schools grade is shown separately in the Schools card above.
Census & demographics
- Census place
- Hale Center, TX
- Population (ZIP)
- 2,511
Population outlook (Hale County) Hauer SSP2
- Today (2025)
- 30,851 people
- By 2030
- 29,158 · -5.5%
- By 2040
- 25,681 · -16.8%
- By 2050
- 22,420 · -27.3%
- By 2075
- 15,857 · -48.6%
- By 2100
- 10,500 · -66.0%
Race, ethnicity, and origin ACS 2023
- Neighborhood character
- Majority Hispanic (63%)
- Race & ethnicity
- Hispanic / Latino 63% White 28% Two or more races 20% Black 6% Native American 3%
- Hispanic origin (detail)
- Mexican 54% Dominican 2%
- Common ancestry
- Italian 2% Lithuanian 1% Serbian 1%
- Foreign-born
- 11% · Canada
- Languages at home
- 55% English-only · Spanish 45%
Political lean MEDSL · Hale
- 2024 margin
- Solid R (+58.0) · D 20.5% · R 78.5%
- 2008→2024 swing
- -13.1pp toward R · 2008: -44.9pp · 2024: -58.0pp
- All cycles
- 2024: R+58.0 2020: R+51.1 2016: R+48.4 2012: R+47.8 2008: R+44.9
Not yet ingested
- Civics
- —
Market trends
- HPI YoY
- ▼ -3.03%
- Current HPI
- 103.7834
- Rent YoY
- —
- Metro
- —
- State GDP YoY
- ▲ 3.95%
- F500 in state
- 110
Industry mix (Fortune 500 HQ in TX)
| Industry | F500 HQs | Revenue |
|---|---|---|
| Energy | 16 | $1,198B |
|
||
| Technology | 5 | $198B |
|
||
| Engineering / Construction | 4 | $72B |
|
||
| Energy Services | 3 | $60B |
|
||
| Utilities | 3 | $41B |
|
||
| Healthcare | 2 | $330B |
|
||
Price history
+191.2% since first listed6 events — show timeline
- 2026-05-18 Listed $116,500 PARMLS
- 2026-05-18 Listed $116,500 LARMLS
- 2016-12-14 Sold (Public Records) — Public Records
- 2016-12-13 Sold (MLS) — LARMLS
- 2016-10-28 Listed $40,000 LARMLS
- 2004-03-16 Sold (Public Records) — Public Records
Property tax history
+4.2%/yrLatest (2025): $1,546 · +10.3% YoY. Source: county tax records.
Cash-flow waterfall
monthlySold comps — $/sqft
last 12 mo · ≤1 miLoading sold comps…