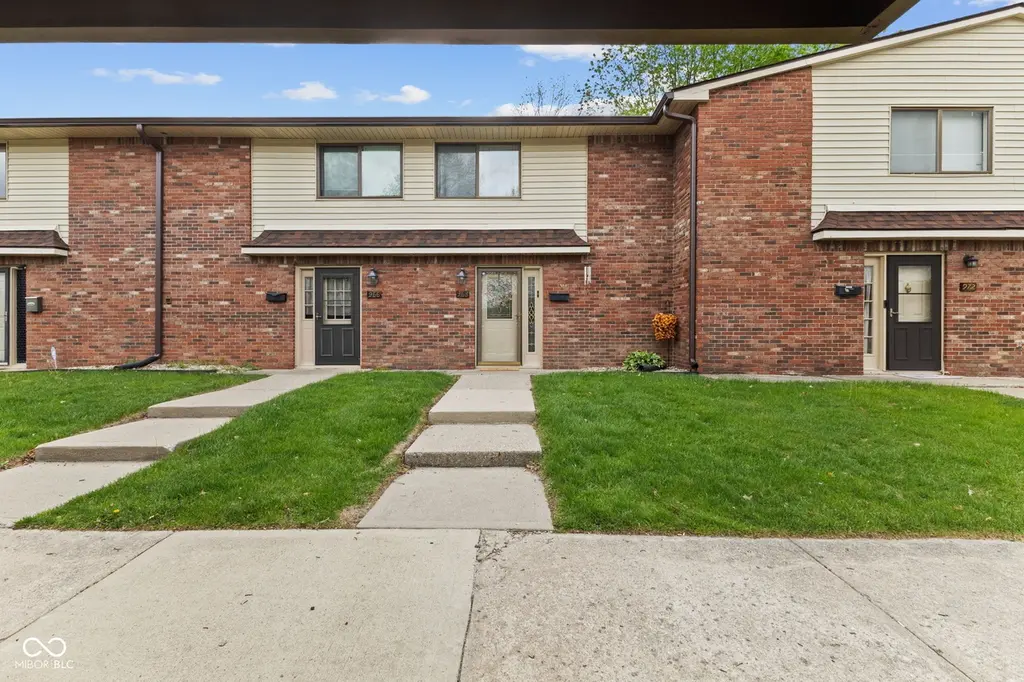
968 Greenwood Trl W · Greenwood, IN
Flood risk 1/10 · Minimal
- FEMA flood zone
- X (unshaded)
- Chance of flooding over 30 yrs
- 0.0%
- Est. flood insurance / yr
- $507 – $1,088
Fire risk 1/10 · Minimal
- Est. fire insurance / yr
- $717 – $1,331
Heat risk 3/10 · Minor
- Hot days now (above 101°F)
- 7 days/yr
- Hot days in 30 yrs
- 19 days/yr
Wind risk 2/10 · Minimal
- Chance of severe wind over 30 yrs
- 1.0%
Air-quality risk 2/10 · Minimal
- Unhealthy air days now
- 2 days/yr
- Unhealthy air days in 30 yrs
- 2 days/yr
Risk factors via First Street. Map © Google.
Why this score? — see what drove the C- grade
The composite is a weighted blend of 9 inputs, each scored 0–100. Each bar is that input's sub-score; the figure is the points it added to the 100-point composite (weight × sub-score).
- Cash flow +18.6/30.0
- ARV discount +7.5/15.0
- 1% rule +6.5/10.0
- DSCR +5.8/10.0
- Schools +4.0/10.0
- Livability +3.7/5.0
- Rent growth +2.5/5.0
- Condition / age +2.5/5.0
- Appreciation +0.0/10.0
$120,000
🖨 Deal sheet 📄 Offer letter ✓ Due diligence
Listing remarks
Welcome to 968 a beautifully updated, low-maintenance condo offering comfort, style, and convenience. Step inside to find fresh vinyl plank flooring that flows through the main living areas, creating a modern and inviting feel. The kitchen has been thoughtfully upgraded with refreshed cabinetry and new countertops, providing both functionality and a clean, updated look. This home features two spacious bedrooms with newer carpet, offering cozy retreats for rest and relaxation. The updated bathroom adds a touch of contemporary comfort, while the layout provides easy, practical living throughout. Enjoy outdoor living with your own private fenced-in patio, perfect for morning coffee, pets, or e
Key facts
- Private upper deck
- Refreshed cabinetry
- New countertops
Tags
Neighborhood map
What this means for you Summary
Snapshot
- This is a 2-bed/1.5-bath condo listed at $120k.
Deal economics
- At list price, monthly cash flow is $116 ($1k/yr) — positive.
- The deal already cash-flows at list — no discount required.
- Meets the 1% rule at list price ($1k rent vs $120k).
- Cap rate 7.5% vs local median 4.5% in Greenwood — top-decile yield for the area; either an underpriced asset or a hidden risk that comps aren't pricing in. Stress-test before assuming the spread holds.
Location & tenants
- Location reads 73/100 on livability (#91 in IN) — a middle-class / working-renter tenant base. Strengths: cost of living A+, housing A+, crime A; Watch: amenities F, commute F, health & safety F.
- Greenwood Community School Corporation (suburban): math 41% / reading 52% proficiency, ranked #88 of 301 in IN (top 29%) — families likely to look elsewhere, expect single-tenant / working-renter base with shorter leases.
- Market conditions: Rents soft (-0.1%/yr); 60 active listings in the ZIP; 31 comparable units currently listed for rent nearby; rentals leasing fast (median 10d on market — plan ~1-2 weeks tenant-placement turnaround); solid renter incomes; 1,133 units permitted in Johnson County in 2024 (0 in 5+ unit buildings).
Forward outlook
- Local home prices are declining (-3.0%/yr); year-one equity from $830 of loan paydown is wiped out by about $4k of value loss. Plan a longer hold.
- Johnson County population projected at +26% by 2050 — long-run rental-demand tailwind backs the buy-and-hold thesis.
Negotiation context
- Only 1 days on market — expect competitive offers; lowballing is unlikely to land.
- 4 sale attempts since 18y ago with the ask held roughly flat each time — persistent listings suggest the price (not the market) is what's stuck; bring a comps-based counter.
Questions for the listing agent
- Built in 1974 — when were the roof, HVAC, electrical panel, plumbing, and water heater last replaced?
- What does the HOA fee cover, when was the last increase, and are there any pending special assessments or reserve-fund shortfalls?
- Any open or pending special assessments — roof, HVAC, plumbing, elevator, façade? What's the per-unit balance and payoff schedule, and is the seller paying it off at close or rolling it to the buyer?
- Is there a deadline driving the sale (1031 exchange, divorce, estate, relocation)? That informs how much negotiation room exists.
- Schools are B-rated — typically a magnet for longer-tenancy family renters. What's the average tenant stay here, and is there a school-zone premium baked into asking?
- What's the average days-on-market for RENTAL listings here right now (not sales)? A rising rental-DOM trend means longer vacancies and softer asking-rent achievability than the comps imply.
- What's the recent tenant-quality profile in this submarket — average credit score on applications, eviction rate, late-payment / NSF rate, and stable-employment percentage? A property-management company in the area should have these aggregated.
- How much new apartment / multifamily construction is in the pipeline within 1–3 miles? Heavy new supply (>2% of stock underway) typically softens rents 12–24 months out; light construction supports rent growth.
Investment metrics
- 1% rule
- 1.15% ✓
- Cap rate
- 7.45%
- Cash-on-cash
- 4.15%
- DSCR
- 1.18
- GRM
- 7.2
CMA / ARV
No comps found within radius.
Projected returns pro-forma
-3.0% appreciation · 0.0% rent growth · sell at horizon
- IRR
- -13.7%
- Equity multiple
- 0.52×
- Total profit
- $-15,989
- Equity at exit
- $17,892
- IRR
- -11.6%
- Equity multiple
- 0.42×
- Total profit
- $-19,593
- Equity at exit
- $10,375
Cash invested: $33,600 (down + closing). Projections, not guarantees.
Landlord ↔ Tenant lean methodology
- Overall (STATE)
- 90 Strongly Landlord-Friendly
- State Indiana
- 90 Strongly Landlord-Friendly · R+11
- County
- — inherits STATE
- City
- — inherits STATE
ZIP-level market 46142
- Rents YoY
- -0.1%
- Active inventory
- 60
- Price-to-rent
- 7.2×
Monthly cashflow live
- Estimated rent
- $1,381 high interval (Pro) →
- Mortgage (P&I)
- −$629
- Tax from tax record
- −$48 /mo · $580/yr
- Insurance
- −$50
- HOA
- −$247
- Vacancy / Maint / Mgmt
- −$290
- Net cashflow
- $116
Break-even live
UW: 25.0% down · 7.5% · 30yr · 1.5% tax · 5.0% vac · 8.0% maint · 8.0% mgmt
Financing live
Cash to close
- Down payment
- $30,000
- Closing costs
- $3,600
- Reserves months
- —
- Total cash needed
- —
Loan-product check · same deal, 3 products live
Conventional
25% down · 7.5% · 30yr
- Down + closing
- —
- Monthly P&I
- —
- Monthly cashflow
- —
- DSCR
- —
- Eligible?
- —
Personal DTI + credit; lowest rate.
DSCR
20% down · 8.5% · 30yr
- Down + closing
- —
- Monthly P&I
- —
- Monthly cashflow
- —
- DSCR
- —
- Eligible?
- —
No personal income docs; deal must DSCR.
Hard money
10% down · 12.0% · 12mo
- Down + closing
- —
- Monthly P&I
- —
- Monthly cashflow
- —
- DSCR
- —
- Eligible?
- —
Short-term bridge; refi at stabilization.
Rent comps 31 comps
| Address | Beds | Baths | Sqft | Rent | $/sqft | DOM | Units | Dist |
|---|---|---|---|---|---|---|---|---|
| 968 Greenwood Trl W Greenwood, IN | 2.0 | 2.0 | 1088 | $1,475 | $1.36 | 12d | 1 | 0.03mi |
| 14 Greenwood Trl N Greenwood, IN | 2.0 | 1.5 | 1088 | $1,275 | $1.17 | 14d | 1 | 0.13mi |
| 1039 N Paz Dr Greenwood, IN | 1.0–2.0 | 1.0 | 800 | $1,193 | $1.49 | 1d | 8 | 0.16mi |
| 88 Keran Manor Ct Greenwood, IN | 2.0 | 1.0 | 945 | $1,450 | $1.53 | 43d | 1 | 0.30mi |
| 614 Park Madison Dr Greenwood, IN | 2.0 | 2.0 | 1150 | $1,250 | $1.09 | 10d | 1 | 0.52mi |
| 2816 E County Line Rd Indianapolis, IN | 2.0 | 1.0 | 1265 | $910 | $0.72 | 23d | 1 | 0.54mi |
| 3503 Pleasant Lake Dr Indianapolis, IN | 3.0 | 1.0 | 1064 | $1,615 | $1.52 | 12d | 1 | 0.62mi |
| 8631 Pleasant Creek Ct Indianapolis, IN | 3.0 | 2.0 | 1120 | $1,706 | $1.52 | 7d | 1 | 0.69mi |
| 1043 Mikes Way Greenwood, IN | 3.0 | 2.0 | 1090 | $1,650 | $1.51 | 43d | 1 | 0.69mi |
| 8960 S Keystone Ave Indianapolis, IN | 1.0–2.0 | 1.0 | 881 | $1,270 | $1.44 | 1d | 7 | 0.76mi |
| 464 Carol Dr Greenwood, IN | 3.0 | 1.0 | 888 | $1,550 | $1.75 | 43d | 1 | 0.79mi |
| 3546 Valley Lake Dr Indianapolis, IN | 3.0 | 1.0 | 984 | $1,645 | $1.67 | 4d | 1 | 0.80mi |
| 745 Wood Dale Ter Greenwood, IN | 1.0–3.0 | 1.0–1.5 | 1032 | $1,326 | $1.28 | 2d | 10 | 0.80mi |
| 601 Wood Dale Ter Greenwood, IN | 2.0 | 1.5 | 960 | $1,174 | $1.22 | 44d | 1 | 0.80mi |
| 634 Wooddale Ter Unit 1010 Greenwood, IN | 1.0 | 1.0 | 882 | $917 | $1.04 | 43d | 1 | 0.81mi |
| 628 Wooddale Ter Unit 1007 Greenwood, IN | 2.0 | 1.5 | 1013 | $1,104 | $1.09 | 43d | 1 | 0.82mi |
| 622 Wood Dale Ter Greenwood, IN | 1.0–2.0 | 1.0–1.5 | 947 | $1,104 | $1.17 | 23d | 3 | 0.82mi |
| 600 Wooddale Ter Apt 07 Greenwood, IN | 2.0 | 1.0 | 750 | $999 | $1.33 | 23d | 1 | 0.83mi |
| 600 Wood Dale Ter Greenwood, IN | 2.0 | 1.0 | 750 | $999 | $1.33 | 43d | 1 | 0.83mi |
| 4545 Scarlet Oak Way Indianapolis, IN | 1.0–3.0 | 1.0–2.0 | 1101 | $1,690 | $1.53 | 1d | 16 | 1.05mi |
| 3717 Piermont Dr Indianapolis, IN | 1.0–3.0 | 1.0–2.0 | 1038 | $1,414 | $1.36 | 2d | 23 | 1.07mi |
| 171 1/2 W Broadway St Greenwood, IN | 1.0 | 1.0 | 900 | $1,375 | $1.53 | 23d | 1 | 1.08mi |
| 800 Kings Mill Rd Greenwood, IN | 2.0 | 1.0–2.0 | 701 | $1,358 | $1.94 | 1d | 52 | 1.09mi |
| 921 Parliament Pl Greenwood, IN | 1.0–3.0 | 1.0–2.0 | 994 | $1,298 | $1.30 | 2d | 30 | 1.12mi |
| 3741 Lima Ct Indianapolis, IN | 2.0 | 1.0 | 976 | $1,350 | $1.38 | 7d | 1 | 1.16mi |
| 8126 Xenia Dr Indianapolis, IN | 3.0 | 2.0 | 1176 | $4,500 | $3.83 | 1d | 1 | 1.16mi |
| 8213 Zona Dr Indianapolis, IN | 1.0–3.0 | 1.0–1.5 | 935 | $1,102 | $1.18 | 1d | 16 | 1.27mi |
| 8055 Crossing Dr Indianapolis, IN | 1.0–2.0 | 1.0 | 775 | $1,224 | $1.58 | 2d | 15 | 1.30mi |
| 501 E Main St Greenwood, IN | 2.0 | 1.0 | 968 | $1,395 | $1.44 | 43d | 1 | 1.34mi |
| 370 Homestead Ave Greenwood, IN | 1.0–3.0 | 1.0–2.0 | 1135 | $1,905 | $1.68 | 1d | 26 | 1.43mi |
| 7909 Southfield Dr Indianapolis, IN | 3.0 | 2.0 | 1056 | $1,445 | $1.37 | 7d | 1 | 1.48mi |
HOA detail condo
- Monthly dues
- $247 · $2,964/yr
- Assessments
- None detected in remarks — confirm with the listing agent.
Listing history 9 events
-
2026-04-17status Pending
-
2026-04-15$120,000 Active
-
2016-11-23status Active
-
2016-10-07historical
-
2016-09-08status Pending
-
2016-08-19price $44,900
-
2016-04-09$49,900 Active
-
2008-10-07historical
-
2008-02-06$69,900
ⓘ Source: listings_history table (triggers on properties + properties_extension) + one-shot
backfill from property_details.listing_events for pre-trigger history.
Tax reassessment forecast IN · Partial reset (capped growth)
- Current annual tax
- $580 · $48/mo
- Projected year-2 tax
- $800 · $67/mo
- Expected delta
- +$220/yr (+$18/mo · 37.9%)
ⓘ Screening estimate from a state-policy table — verify with the county assessor before closing.
Climate risk First Street
- Flood 1/10 Low FEMA zone X (unshaded) · 0% chance over 30 yrs
- Wildfire 1/10 Low
- Heat 3/10 Moderate 7 d/yr ≥101°F today · 19 d/yr by 30 yrs out
- Wind 2/10 Low 100% chance of damaging wind over 30 yrs
- Air quality 2/10 Low 2 unhealthy d/yr today · 2 by 30 yrs out
Nearby sold comps map
Loading sold comps map…
Walkable amenities ~0.75 mi
Loading nearby amenities…
Taxation est. · year 1
- Rental income
- $16,567
- − Mortgage interest
- −$6,722
- − Property taxes
- −$580
- − Insurance
- −$600
- − Repairs & maintenance
- −$1,325
- − Management
- −$1,325
- − HOA
- −$2,964
- − Depreciation
- −$3,491
- Taxable loss
- −$440
- Est. tax savings @ 24.0%
- +$106
- After-tax cash flow
- $1,498/yr
For passive investors: Depreciation is non-cash, so a rental often shows a tax loss while cash-flowing — sheltering income. Rental losses are passive: they offset passive income freely, and up to $25,000/yr can offset ordinary (W-2) income if you actively participate and your MAGI is under $100k (phasing out to $0 by $150k); unused losses carry forward. On sale, claimed depreciation is recaptured at up to 25%, and gains may owe capital-gains tax (a 1031 exchange can defer both). Figures are a year-1 estimate at your 24.0% rate — not tax advice; consult a CPA.
Schools (NCES district)
- District
- Greenwood Community School Corporation
- NCES district ID
- 1804110
- Math proficiency
- 41% ▼ -12.00%
- Reading proficiency
- 52% ▼ -7.00%
- Median HH income
- $48,589
- Composite
- 39.71/100
- National rank
- #3902
- State rank
- #88 of 301 in IN
Livability — Greenwood
- Score
- 73/100
- State rank
- #91
- US rank
- #5255
Category grades
Schools grade is shown separately in the Schools card above.
Census & demographics
- Census place
- Greenwood, IN
- County
- Johnson County · 154,261 people
- City population
- 96,151
- Metro
- Indianapolis-Carmel-Anderson, IN
- Population (ZIP)
- 34,348
- Household income
- $89,001
- Rent vs Own
- Severe rent burden
- 482.0
Population outlook (Johnson County) Hauer SSP2
- Today (2025)
- 170,080 people
- By 2030
- 179,983 · +5.8%
- By 2040
- 198,580 · +16.8%
- By 2050
- 214,661 · +26.2%
- By 2075
- 247,990 · +45.8%
- By 2100
- 257,821 · +51.6%
Race, ethnicity, and origin ACS 2023
- Neighborhood character
- Predominantly White (83%)
- Race & ethnicity
- White 83% Asian 6% Hispanic / Latino 5% Two or more races 4% Black 3%
- Hispanic origin (detail)
- Mexican 3% Puerto Rican 1%
- Common ancestry
- Slovak 3% Italian 2% Romanian 2%
- Foreign-born
- 6% · Canada, Philippines
- Languages at home
- 91% English-only · Spanish 3% Other Asian/Pacific 3% Other Indo-European 1%
Political lean MEDSL · Johnson
- 2024 margin
- Solid R (+34.3) · D 32.0% · R 66.3% · Other 1.7%
- 2008→2024 swing
- -8.9pp toward R · 2008: -25.5pp · 2024: -34.3pp
- All cycles
- 2024: R+34.3 2020: R+34.1 2016: R+42.5 2012: R+38.5 2008: R+25.5
Not yet ingested
- Civics
- —
Market trends
- HPI YoY
- ▼ -222.62%
- Current HPI
- 210.7473
- Rent YoY
- ▼ -0.15%
- Metro
- Indianapolis-Carmel-Anderson, IN
- State GDP YoY
- ▲ 2.90%
- F500 in state
- 18
Industry mix (Fortune 500 HQ in IN)
| Industry | F500 HQs | Revenue |
|---|---|---|
| Industrial Machinery | 2 | $37B |
|
||
| Healthcare | 1 | $177B |
|
||
| Pharmaceuticals | 1 | $45B |
|
||
| Metals / Steel | 1 | $18B |
|
||
| Agriculture | 1 | $17B |
|
||
| Packaging | 1 | $12B |
|
||
Price history
+71.7% since first listed9 events — show timeline
- 2026-04-17 Pending — MIBOR as Distributed by MLS Grid
- 2026-04-15 Listed $120,000 MIBOR as Distributed by MLS Grid
- 2016-11-23 Relisted — MIBOR as Distributed by MLS Grid
- 2016-10-07 Listing Removed — MIBOR as Distributed by MLS Grid
- 2016-09-08 Pending — MIBOR as Distributed by MLS Grid
- 2016-08-19 Price Changed $44,900 MIBOR as Distributed by MLS Grid
- 2016-04-09 Listed $49,900 MIBOR as Distributed by MLS Grid
- 2008-10-07 Listing Removed — MIBOR as Distributed by MLS Grid
- 2008-02-06 Listed $69,900 MIBOR as Distributed by MLS Grid
Property tax history
-4.6%/yrLatest (2024): $580 · +5.2% YoY. Source: county tax records.
Cash-flow waterfall
monthlySold comps — $/sqft
last 12 mo · ≤1 miLoading sold comps…