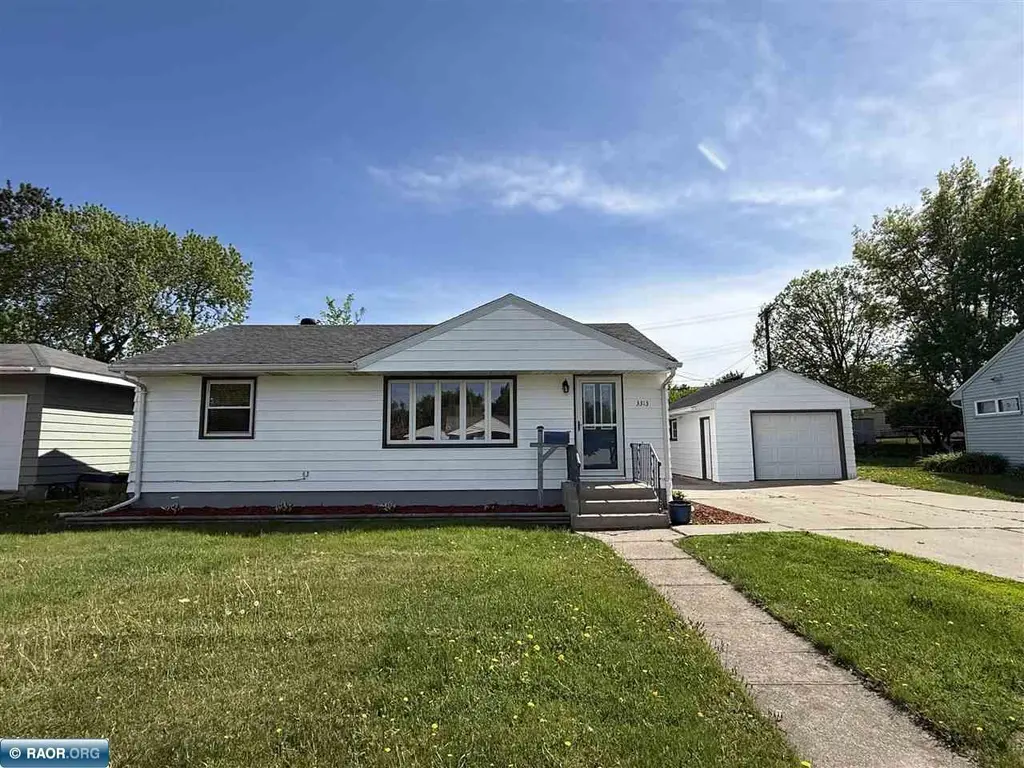
3313 Outer Dr · Hibbing, MN
Flood risk 1/10 · Minimal
- FEMA flood zone
- X
- Chance of flooding over 30 yrs
- 0.0%
- Est. flood insurance / yr
- $473 – $860
Fire risk 5/10 · Moderate
- Est. fire insurance / yr
- $888 – $1,650
Heat risk 1/10 · Minimal
- Hot days now (above 90°F)
- 7 days/yr
- Hot days in 30 yrs
- 12 days/yr
Wind risk 1/10 · Minimal
- Chance of severe wind over 30 yrs
- —
Air-quality risk 2/10 · Minimal
- Unhealthy air days now
- 0 days/yr
- Unhealthy air days in 30 yrs
- 1 days/yr
Risk factors via First Street. Map © Google.
Why this score? — see what drove the F grade
The composite is a weighted blend of 9 inputs, each scored 0–100. Each bar is that input's sub-score; the figure is the points it added to the 100-point composite (weight × sub-score).
- Cash flow +7.5/30.0
- Schools +4.1/10.0
- Livability +4.0/5.0
- Rent growth +2.5/5.0
- Condition / age +2.5/5.0
- DSCR +1.6/10.0
- 1% rule +1.2/10.0
- ARV discount +0.0/15.0
- Appreciation +0.0/10.0
$174,900
🖨 Deal sheet 📄 Offer letter ✓ Due diligence
Listing remarks MLS
Absolutely Adorable 3BR 2Bath Rambler in Greenhaven Near Elementary School Within Blocks of K-12 Schooling and Hospital/Clinic!! This Beauty is Complete From Top to Bottom Coming Fully Furnished With High End Furniture and Appliances!! Everything Stays!! Finished Basement With Sauna, Private Backyard With Storage Shed, Deck, Patio and Entertaining Gazebo!! New Roof, Windows, Flooring, Furnace, Updated Electrical and More!! Nothing at All to do Here!! Move-In Ready!! Enjoy Your New Home!!
Key facts
- Refreshened bathroom
- Newer furnace
- Newer roof
Tags
Property features AI
Exterior
- Parking: Detached 1-car garage
- Utilities: Public water; Public sewer
- Home design: Single-family residence; One story
- Construction: Frame construction with metal siding; Asphalt shingle roof
- Exterior features: Deck; Porch; Screened porch
Interior
- Kitchen: Electric range; Refrigerator; Dishwasher not listed
- Heating & cooling: Central air conditioning; Forced air heating; Natural gas heating
- Interior features: Dryer; Electric range; Refrigerator; Washer; Electric water heater; Full basement
- Laundry & utility: Electric dryer hookup; Washer; Dryer; Electric water heater
Neighborhood map
What this means for you Summary
Snapshot
- This is a 2-bed/2.0-bath single-family listed at $175k.
Deal economics
- At list price, monthly cash flow is $-219 ($-3k/yr) — negative.
- To cash-flow at today's rent, offer at most $136k (22.2% below list).
- To meet the 1% rule (rent ≥ 1% of price), the offer needs to be $108k (38.4% below list).
- Recommended offer: $108k (38.4% below list) — sets the bar for 1% rule.
- Cap rate 4.8% vs local median 6.4% in Hibbing — below-typical yield; the buyer is paying a premium for something (appreciation thesis, condition, location) that the cap rate doesn't capture.
Location & tenants
- Location reads 79/100 on livability (#103 in MN, #2,307 nationally) — a middle-class / working-renter tenant base. Strengths: crime A+, cost of living A+, housing A+; Watch: employment D+, amenities F, commute F.
- Hibbing Public School District (town): math 43% / reading 54% proficiency, ranked #150 of 301 in MN (top 50%) — families likely to look elsewhere, expect single-tenant / working-renter base with shorter leases.
- Market conditions: 96 active listings in the ZIP; 10 comparable units currently listed for rent nearby; rentals leasing fast (median 13d on market — plan ~1-2 weeks tenant-placement turnaround); 639 units permitted in St. Louis County in 2024 (338 in 5+ unit buildings).
Forward outlook
- Local home prices are declining (-3.0%/yr); year-one equity from $1k of loan paydown is wiped out by about $5k of value loss. Plan a longer hold.
Negotiation context
- It's been on market 17 days — a 2% lower offer ($172k) is reasonable based on typical stale-listing flexibility.
- 5 sale attempts since 6y ago with the ask held roughly flat each time — persistent listings suggest the price (not the market) is what's stuck; bring a comps-based counter.
Risks & watch-outs
- Watch-outs: built in 1954 — expect roof / HVAC / electrical / plumbing capex.
- Climate carrying-cost: moderate wildfire risk — expect insurance premiums to compound above CPI over the hold.
Questions for the listing agent
- What do current leases actually rent for vs. the listed asking? Can we see a recent rent roll and the last 12 months of T-12 income?
- Built in 1954 — when were the roof, HVAC, electrical panel, plumbing, and water heater last replaced?
- Is there a deadline driving the sale (1031 exchange, divorce, estate, relocation)? That informs how much negotiation room exists.
- Schools are A-rated — typically a magnet for longer-tenancy family renters. What's the average tenant stay here, and is there a school-zone premium baked into asking?
- The area grade is low — what's the realistic commute time and amenity access for the typical tenant pool here? Any planned neighborhood developments (good or bad) we should know about?
- What's the average days-on-market for RENTAL listings here right now (not sales)? A rising rental-DOM trend means longer vacancies and softer asking-rent achievability than the comps imply.
- What's the recent tenant-quality profile in this submarket — average credit score on applications, eviction rate, late-payment / NSF rate, and stable-employment percentage? A property-management company in the area should have these aggregated.
- How much new for-sale + rental construction is in the pipeline within 1–3 miles? Heavy new supply typically softens prices + rents 12–24 months out; constrained supply supports both.
Investment metrics
- 1% rule
- 0.62% ✗
- Cap rate
- 4.79%
- Cash-on-cash
- -5.37%
- DSCR
- 0.76
- GRM
- 13.5
CMA / ARV
- ARV (on-the-fly)
- $125,208
- Comps found
- 12
Show comp detail 12 sales within ~0.75 mi
| Address | Dist | Beds/Ba | Sqft | Sold | Price | $/sf | Match |
|---|---|---|---|---|---|---|---|
| 3330 Outer Dr | 0.06mi | 2/2.0 | 977 (+10%) | 6mo | $131,500 | $135 | 76 |
| 3718 4th Ave Ave W | 0.49mi | 2/1.0 | 864 (-3%) | 1mo | $123,400 | $143 | 68 |
| 3511 3rd Ave Ave W | 0.36mi | 2/1.0 | 798 (-10%) | 0mo | $132,900 | $167 | 62 |
| 2733 E 7th Ave | 0.47mi | 3/1.0 (+1) | 900 (+1%) | 8mo | $150,000 | $167 | 60 |
| 3825 E 4th Ave | 0.49mi | 2/1.7 | 975 (+10%) | 2mo | $79,000 | $81 | 58 |
| 3417 2nd Ave W | 0.27mi | 2/1.5 | 800 (-10%) | 14mo | $115,900 | $145 | 58 |
| 2608 3rd Ave Ave E | 0.59mi | 3/1.2 (+1) | 890 (+0%) | 16mo | $110,000 | $124 | 50 |
| 3425 2nd Ave Ave W | 0.28mi | 2/2.0 | 1,020 (+15%) | 17mo | $128,500 | $126 | 48 |
| 3112 2nd Ave Ave W | 0.30mi | 2/1.0 | 1,017 (+14%) | 13mo | $120,000 | $118 | 47 |
| 2815 E 4th Ave | 0.41mi | 3/1.5 (+1) | 1,001 (+13%) | 11mo | $141,000 | $141 | 44 |
| 2630 4th Ave Ave W | 0.65mi | 2/1.0 | 820 (-8%) | 12mo | $92,500 | $113 | 42 |
| 3833 3rd Ave Ave W | 0.55mi | 3/1.0 (+1) | 1,001 (+13%) | 7mo | $169,000 | $169 | 38 |
Match score weights: distance 35% · size 25% · config 20% · recency 20%. Top-matched comps best support the ARV.
Projected returns pro-forma
-3.0% appreciation · 3.0% rent growth · sell at horizon
- IRR
- -25.5%
- Equity multiple
- 0.13×
- Total profit
- $-42,381
- Equity at exit
- $26,078
- IRR
- -22.1%
- Equity multiple
- -0.13×
- Total profit
- $-55,172
- Equity at exit
- $15,122
Cash invested: $48,972 (down + closing). Projections, not guarantees.
Landlord ↔ Tenant lean methodology
- Overall (STATE)
- 46 Balanced
- State Minnesota
- 46 Balanced · D+2
- County
- — inherits STATE
- City
- — inherits STATE
ZIP-level market 55746
- Home prices YoY
- -18.7%
- Active inventory
- 96
- Price-to-rent
- 13.5×
Monthly cashflow live
- Estimated rent
- $1,078 high interval (Pro) →
- Mortgage (P&I)
- −$917
- Tax from tax record
- −$81 /mo · $968/yr
- Insurance
- −$73
- HOA
- −$0
- Vacancy / Maint / Mgmt
- −$226
- Net cashflow
- $-219
Break-even live
UW: 25.0% down · 7.5% · 30yr · 1.5% tax · 5.0% vac · 8.0% maint · 8.0% mgmt
Financing live
Cash to close
- Down payment
- $43,725
- Closing costs
- $5,247
- Reserves months
- —
- Total cash needed
- —
Loan-product check · same deal, 3 products live
Conventional
25% down · 7.5% · 30yr
- Down + closing
- —
- Monthly P&I
- —
- Monthly cashflow
- —
- DSCR
- —
- Eligible?
- —
Personal DTI + credit; lowest rate.
DSCR
20% down · 8.5% · 30yr
- Down + closing
- —
- Monthly P&I
- —
- Monthly cashflow
- —
- DSCR
- —
- Eligible?
- —
No personal income docs; deal must DSCR.
Hard money
10% down · 12.0% · 12mo
- Down + closing
- —
- Monthly P&I
- —
- Monthly cashflow
- —
- DSCR
- —
- Eligible?
- —
Short-term bridge; refi at stabilization.
Rent comps 10 comps
| Address | Beds | Baths | Sqft | Rent | $/sqft | DOM | Units | Dist |
|---|---|---|---|---|---|---|---|---|
| 600 E 40th St Hibbing, MN | 1.0–2.0 | 1.0 | 729 | $1,135 | $1.56 | 13d | 1 | 0.75mi |
| 3505 9th Ave W Unit 1 Hibbing, MN | 2.0 | 1.0 | 627 | $750 | $1.20 | 13d | 1 | 0.77mi |
| 3505 9th Ave W Unit 2 Hibbing, MN | 2.0 | 1.0 | 627 | $748 | $1.19 | 13d | 1 | 0.77mi |
| 1606 E 29th St Hibbing, MN | 2.0 | 1.0 | 1000 | $1,160 | $1.16 | 13d | 1 | 1.00mi |
| 1605 E 29th St Hibbing, MN | 2.0 | 1.0 | 1000 | $1,160 | $1.16 | 43d | 1 | 1.00mi |
| 2023 7th Ave E Unit 2023 Hibbing, MN | 1.0 | 1.0 | 546 | $940 | $1.72 | 13d | 1 | 1.02mi |
| 1615 1/2 E 29th St Hibbing, MN | 1.0 | 1.0 | 750 | $940 | $1.25 | 13d | 1 | 1.04mi |
| 1643 E 29th St Hibbing, MN | 2.0 | 1.0 | 1000 | $1,160 | $1.16 | 13d | 1 | 1.04mi |
| 1621 E 29th St Hibbing, MN | 1.0 | 1.0 | 750 | $940 | $1.25 | 13d | 1 | 1.05mi |
| 100 Southview Dr Hibbing, MN | 1.0–3.0 | 1.0 | 833 | $841 | $1.01 | 13d | 1 | 1.43mi |
Listing history 14 events
-
2026-06-19days on market $174,900 Active 17 DOM
-
2026-06-18days on market $174,900 Active 16 DOM
-
2026-06-17days on market $174,900 Active 15 DOM
-
2026-06-16days on market $174,900 Active 14 DOM
-
2026-06-15days on market $174,900 Active 13 DOM
-
2026-06-14days on market $174,900 Active 11 DOM
-
2026-06-13days on market $174,900 Active 10 DOM
-
2026-06-10days on market $174,900 Active 8 DOM
-
2026-06-09days on market $174,900 Active 7 DOM
-
2026-06-08days on market $174,900 Active 6 DOM
-
2026-06-07days on market $174,900 Active 5 DOM
-
2026-06-05days on market $174,900 Active 2 DOM
-
2026-06-03remarks 699-char remark
-
2026-06-03$174,900 Active 1 DOM
ⓘ Source: listings_history table (triggers on properties + properties_extension) + one-shot
backfill from property_details.listing_events for pre-trigger history.
Tax reassessment forecast MN · Partial reset (capped growth)
- Current annual tax
- $968 · $81/mo
- Projected year-2 tax
- $1,463 · $122/mo
- Expected delta
- +$495/yr (+$41/mo · 51.2%)
ⓘ Screening estimate from a state-policy table — verify with the county assessor before closing.
Climate risk First Street
- Flood 1/10 Low FEMA zone X · 0% chance over 30 yrs
- Wildfire 5/10 Major
- Heat 1/10 Low 7 d/yr ≥90°F today · 12 d/yr by 30 yrs out
- Wind 1/10 Low
- Air quality 2/10 Low 0 unhealthy d/yr today · 1 by 30 yrs out
Nearby sold comps map
Loading sold comps map…
Walkable amenities ~0.75 mi
Loading nearby amenities…
Taxation est. · year 1
- Rental income
- $12,932
- − Mortgage interest
- −$9,797
- − Property taxes
- −$968
- − Insurance
- −$874
- − Repairs & maintenance
- −$1,035
- − Management
- −$1,035
- − Depreciation
- −$5,088
- Taxable loss
- −$5,864
- Est. tax savings @ 24.0%
- +$1,407
- After-tax cash flow
- $-1,225/yr
For passive investors: Depreciation is non-cash, so a rental often shows a tax loss while cash-flowing — sheltering income. Rental losses are passive: they offset passive income freely, and up to $25,000/yr can offset ordinary (W-2) income if you actively participate and your MAGI is under $100k (phasing out to $0 by $150k); unused losses carry forward. On sale, claimed depreciation is recaptured at up to 25%, and gains may owe capital-gains tax (a 1031 exchange can defer both). Figures are a year-1 estimate at your 24.0% rate — not tax advice; consult a CPA.
Schools (NCES district)
- District
- Hibbing Public School District
- NCES district ID
- 2713980
- Math proficiency
- 43% ▼ -14.00%
- Reading proficiency
- 54% ▼ -13.00%
- Median HH income
- $41,666
- Composite
- 40.7/100
- National rank
- #3667
- State rank
- #150 of 301 in MN
Livability — Hibbing
- Score
- 79/100
- State rank
- #103
- US rank
- #2307
Category grades
Schools grade is shown separately in the Schools card above.
Census & demographics
- Census place
- Hibbing, MN
- County
- Saint Louis County · 115,152 people
- City population
- 16,730
- Metro
- Duluth, MN-WI
- Population (ZIP)
- 16,730
- Household income
- $55,823
- Rent vs Own
- Severe rent burden
- 623.0
Population outlook (St. Louis County) Hauer SSP2
- Today (2025)
- 202,411 people
- By 2030
- 203,234 · +0.4%
- By 2040
- 202,520 · +0.1%
- By 2050
- 200,853 · -0.8%
- By 2075
- 200,943 · -0.7%
- By 2100
- 192,058 · -5.1%
Race, ethnicity, and origin ACS 2023
- Neighborhood character
- Predominantly White (93%)
- Race & ethnicity
- White 93% Two or more races 4% Black 2% Hispanic / Latino 2%
- Common ancestry
- Portuguese 10% Lithuanian 2% Romanian 2%
- Foreign-born
- 2% · Canada
- Languages at home
- 96% English-only · Spanish 1% German/W. Germanic 1%
Political lean MEDSL · St. Louis
- 2024 margin
- D (+13.7) · D 55.9% · R 42.2% · Other 1.8%
- 2008→2024 swing
- -18.8pp toward R · 2008: 32.5pp · 2024: 13.7pp
- All cycles
- 2024: D+13.7 2020: D+15.6 2016: D+11.8 2012: D+29.6 2008: D+32.5
Not yet ingested
- Civics
- —
Market trends
- HPI YoY
- ▼ -50.85%
- Current HPI
- 220.7198
- Rent YoY
- —
- Metro
- Duluth, MN-WI
- State GDP YoY
- ▲ 2.41%
- F500 in state
- 34
Industry mix (Fortune 500 HQ in MN)
| Industry | F500 HQs | Revenue |
|---|---|---|
| Healthcare | 2 | $407B |
|
||
| Retail | 2 | $150B |
|
||
| Consumer Goods | 2 | $32B |
|
||
| Industrial Machinery | 2 | $6B |
|
||
| Agriculture | 1 | $40B |
|
||
| Healthcare / Medical Devices | 1 | $32B |
|
||
Price history
+104.6% since first listed13 events — show timeline
- 2026-06-02 Listed $174,900 RAOR
- 2024-04-01 Sold (Public Records) $159,000 Public Records
- 2024-03-21 Sold (MLS) $159,000 RAOR
- 2024-03-21 Sold (MLS) $159,000 LSAR
- 2024-02-29 Pending — RAOR
- 2024-02-27 Listed $152,500 RAOR
- 2024-02-27 Listed $152,500 LSAR
- 2020-11-13 Sold (Public Records) $113,000 Public Records
- 2020-08-13 Sold (MLS) $113,000 RAOR
- 2020-08-13 Sold (MLS) $113,000 LSAR
- 2020-05-22 Listed $115,900 RAOR
- 2020-05-21 Listed $115,900 LSAR
- 2010-01-22 Sold (Public Records) $85,500 Public Records
Property tax history
+3.5%/yrLatest (2025): $968 · -20.0% YoY. Source: county tax records.
Cash-flow waterfall
monthlySold comps — $/sqft
last 12 mo · ≤1 miLoading sold comps…