 🏗️ New Construction
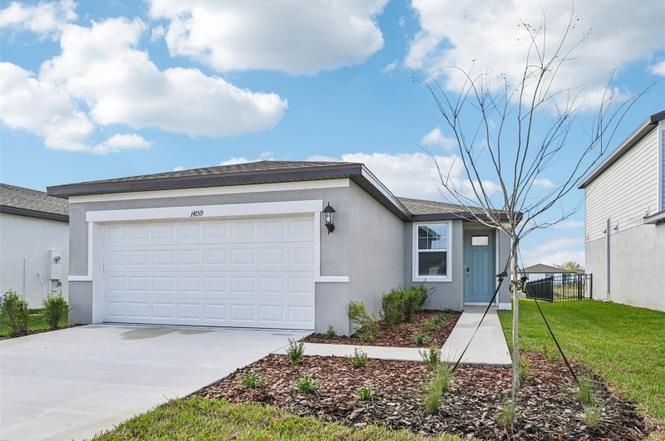
14159 Crutchfield Ct · Ruskin, FL
Flood risk No data
- FEMA flood zone
- —
- Chance of flooding over 30 yrs
- —
- Est. flood insurance / yr
- —
Fire risk No data
- Est. fire insurance / yr
- —
Heat risk No data
- Hot days now (above threshold)
- —
- Hot days in 30 yrs
- —
Wind risk No data
- Chance of severe wind over 30 yrs
- —
Air-quality risk No data
- Unhealthy air days now
- —
- Unhealthy air days in 30 yrs
- —
Risk factors via First Street. Map © Google.
Why this score? — see what drove the D+ grade
The composite is a weighted blend of 9 inputs, each scored 0–100. Each bar is that input's sub-score; the figure is the points it added to the 100-point composite (weight × sub-score).
- Cash flow +16.8/30.0
- ARV discount +7.5/15.0
- DSCR +5.2/10.0
- 1% rule +4.4/10.0
- Schools +4.4/10.0
- Livability +3.6/5.0
- Condition / age +2.5/5.0
- Rent growth +2.3/5.0
- Appreciation +0.0/10.0
$278,000
🖨 Deal sheet 📄 Offer letter ✓ Due diligence
Listing remarks
Under Construction. Brand new, energy-efficient home available by Jan 2026! The Denali floorplan offers an open-concept floorplan with 3 bedrooms, 2 bathrooms, and a 2-car garage. Indulge in a chef-inspired kitchen which overlooks a spacious great room and dining area. Salt Meadows offers new single-family homes in Parrish, FL with a variety of floorplans, both single-story and two-story. Residents will enjoy resort-style amenities including a large community pool, clubhouse with fitness center, sports courts, playground and more. With close proximity to I-75, this community offers easy access to St. Pete, Bradenton, Sarasota and beautiful gulf coast beaches. Schedule a tour today. Each of
Key facts
- Fitness center
- Community pool
- Sports courts
Tags
Neighborhood map
What this means for you Summary
Snapshot
- This is a 3-bed/2.0-bath land listed at $278k.
Deal economics
- At list price, monthly cash flow is $178 ($2k/yr) — positive.
- The deal already cash-flows at list — no discount required.
- To meet the 1% rule (rent ≥ 1% of price), the offer needs to be $262k (5.6% below list).
- Recommended offer: $253k (9.0% below list) — sets the bar for market timing.
- Cap rate 7.1% vs local median 4.7% in Ruskin — top-decile yield for the area; either an underpriced asset or a hidden risk that comps aren't pricing in. Stress-test before assuming the spread holds.
Location & tenants
- Location reads 71/100 on livability (#392 in FL) — a middle-class / working-renter tenant base. Strengths: cost of living A+, housing A+, commute B+; Watch: amenities F, health & safety F.
- Manatee (suburban): math 54% / reading 50% proficiency, ranked #26 of 73 in FL (top 36%) — acceptable for families but not a draw, mixed tenant base, ~2y average lease.
- Zoned schools: Annie Lucy Williams Elementary School (math 80% / reading 73%, grade A, #185 of 2,144 statewide, top 9%, 798 students, 31% FRL); Parrish Community High School (math 47% / reading 57%, grade D+, #160 of 667 statewide, top 25%, 2,017 students, 32% FRL) — zoned schools average 32% FRL vs 51% district-wide (19 pts lower); this property's tenant base skews higher-income than the district average.
- Zoned-school proficiency averages 64% at this address vs 52% district-wide (+12 pts) — the actual schools serving this property are materially stronger than the Manatee average implies; a family-tenant draw the district grade alone would hide.
- Market conditions: Rents soft (-0.9%/yr); 2170 active listings in the ZIP; 4 comparable units currently listed for rent nearby; rentals at typical pace (median 16d on market — plan ~3-4 weeks tenant-placement turnaround); high-income renter base; 7,472 units permitted in Manatee County in 2024 (1,782 in 5+ unit buildings).
Forward outlook
- Local home prices are declining (-3.0%/yr); year-one equity from $2k of loan paydown is wiped out by about $8k of value loss. Plan a longer hold.
- Manatee County population projected at +43% by 2050 — long-run rental-demand tailwind backs the buy-and-hold thesis.
Negotiation context
- It's been on market 94 days — a 9% lower offer ($253k) is reasonable based on typical stale-listing flexibility.
Questions for the listing agent
- It's been on market 94 days. Have you received any prior offers? Is the seller open to a 9% concession, seller financing, or rate buy-down credit?
- What does the HOA fee cover, when was the last increase, and are there any pending special assessments or reserve-fund shortfalls?
- Why hasn't it sold? Are there any deal-killer items the seller is aware of (foundation, flood, title, zoning, code violations)?
- Is there a deadline driving the sale (1031 exchange, divorce, estate, relocation)? That informs how much negotiation room exists.
- Schools are F-rated, which usually means shorter tenancies and higher turnover. Who's the typical renter profile here, and what's been the actual vacancy rate?
- The area grade is low — what's the realistic commute time and amenity access for the typical tenant pool here? Any planned neighborhood developments (good or bad) we should know about?
- What's the average days-on-market for RENTAL listings here right now (not sales)? A rising rental-DOM trend means longer vacancies and softer asking-rent achievability than the comps imply.
- What's the recent tenant-quality profile in this submarket — average credit score on applications, eviction rate, late-payment / NSF rate, and stable-employment percentage? A property-management company in the area should have these aggregated.
- How much new for-sale + rental construction is in the pipeline within 1–3 miles? Heavy new supply typically softens prices + rents 12–24 months out; constrained supply supports both.
Investment metrics
- 1% rule
- 0.94% ✗
- Cap rate
- 7.06%
- Cash-on-cash
- 2.74%
- DSCR
- 1.12
- GRM
- 8.8
CMA / ARV
No comps found within radius.
Projected returns pro-forma
-3.0% appreciation · 0.0% rent growth · sell at horizon
- IRR
- -15.4%
- Equity multiple
- 0.47×
- Total profit
- $-41,406
- Equity at exit
- $41,451
- IRR
- -12.9%
- Equity multiple
- 0.34×
- Total profit
- $-51,118
- Equity at exit
- $24,036
Cash invested: $77,840 (down + closing). Projections, not guarantees.
Landlord ↔ Tenant lean methodology
- Overall (STATE)
- 87 Strongly Landlord-Friendly
- State Florida
- 87 Strongly Landlord-Friendly · R+3
- County
- — inherits STATE
- City
- — inherits STATE
ZIP-level market 34219
- Home prices YoY
- -23.7%
- Rents YoY
- -0.9%
- Active inventory
- 2170
- Price-to-rent
- 8.8×
Monthly cashflow live
- Estimated rent
- $2,624 medium interval (Pro) →
- Mortgage (P&I)
- −$1,458
- Tax from tax record
- −$310 /mo · $3,720/yr
- Insurance
- −$116
- HOA
- −$12
- Vacancy / Maint / Mgmt
- −$551
- Net cashflow
- $178
Break-even live
UW: 25.0% down · 7.5% · 30yr · 1.5% tax · 5.0% vac · 8.0% maint · 8.0% mgmt
Financing live
Cash to close
- Down payment
- $69,500
- Closing costs
- $8,340
- Reserves months
- —
- Total cash needed
- —
Loan-product check · same deal, 3 products live
Conventional
25% down · 7.5% · 30yr
- Down + closing
- —
- Monthly P&I
- —
- Monthly cashflow
- —
- DSCR
- —
- Eligible?
- —
Personal DTI + credit; lowest rate.
DSCR
20% down · 8.5% · 30yr
- Down + closing
- —
- Monthly P&I
- —
- Monthly cashflow
- —
- DSCR
- —
- Eligible?
- —
No personal income docs; deal must DSCR.
Hard money
10% down · 12.0% · 12mo
- Down + closing
- —
- Monthly P&I
- —
- Monthly cashflow
- —
- DSCR
- —
- Eligible?
- —
Short-term bridge; refi at stabilization.
Rent comps 4 comps
| Address | Beds | Baths | Sqft | Rent | $/sqft | DOM | Units | Dist |
|---|---|---|---|---|---|---|---|---|
| 7148 Boggy Creek Pl Parrish, FL | 3.0 | 2.0 | 1269 | $1,929 | $1.52 | 2d | 1 | 0.61mi |
| 8850 Ginko Run Parrish, FL | 3.0 | 2.5 | 1691 | $2,600 | $1.54 | 15d | 1 | 0.82mi |
| 12484 Oak Hill Way Parrish, FL | 3.0 | 2.0 | 1518 | $2,600 | $1.71 | 23d | 1 | 1.15mi |
| 12573 Oak Hill Way Parrish, FL | 3.0 | 2.0 | 1518 | $2,500 | $1.65 | 3d | 1 | 1.30mi |
HOA detail
- Monthly dues
- $12 · $144/yr
- Likely covers
- poolgym
Listing history 9 events
-
2026-04-02status Pending
-
2026-03-06price $278,000
-
2026-02-27price $287,800
-
2026-02-20price $285,000
-
2026-02-07price $288,000
-
2026-01-30price $288,780
-
2026-01-22price $289,000
-
2026-01-08price $299,000
-
2025-12-29$313,730 Active
ⓘ Source: listings_history table (triggers on properties + properties_extension) + one-shot
backfill from property_details.listing_events for pre-trigger history.
Tax reassessment forecast FL · Resets to sale price
- Current annual tax
- $3,720 · $310/mo
- Projected year-2 tax
- $3,720 · $310/mo
- Expected delta
- $0/yr ($0/mo · 0.0%)
ⓘ Screening estimate from a state-policy table — verify with the county assessor before closing.
Nearby sold comps map
Loading sold comps map…
Walkable amenities ~0.75 mi
Loading nearby amenities…
Taxation est. · year 1
- Rental income
- $31,492
- − Mortgage interest
- −$15,572
- − Property taxes
- −$3,720
- − Insurance
- −$1,390
- − Repairs & maintenance
- −$2,519
- − Management
- −$2,519
- − HOA
- −$144
- − Depreciation
- −$8,087
- Taxable loss
- −$2,460
- Est. tax savings @ 24.0%
- +$590
- After-tax cash flow
- $2,721/yr
For passive investors: Depreciation is non-cash, so a rental often shows a tax loss while cash-flowing — sheltering income. Rental losses are passive: they offset passive income freely, and up to $25,000/yr can offset ordinary (W-2) income if you actively participate and your MAGI is under $100k (phasing out to $0 by $150k); unused losses carry forward. On sale, claimed depreciation is recaptured at up to 25%, and gains may owe capital-gains tax (a 1031 exchange can defer both). Figures are a year-1 estimate at your 24.0% rate — not tax advice; consult a CPA.
Schools (NCES district)
- District
- Manatee
- NCES district ID
- 1201230
- Math proficiency
- 54% ▼ -6.00%
- Reading proficiency
- 50% ▼ -2.00%
- Median HH income
- $49,607
- Composite
- 44.43/100
- National rank
- #2806
- State rank
- #26 of 73 in FL
Livability — Ruskin
- Score
- 71/100
- State rank
- #392
- US rank
- #6879
Category grades
Schools grade is shown separately in the Schools card above.
Census & demographics
- County
- Manatee County · 416,364 people
- City population
- 33,319
- Metro
- North Port-Sarasota-Bradenton, FL
- Population (ZIP)
- 33,296
- Household income
- $113,773
- Rent vs Own
- Severe rent burden
- 219.0
Population outlook (Manatee County) Hauer SSP2
- Today (2025)
- 447,342 people
- By 2030
- 488,911 · +9.3%
- By 2040
- 567,934 · +27.0%
- By 2050
- 637,995 · +42.6%
- By 2075
- 781,970 · +74.8%
- By 2100
- 848,272 · +89.6%
Race, ethnicity, and origin ACS 2023
- Neighborhood character
- Predominantly White (75%)
- Race & ethnicity
- White 75% Hispanic / Latino 11% Two or more races 8% Black 8% Asian 2%
- Hispanic origin (detail)
- Mexican 2% Puerto Rican 3%
- Common ancestry
- Romanian 4% Hispanic 2% Russian 2%
- Foreign-born
- 10% · Canada, Dominican Republic, Jamaica
- Languages at home
- 88% English-only · Spanish 7% French/Haitian/Cajun 2% Other Asian/Pacific 1%
Political lean MEDSL · Manatee
- 2024 margin
- Strong R (+23.5) · D 37.9% · R 61.4%
- 2008→2024 swing
- -16.5pp toward R · 2008: -7.0pp · 2024: -23.5pp
- All cycles
- 2024: R+23.5 2020: R+16.1 2016: R+17.1 2012: R+12.5 2008: R+7.0
Not yet ingested
- Civics
- —
Market trends
- HPI YoY
- ▼ -84.45%
- Current HPI
- 271.7131
- Rent YoY
- ▼ -0.95%
- Metro
- North Port-Sarasota-Bradenton, FL
- State GDP YoY
- ▲ 3.28%
- F500 in state
- 36
Industry mix (Fortune 500 HQ in FL)
| Industry | F500 HQs | Revenue |
|---|---|---|
| Industrial Technology | 2 | $29B |
|
||
| Insurance | 2 | $17B |
|
||
| Retail | 1 | $60B |
|
||
| Technology Distribution | 1 | $58B |
|
||
| Homebuilding | 1 | $35B |
|
||
| Technology Manufacturing | 1 | $35B |
|
||
Price history
-11.4% since first listed9 events — show timeline
- 2026-04-02 Pending — Stellar MLS as Distributed by MLS Grid
- 2026-03-06 Price Changed $278,000 Stellar MLS as Distributed by MLS Grid
- 2026-02-27 Price Changed $287,800 Stellar MLS as Distributed by MLS Grid
- 2026-02-20 Price Changed $285,000 Stellar MLS as Distributed by MLS Grid
- 2026-02-07 Price Changed $288,000 Stellar MLS as Distributed by MLS Grid
- 2026-01-30 Price Changed $288,780 Stellar MLS as Distributed by MLS Grid
- 2026-01-22 Price Changed $289,000 Stellar MLS as Distributed by MLS Grid
- 2026-01-08 Price Changed $299,000 Stellar MLS as Distributed by MLS Grid
- 2025-12-29 Listed $313,730 Stellar MLS as Distributed by MLS Grid
Property tax history
+601.1%/yrLatest (2025): $3,720 · +601.1% YoY. Source: county tax records.
Cash-flow waterfall
monthlySold comps — $/sqft
last 12 mo · ≤1 miLoading sold comps…