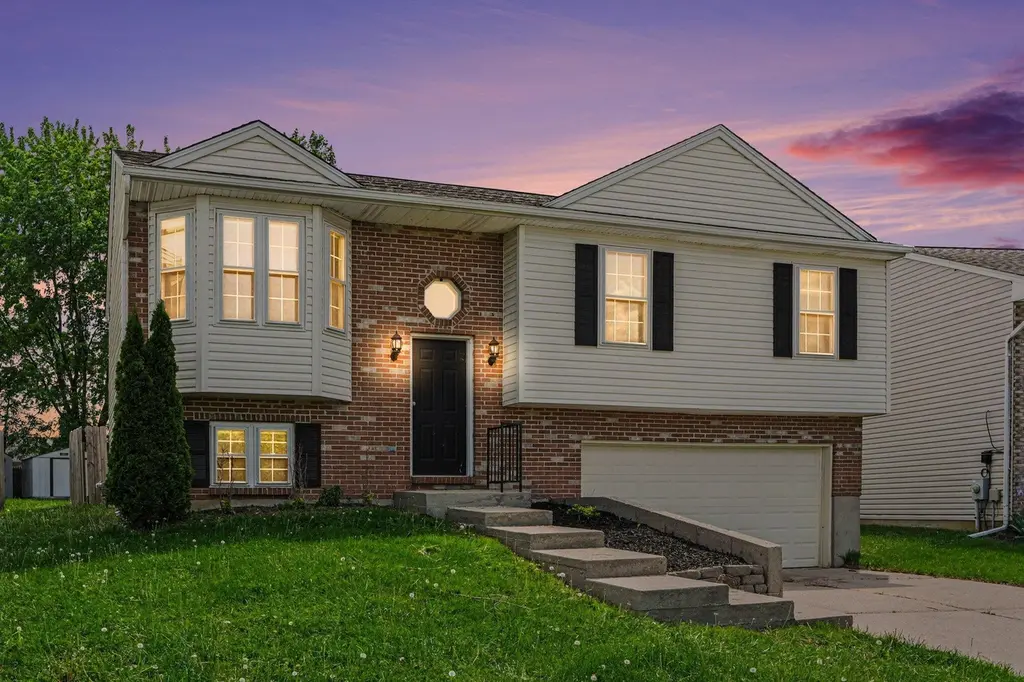
1747 Apple Cider Dr · Hebron, KY
Flood risk 1/10 · Minimal
- FEMA flood zone
- X (unshaded)
- Chance of flooding over 30 yrs
- 0.0%
- Est. flood insurance / yr
- $473 – $860
Fire risk 2/10 · Minimal
- Est. fire insurance / yr
- $839 – $1,559
Heat risk 4/10 · Minor
- Hot days now (above 101°F)
- 7 days/yr
- Hot days in 30 yrs
- 19 days/yr
Wind risk 2/10 · Minimal
- Chance of severe wind over 30 yrs
- 1.0%
Air-quality risk 2/10 · Minimal
- Unhealthy air days now
- 1 days/yr
- Unhealthy air days in 30 yrs
- 2 days/yr
Risk factors via First Street. Map © Google.
Why this score? — see what drove the D grade
The composite is a weighted blend of 9 inputs, each scored 0–100. Each bar is that input's sub-score; the figure is the points it added to the 100-point composite (weight × sub-score).
- Cash flow +11.0/30.0
- ARV discount +10.7/15.0
- Schools +4.1/10.0
- Livability +4.0/5.0
- DSCR +3.2/10.0
- Rent growth +2.5/5.0
- Condition / age +2.5/5.0
- 1% rule +2.4/10.0
- Appreciation +0.0/10.0
$265,000
🖨 Deal sheet (PDF) 📄 Offer letter ✓ Due diligence
Listing remarks MLS
Newly rehabbed & in move in condition! Pretty bay window! New: Carpet & padding, nickel doorknobs/hinges throughout, dimensional roof shingles, 42" Cognac kitchen cabinetry, modern bath vanities with granite tops, light fixtures, faucets, paint, insulated garage door, rear deck, blinds, wood laminate floor kitchen & dining rooms, stainless steel Whirlpool appliances.
Key facts
- Brick front
- Newer hvac systems
- Deck off the kitchen
Tags
Neighborhood map
What this means for you Summary
Snapshot
- This is a 3-bed/2.0-bath single-family listed at $265k.
Deal economics
- At list price, monthly cash flow is $-112 ($-1k/yr) — negative.
- To cash-flow at today's rent, offer at most $245k (7.5% below list).
- To meet the 1% rule (rent ≥ 1% of price), the offer needs to be $196k (26.0% below list).
- Recommended offer: $196k (26.0% below list) — sets the bar for 1% rule.
- Cap rate 5.8% vs local median 3.8% in Hebron — top-decile yield for the area; either an underpriced asset or a hidden risk that comps aren't pricing in. Stress-test before assuming the spread holds.
Location & tenants
- Location reads 80/100 on livability (#69 in KY, #1,700 nationally) — a professional / high-income tenant draw. Strengths: crime A+, employment A+, cost of living A+; Watch: amenities F, commute F.
- Boone County (suburban): math 43% / reading 49% proficiency, ranked #12 of 165 in KY (top 7%) — families likely to look elsewhere, expect single-tenant / working-renter base with shorter leases.
- Zoned schools: Chester Goodridge Elementary School (math 39% / reading 51%, grade D-, #143 of 676 statewide, top 22%, 633 students, 45% FRL); Conner Middle School (math 50% / reading 62%, grade B-, #6 of 217 statewide, top 2%, 896 students, 35% FRL); Conner High School (math 47% / reading 51%, grade D, #15 of 254 statewide, top 6%, 1,443 students, 33% FRL).
- Market conditions: 202 active listings in the ZIP; 1 comparable units currently listed for rent nearby; high-income renter base; 1,430 units permitted in Boone County in 2024 (928 in 5+ unit buildings).
- This rent is only 17% of the median local income ($137k/yr) — well below the 30% rent-burden line; pricing power to push rent on renewal without tenant pushback.
Forward outlook
- Local home prices are declining (-3.0%/yr); year-one equity from $2k of loan paydown is wiped out by about $8k of value loss. Plan a longer hold.
- Boone County population projected at +24% by 2050 — long-run rental-demand tailwind backs the buy-and-hold thesis.
Negotiation context
- Only 2 days on market — expect competitive offers; lowballing is unlikely to land.
- 6 sale attempts since 29y ago with the ask held roughly flat each time — persistent listings suggest the price (not the market) is what's stuck; bring a comps-based counter.
- Current owner paid $168k; list at $265k implies a 58% gain — meaningful room to come down on a strong offer.
Questions for the listing agent
- What do current leases actually rent for vs. the listed asking? Can we see a recent rent roll and the last 12 months of T-12 income?
- Is there a deadline driving the sale (1031 exchange, divorce, estate, relocation)? That informs how much negotiation room exists.
- Schools are A-rated — typically a magnet for longer-tenancy family renters. What's the average tenant stay here, and is there a school-zone premium baked into asking?
- The area grade is low — what's the realistic commute time and amenity access for the typical tenant pool here? Any planned neighborhood developments (good or bad) we should know about?
- What's the average days-on-market for RENTAL listings here right now (not sales)? A rising rental-DOM trend means longer vacancies and softer asking-rent achievability than the comps imply.
- What's the recent tenant-quality profile in this submarket — average credit score on applications, eviction rate, late-payment / NSF rate, and stable-employment percentage? A property-management company in the area should have these aggregated.
- How much new for-sale + rental construction is in the pipeline within 1–3 miles? Heavy new supply typically softens prices + rents 12–24 months out; constrained supply supports both.
Investment metrics
- 1% rule
- 0.74% ✗
- Cap rate
- 5.79%
- Cash-on-cash
- -1.81%
- DSCR
- 0.92
- GRM
- 11.3
CMA / ARV
- ARV (on-the-fly)
- $285,600
- Comps found
- 9
Show comp detail 9 sales within ~0.75 mi
| Address | Dist | Beds/Ba | Sqft | Sold | Price | $/sf | Match |
|---|---|---|---|---|---|---|---|
| 1731 Apple Cider Dr | 0.04mi | 3/3.0 | 1,055 (+0%) | 13mo | $287,000 | $272 | 82 |
| 3677 Jonathan Dr | 0.08mi | 3/2.5 | 1,004 (-4%) | 13mo | $273,000 | $272 | 76 |
| 3797 Sugarberry Dr | 0.17mi | 3/2.5 | 1,044 (-1%) | 22mo | $268,000 | $257 | 71 |
| 3745 Jonathan Dr | 0.23mi | 3/2.0 | 1,080 (+3%) | 18mo | $265,000 | $245 | 69 |
| 1789 Nicole Lauren Ln | 0.56mi | 3/2.0 | 1,024 (-2%) | 1mo | $315,000 | $308 | 69 |
| 3701 Jonathan Dr | 0.10mi | 3/2.0 | 940 (-10%) | 14mo | $273,000 | $290 | 66 |
| 3712 Jonathan Dr | 0.15mi | 3/2.0 | 971 (-8%) | 21mo | $235,000 | $242 | 63 |
| 3848 Sugarberry Dr | 0.27mi | 3/2.5 | 1,004 (-4%) | 22mo | $255,000 | $254 | 60 |
| 1698 Asher Ct | 0.58mi | 3/2.5 | 1,059 (+1%) | 22mo | $323,000 | $305 | 52 |
Match score weights: distance 35% · size 25% · config 20% · recency 20%. Top-matched comps best support the ARV.
Projected returns pro-forma
-3.0% appreciation · 3.0% rent growth · sell at horizon
- IRR
- -19.3%
- Equity multiple
- 0.32×
- Total profit
- $-50,161
- Equity at exit
- $39,512
- IRR
- -12.1%
- Equity multiple
- 0.28×
- Total profit
- $-53,185
- Equity at exit
- $22,912
Cash invested: $74,200 (down + closing). Projections, not guarantees.
Landlord ↔ Tenant lean methodology
- Overall (STATE)
- 83 Strongly Landlord-Friendly
- State Kentucky
- 83 Strongly Landlord-Friendly · R+16
- County
- — inherits STATE
- City
- — inherits STATE
ZIP-level market 41048
- Home prices YoY
- -31.1%
- Active inventory
- 202
- Price-to-rent
- 11.3×
Monthly cashflow live
- Estimated rent
- $1,960 medium interval (Pro) →
- Mortgage (P&I)
- −$1,390
- Tax from tax record
- −$160 /mo · $1,922/yr
- Insurance
- −$110
- HOA
- −$0
- Vacancy / Maint / Mgmt
- −$412
- Net cashflow
- $-112
Break-even live
Sensitivity live
| Price | -10% $38 | -5% $-37 | +0% $-112 | +5% $-187 | +10% $-262 |
|---|---|---|---|---|---|
| Rent | -10% $-267 | -5% $-190 | +0% $-112 | +5% $-35 | +10% $43 |
| Rate | -1.0pp $21 | -0.5pp $-45 | base $-112 | +0.5pp $-181 | +1.0pp $-251 |
UW: 25.0% down · 7.5% · 30yr · 1.5% tax · 5.0% vac · 8.0% maint · 8.0% mgmt
Financing live
Cash to close
- Down payment
- $66,250
- Closing costs
- $7,950
- Reserves months
- —
- Total cash needed
- —
Loan-product check · same deal, 3 products live
Conventional
25% down · 7.5% · 30yr
- Down + closing
- —
- Monthly P&I
- —
- Monthly cashflow
- —
- DSCR
- —
- Eligible?
- —
Personal DTI + credit; lowest rate.
DSCR
20% down · 8.5% · 30yr
- Down + closing
- —
- Monthly P&I
- —
- Monthly cashflow
- —
- DSCR
- —
- Eligible?
- —
No personal income docs; deal must DSCR.
Hard money
10% down · 12.0% · 12mo
- Down + closing
- —
- Monthly P&I
- —
- Monthly cashflow
- —
- DSCR
- —
- Eligible?
- —
Short-term bridge; refi at stabilization.
Rent comps 1 comps
| Address | Beds | Baths | Sqft | Rent | $/sqft | DOM | Units | Dist |
|---|---|---|---|---|---|---|---|---|
| 3465 Hebron Station Dr Hebron, KY | 1.0–2.0 | 1.0–2.0 | 819 | $1,510 | $1.84 | 4d | 20 | 0.64mi |
Listing history 18 events
-
2026-04-27status Pending
-
2026-04-25$265,000 Active
-
2018-08-27soldstatus $167,500
-
2018-08-23soldstatus $167,500 388-char remark
Show marketing remark (388 chars)
Newly rehabbed & in move in condition! Pretty bay window! New: Carpet & padding, nickel doorknobs/hinges throughout, dimensional roof shingles, 42" Cognac kitchen cabinetry, modern bath vanities with granite tops, light fixtures, faucets, paint, insulated garage door, rear deck, blinds, wood laminate floor kitchen & dining rooms, stainless steel Whirlpool appliances.
-
2018-07-14$164,500 388-char remark
Show marketing remark (388 chars)
Newly rehabbed & in move in condition! Pretty bay window! New: Carpet & padding, nickel doorknobs/hinges throughout, dimensional roof shingles, 42" Cognac kitchen cabinetry, modern bath vanities with granite tops, light fixtures, faucets, paint, insulated garage door, rear deck, blinds, wood laminate floor kitchen & dining rooms, stainless steel Whirlpool appliances.
-
2018-05-21soldstatus $112,000
-
2010-03-15soldstatus $134,900
-
2009-03-12soldstatus $134,900 240-char remark
Show marketing remark (240 chars)
You Are Going to Love this ONE!Freshly Painted, New Carpet*New Kitchen Appliances*Designer Lighting*2 1/2 Baths*A Spectacular Garage*Wall of Cabinets*Finished for a Workout Room or Party Room w.Lots of Lighting*Fabulous Workshop/Hobby Room!
-
2008-12-31$134,900 240-char remark
Show marketing remark (240 chars)
You Are Going to Love this ONE!Freshly Painted, New Carpet*New Kitchen Appliances*Designer Lighting*2 1/2 Baths*A Spectacular Garage*Wall of Cabinets*Finished for a Workout Room or Party Room w.Lots of Lighting*Fabulous Workshop/Hobby Room!
-
2005-06-03soldstatus $116,145
-
2005-04-15$111,000
-
2002-10-31soldstatus $118,500
-
2002-10-25soldstatus $118,500
-
2002-06-12$115,000
-
1997-11-14soldstatus $97,900
-
1997-10-30soldstatus $97,900
-
1997-08-29$92,900
-
1997-02-04soldstatus $100,000
ⓘ Source: listings_history table (triggers on properties + properties_extension) + one-shot
backfill from property_details.listing_events for pre-trigger history.
Tax reassessment forecast KY · Resets to sale price
- Current annual tax
- $1,922 · $160/mo
- Projected year-2 tax
- $2,279 · $190/mo
- Expected delta
- +$357/yr (+$30/mo · 18.5%)
ⓘ Screening estimate from a state-policy table — verify with the county assessor before closing.
Climate risk First Street
- Flood 1/10 Low FEMA zone X (unshaded) · 0% chance over 30 yrs
- Wildfire 2/10 Low
- Heat 4/10 Moderate 7 d/yr ≥101°F today · 19 d/yr by 30 yrs out
- Wind 2/10 Low 100% chance of damaging wind over 30 yrs
- Air quality 2/10 Low 1 unhealthy d/yr today · 2 by 30 yrs out
Nearby sold comps map
Loading sold comps map…
Walkable amenities ~0.75 mi
Loading nearby amenities…
Taxation est. · year 1
- Rental income
- $23,516
- − Mortgage interest
- −$14,844
- − Property taxes
- −$1,922
- − Insurance
- −$1,325
- − Repairs & maintenance
- −$1,881
- − Management
- −$1,881
- − Depreciation
- −$7,709
- Taxable loss
- −$6,047
- Est. tax savings @ 24.0%
- +$1,451
- After-tax cash flow
- $105/yr
For passive investors: Depreciation is non-cash, so a rental often shows a tax loss while cash-flowing — sheltering income. Rental losses are passive: they offset passive income freely, and up to $25,000/yr can offset ordinary (W-2) income if you actively participate and your MAGI is under $100k (phasing out to $0 by $150k); unused losses carry forward. On sale, claimed depreciation is recaptured at up to 25%, and gains may owe capital-gains tax (a 1031 exchange can defer both). Figures are a year-1 estimate at your 24.0% rate — not tax advice; consult a CPA.
Schools (NCES district)
- District
- Boone County
- NCES district ID
- 2100510
- Math proficiency
- 43% ▼ -10.00%
- Reading proficiency
- 49% ▼ -12.00%
- Median HH income
- $68,096
- Composite
- 41.18/100
- National rank
- #3550
- State rank
- #12 of 165 in KY
Livability — Hebron
- Score
- 80/100
- State rank
- #69
- US rank
- #1700
Category grades
Schools grade is shown separately in the Schools card above.
Census & demographics
- Census place
- Hebron, KY
- County
- Boone County · 99,563 people
- City population
- 16,211
- Metro
- Cincinnati, OH-KY-IN
- Population (ZIP)
- 16,211
- Household income
- $137,398
- Rent vs Own
- Severe rent burden
- 169.0
Population outlook (Boone County) Hauer SSP2
- Today (2025)
- 144,066 people
- By 2030
- 152,005 · +5.5%
- By 2040
- 166,776 · +15.8%
- By 2050
- 178,974 · +24.2%
- By 2075
- 204,515 · +42.0%
- By 2100
- 215,306 · +49.4%
Race, ethnicity, and origin ACS 2023
- Neighborhood character
- Predominantly White (86%)
- Race & ethnicity
- White 86% Hispanic / Latino 7% Two or more races 6% Asian 2% Black 2%
- Hispanic origin (detail)
- Mexican 3% Puerto Rican 2%
- Common ancestry
- Slovak 2% Lithuanian 2% Scottish 2%
- Foreign-born
- 6% · Canada
- Languages at home
- 91% English-only · Spanish 5% Other Indo-European 1% German/W. Germanic 1%
Political lean MEDSL · Boone
- 2024 margin
- Solid R (+37.2) · D 30.6% · R 67.8% · Other 1.7%
- 2008→2024 swing
- -2.7pp toward R · 2008: -34.5pp · 2024: -37.2pp
- All cycles
- 2024: R+37.2 2020: R+35.7 2016: R+41.8 2012: R+38.7 2008: R+34.5
Not yet ingested
- Civics
- —
Market trends
- HPI YoY
- ▼ -85.70%
- Current HPI
- 189.8568
- Rent YoY
- —
- Metro
- Cincinnati, OH-KY-IN
- State GDP YoY
- ▲ 1.81%
- F500 in state
- 4
Industry mix (Fortune 500 HQ in KY)
| Industry | F500 HQs | Revenue |
|---|---|---|
| Healthcare | 1 | $118B |
|
||
| Food / Beverage | 1 | $7B |
|
||
Price history
+165.0% since first listed18 events — show timeline
- 2026-04-27 Pending — NKMLS
- 2026-04-25 Listed $265,000 NKMLS
- 2018-08-27 Sold (Public Records) $167,500 Public Records
- 2018-08-23 Sold (MLS) $167,500 NKMLS
- 2018-07-14 Listed $164,500 NKMLS
- 2018-05-21 Sold (Public Records) $112,000 Public Records
- 2010-03-15 Sold (Public Records) $134,900 Public Records
- 2009-03-12 Sold (MLS) $134,900 NKMLS
- 2008-12-31 Listed $134,900 NKMLS
- 2005-06-03 Sold (MLS) $116,145 NKMLS
- 2005-04-15 Listed $111,000 NKMLS
- 2002-10-31 Sold (Public Records) $118,500 Public Records
- 2002-10-25 Sold (MLS) $118,500 NKMLS
- 2002-06-12 Listed $115,000 NKMLS
- 1997-11-14 Sold (Public Records) $97,900 Public Records
- 1997-10-30 Sold (MLS) $97,900 NKMLS
- 1997-08-29 Listed $92,900 NKMLS
- 1997-02-04 Sold (Public Records) $100,000 Public Records
Property tax history
+2.7%/yrLatest (2025): $1,922 · +1.8% YoY. Source: county tax records.
Cash-flow waterfall
monthlySold comps — $/sqft
last 12 mo · ≤1 miLoading sold comps…