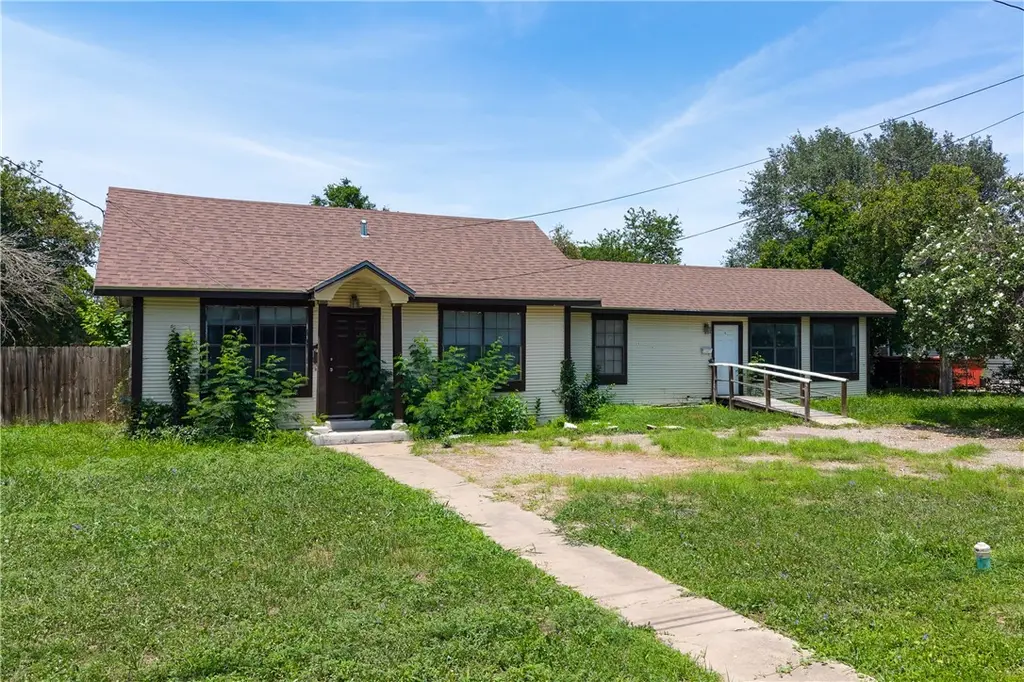
801 E 1st St · Alice, TX
Flood risk No data
- FEMA flood zone
- —
- Chance of flooding over 30 yrs
- —
- Est. flood insurance / yr
- —
Fire risk No data
- Est. fire insurance / yr
- —
Heat risk No data
- Hot days now (above threshold)
- —
- Hot days in 30 yrs
- —
Wind risk No data
- Chance of severe wind over 30 yrs
- —
Air-quality risk No data
- Unhealthy air days now
- —
- Unhealthy air days in 30 yrs
- —
Risk factors via First Street. Map © Google.
Why this score? — see what drove the C grade
The composite is a weighted blend of 9 inputs, each scored 0–100. Each bar is that input's sub-score; the figure is the points it added to the 100-point composite (weight × sub-score).
- Cash flow +26.2/30.0
- DSCR +8.9/10.0
- ARV discount +7.5/15.0
- 1% rule +7.0/10.0
- Livability +3.4/5.0
- Rent growth +2.5/5.0
- Condition / age +2.2/5.0
- Schools +1.5/10.0
- Appreciation +0.0/10.0
$89,500
🖨 Deal sheet 📄 Offer letter ✓ Due diligence
Listing remarks MLS
Currently zoned commercial. new roof 2023. Two separate areas. Could be re-zoned residential and used as duplex. Side 1: living room, two rooms, full kitchen and half bath. Side 2: Living area bath, full kitchen, full bath.
Key facts
- Newer roof installed
- Two kitchens
- Corner lot location
Tags
Property features AI
Exterior
- Parking: Asphalt parking
- Utilities: Public water; Public sewer; Water and sewer available
- Home design: Single-story; Shingle roof; Pillar/post/pier foundation
- Construction: Pillar/Post/Pier foundation; Shingle roof
- Exterior features: Handicap accessible; Chain link fencing; Corner lot
Interior
- Flooring: Hardwood; Vinyl
- Bathrooms: 1 full bathroom; 1 half bathroom
- Heating & cooling: Window unit heating; Window unit cooling
- Interior features: Hardwood and vinyl floors; Other interior features
Neighborhood map
What this means for you Summary
Snapshot
- This is a 2-bed/1.5-bath single-family listed at $90k. Condition is rated fair.
Deal economics
- At list price, monthly cash flow is $230 ($3k/yr) — positive.
- The deal already cash-flows at list — no discount required.
- Meets the 1% rule at list price ($1k rent vs $90k).
- Recommended offer: $88k (1.5% below list) — sets the bar for market timing.
- Cap rate 9.4% vs local median 4.1% in Alice — top-decile yield for the area; either an underpriced asset or a hidden risk that comps aren't pricing in. Stress-test before assuming the spread holds.
Location & tenants
- Location reads 67/100 on livability (#558 in TX) — a middle-class / working-renter tenant base. Strengths: cost of living A+, health & safety A+, housing A; Watch: employment D, schools D-, crime F.
- Alice ISD (town): math 12% / reading 23% proficiency, ranked #799 of 826 in TX (top 97%) — low school quality limits family demand, transient renter base, plan for 1-2y turnover; 70% free/reduced lunch — lower-income household profile, screen leases tightly.
- Market conditions: 220 active listings in the ZIP; 6 comparable units currently listed for rent nearby; rentals at typical pace (median 24d on market — plan ~3-4 weeks tenant-placement turnaround); 6 units permitted in Jim Wells County in 2024 (0 in 5+ unit buildings).
Forward outlook
- Local home prices are declining (-3.0%/yr); year-one equity from $619 of loan paydown is wiped out by about $3k of value loss. Plan a longer hold.
- Jim Wells County population projected at +10% by 2050 — modest demand growth; plan on rents tracking national, not racing it.
- At projected returns (-3.0% appreciation + 3.0% rent growth), your $25k cash investment doubles in ~10 years — after that, you're playing with house money.
Negotiation context
- It's been on market 30 days — a 2% lower offer ($88k) is reasonable based on typical stale-listing flexibility.
- 3 sale attempts since 3y ago with the ask held roughly flat each time — persistent listings suggest the price (not the market) is what's stuck; bring a comps-based counter.
Questions for the listing agent
- Have any recent inspections been done? Can we get a copy of the seller's disclosures and any deferred-maintenance estimates?
- Is there a deadline driving the sale (1031 exchange, divorce, estate, relocation)? That informs how much negotiation room exists.
- Schools are D-rated, which usually means shorter tenancies and higher turnover. Who's the typical renter profile here, and what's been the actual vacancy rate?
- Crime grade is F in this area — have there been break-ins, vandalism, or insurance claims at this property in the last 3 years? What carrier currently insures it and at what premium?
- What's the average days-on-market for RENTAL listings here right now (not sales)? A rising rental-DOM trend means longer vacancies and softer asking-rent achievability than the comps imply.
- What's the recent tenant-quality profile in this submarket — average credit score on applications, eviction rate, late-payment / NSF rate, and stable-employment percentage? A property-management company in the area should have these aggregated.
- How much new for-sale + rental construction is in the pipeline within 1–3 miles? Heavy new supply typically softens prices + rents 12–24 months out; constrained supply supports both.
Investment metrics
- 1% rule
- 1.20% ✓
- Cap rate
- 9.37%
- Cash-on-cash
- 11.00%
- DSCR
- 1.49
- GRM
- 6.9
CMA / ARV
- ARV (on-the-fly)
- $188,902
- Comps found
- 8
Show comp detail 8 sales within ~0.75 mi
| Address | Dist | Beds/Ba | Sqft | Sold | Price | $/sf | Match |
|---|---|---|---|---|---|---|---|
| 712 E Hill Ave | 0.54mi | 3/2.0 (+1) | 1,346 (-7%) | 5mo | $195,000 | $145 | 53 |
| 715 Lucero St | 0.29mi | 3/1.0 (+1) | 1,274 (-12%) | 16mo | $39,000 | $31 | 47 |
| 1020 Kleberg | 0.67mi | 3/1.0 (+1) | 1,362 (-6%) | 7mo | $95,000 | $70 | 46 |
| 1003 Anderson Dr | 0.61mi | 3/2.0 (+1) | 1,345 (-7%) | 10mo | $155,000 | $115 | 45 |
| 1236 E 5th St | 0.60mi | 3/2.0 (+1) | 1,525 (+6%) | 14mo | $199,900 | $131 | 44 |
| 1601 Seabreeze St | 0.71mi | 3/2.0 (+1) | 1,468 (+2%) | 21mo | $265,000 | $181 | 39 |
| 421 Anderson Dr | 0.59mi | 3/2.0 (+1) | 1,248 (-14%) | 6mo | $205,000 | $164 | 38 |
| 216 E Hill Ave | 0.65mi | 3/2.0 (+1) | 1,526 (+6%) | 20mo | $148,500 | $97 | 36 |
Match score weights: distance 35% · size 25% · config 20% · recency 20%. Top-matched comps best support the ARV.
Projected returns pro-forma
-3.0% appreciation · 3.0% rent growth · sell at horizon
- IRR
- 0.1%
- Equity multiple
- 1.01×
- Total profit
- $138
- Equity at exit
- $13,345
- IRR
- 9.8%
- Equity multiple
- 1.76×
- Total profit
- $19,018
- Equity at exit
- $7,738
Cash invested: $25,060 (down + closing). Projections, not guarantees.
Landlord ↔ Tenant lean methodology
- Overall (STATE)
- 87 Strongly Landlord-Friendly
- State Texas
- 87 Strongly Landlord-Friendly · R+5
- County
- — inherits STATE
- City
- — inherits STATE
ZIP-level market 78332
- Active inventory
- 220
- Price-to-rent
- 6.9×
Monthly cashflow live
- Estimated rent
- $1,074 high interval (Pro) →
- Mortgage (P&I)
- −$469
- Tax est. 1.5%
- −$112 /mo · $1,342/yr
- Insurance
- −$37
- HOA
- −$0
- Vacancy / Maint / Mgmt
- −$225
- Net cashflow
- $230
Break-even live
UW: 25.0% down · 7.5% · 30yr · 1.5% tax · 5.0% vac · 8.0% maint · 8.0% mgmt
Financing live
Cash to close
- Down payment
- $22,375
- Closing costs
- $2,685
- Reserves months
- —
- Total cash needed
- —
Loan-product check · same deal, 3 products live
Conventional
25% down · 7.5% · 30yr
- Down + closing
- —
- Monthly P&I
- —
- Monthly cashflow
- —
- DSCR
- —
- Eligible?
- —
Personal DTI + credit; lowest rate.
DSCR
20% down · 8.5% · 30yr
- Down + closing
- —
- Monthly P&I
- —
- Monthly cashflow
- —
- DSCR
- —
- Eligible?
- —
No personal income docs; deal must DSCR.
Hard money
10% down · 12.0% · 12mo
- Down + closing
- —
- Monthly P&I
- —
- Monthly cashflow
- —
- DSCR
- —
- Eligible?
- —
Short-term bridge; refi at stabilization.
Rent comps 6 comps
| Address | Beds | Baths | Sqft | Rent | $/sqft | DOM | Units | Dist |
|---|---|---|---|---|---|---|---|---|
| 516 E 6th St Unit B Alice, TX | 2.0 | 1.0 | 920 | $1,200 | $1.30 | 23d | 1 | 0.37mi |
| 901 Sunset Dr Alice, TX | 2.0 | 1.0 | 895 | $1,100 | $1.23 | 23d | 1 | 1.20mi |
| 901 Sunset Dr Alice, TX | 2.0 | 1.0 | 959 | $975 | $1.02 | 21d | 1 | 1.20mi |
| 901 Sunset Dr Alice, TX | 2.0 | 1.0 | 959 | $975 | $1.02 | 2d | 1 | 1.20mi |
| 901 Sunset Dr Unit DRIVE-76 Alice, TX | 2.0 | 1.0 | 959 | $950 | $0.99 | 23d | 1 | 1.20mi |
| 901 Sunset Dr Unit DRIVE-77 Alice, TX | 2.0 | 1.0 | 959 | $975 | $1.02 | 23d | 1 | 1.21mi |
Listing history 22 events
-
2026-06-18days on market $89,500 Active 30 DOM
-
2026-06-17days on market $89,500 Active 29 DOM
-
2026-06-16days on market $89,500 Active 28 DOM
-
2026-06-15days on market $89,500 Active 27 DOM
-
2026-06-13days on market $89,500 Active 25 DOM
-
2026-06-12days on market $89,500 Active 24 DOM
-
2026-06-09days on market $89,500 Active 21 DOM
-
2026-06-08days on market $89,500 Active 20 DOM
-
2026-06-08days on market $89,500 Active 19 DOM
-
2026-06-07days on market $89,500 Active 18 DOM
-
2026-06-03days on market $89,500 Active 15 DOM
-
2026-06-02days on market $89,500 Active 14 DOM
-
2026-06-02price $89,500 Active 13 DOM
-
2026-06-01days on market $90,500 Active 13 DOM
-
2026-05-31days on market $90,500 Active 12 DOM
-
2026-05-19$90,500 Active
-
2024-03-01soldstatus Closed 223-char remark
Show marketing remark (223 chars)
Currently zoned commercial. new roof 2023. Two separate areas. Could be re-zoned residential and used as duplex. Side 1: living room, two rooms, full kitchen and half bath. Side 2: Living area bath, full kitchen, full bath.
-
2024-02-28status Pending 223-char remark
Show marketing remark (223 chars)
Currently zoned commercial. new roof 2023. Two separate areas. Could be re-zoned residential and used as duplex. Side 1: living room, two rooms, full kitchen and half bath. Side 2: Living area bath, full kitchen, full bath.
-
2024-01-09status Active 223-char remark
Show marketing remark (223 chars)
Currently zoned commercial. new roof 2023. Two separate areas. Could be re-zoned residential and used as duplex. Side 1: living room, two rooms, full kitchen and half bath. Side 2: Living area bath, full kitchen, full bath.
-
2024-01-04status Pending 223-char remark
Show marketing remark (223 chars)
Currently zoned commercial. new roof 2023. Two separate areas. Could be re-zoned residential and used as duplex. Side 1: living room, two rooms, full kitchen and half bath. Side 2: Living area bath, full kitchen, full bath.
-
2023-12-11price $79,000 223-char remark
Show marketing remark (223 chars)
Currently zoned commercial. new roof 2023. Two separate areas. Could be re-zoned residential and used as duplex. Side 1: living room, two rooms, full kitchen and half bath. Side 2: Living area bath, full kitchen, full bath.
-
2023-12-08$85,000 Active 223-char remark
Show marketing remark (223 chars)
Currently zoned commercial. new roof 2023. Two separate areas. Could be re-zoned residential and used as duplex. Side 1: living room, two rooms, full kitchen and half bath. Side 2: Living area bath, full kitchen, full bath.
ⓘ Source: listings_history table (triggers on properties + properties_extension) + one-shot
backfill from property_details.listing_events for pre-trigger history.
Nearby sold comps map
Loading sold comps map…
Walkable amenities ~0.75 mi
Loading nearby amenities…
Taxation est. · year 1
- Rental income
- $12,883
- − Mortgage interest
- −$5,013
- − Property taxes
- −$1,342
- − Insurance
- −$448
- − Repairs & maintenance
- −$1,031
- − Management
- −$1,031
- − Depreciation
- −$2,604
- Taxable income
- $1,415
- Est. tax owed @ 24.0%
- −$340
- After-tax cash flow
- $2,416/yr
For passive investors: Depreciation is non-cash, so a rental often shows a tax loss while cash-flowing — sheltering income. Rental losses are passive: they offset passive income freely, and up to $25,000/yr can offset ordinary (W-2) income if you actively participate and your MAGI is under $100k (phasing out to $0 by $150k); unused losses carry forward. On sale, claimed depreciation is recaptured at up to 25%, and gains may owe capital-gains tax (a 1031 exchange can defer both). Figures are a year-1 estimate at your 24.0% rate — not tax advice; consult a CPA.
Condition & rehab AI · 12 photos
This property requires moderate renovations to update the kitchen and bathroom, improve the exterior, and paint the interior. With these updates, it has the potential to become a move-in-ready home with increased resale and rental value.
Repairs flagged
- Major kitchen cabinets — dated and worn
- Major bathroom fixtures — outdated and small
- Major exterior siding — worn and overgrown vegetation
- Major landscaping — overgrown and unkempt
Value-add opportunities
- Both update kitchen cabinets and fixtures — modernizing kitchen will appeal to buyers and renters
- Both upgrade bathroom fixtures and layout — increasing bathroom size and modernizing fixtures will attract buyers and renters
- Both landscape and maintain exterior — improved curb appeal will attract buyers and renters
- Both paint interior walls — fresh paint will improve the home's appearance and attract buyers and renters
Renovation cost estimate screening
| Repair item | Severity | Est. cost |
|---|---|---|
| kitchen cabinets · dated and worn | Major | $15,000–50,000 |
| bathroom fixtures · outdated and small | Major | $15,000–50,000 |
| exterior siding · worn and overgrown vegetation | Major | $15,000–50,000 |
| landscaping · overgrown and unkempt | Major | $15,000–50,000 |
| Total estimated repair cost · 4 items | $60,000–200,000 |
Value-add ROI direction
- Both update kitchen cabinets and fixtures — modernizing kitchen will appeal to buyers and renters ↑
- Both upgrade bathroom fixtures and layout — increasing bathroom size and modernizing fixtures will attract buyers and renters ↑
- Both landscape and maintain exterior — improved curb appeal will attract buyers and renters ↑
- Both paint interior walls — fresh paint will improve the home's appearance and attract buyers and renters ↑
ⓘ Cost ranges are severity-bucket heuristics (US national rule-of-thumb). Get contractor quotes + a written scope before underwriting a rehab budget.
Schools (NCES district)
- District
- Alice ISD
- NCES district ID
- 4807800
- Math proficiency
- 12% ▼ -18.00%
- Reading proficiency
- 23% ▼ -7.00%
- Median HH income
- $37,747
- Composite
- 14.63/100
- National rank
- #9407
- State rank
- #799 of 826 in TX
Livability — Alice
- Score
- 67/100
- State rank
- #558
- US rank
- #10742
Category grades
Schools grade is shown separately in the Schools card above.
Census & demographics
- Census place
- Alice, TX
- Population (ZIP)
- 27,281
Population outlook (Jim Wells County) Hauer SSP2
- Today (2025)
- 43,325 people
- By 2030
- 44,156 · +1.9%
- By 2040
- 45,790 · +5.7%
- By 2050
- 47,455 · +9.5%
- By 2075
- 51,800 · +19.6%
- By 2100
- 52,006 · +20.0%
Race, ethnicity, and origin ACS 2023
- Neighborhood character
- Predominantly Hispanic (84%)
- Race & ethnicity
- Hispanic / Latino 84% White 14% Two or more races 14%
- Hispanic origin (detail)
- Mexican 76%
- Foreign-born
- 4% · Canada
- Languages at home
- 50% English-only · Spanish 49%
Political lean MEDSL · Jim Wells
- 2024 margin
- R (+15.5) · D 42.0% · R 57.5%
- 2008→2024 swing
- -31.6pp toward R · 2008: 16.1pp · 2024: -15.5pp
- All cycles
- 2024: R+15.5 2020: R+9.8 2016: D+10.3 2012: D+17.0 2008: D+16.1
Not yet ingested
- Civics
- —
Market trends
- HPI YoY
- ▼ -123.86%
- Current HPI
- 77.6253
- Rent YoY
- —
- Metro
- —
- State GDP YoY
- ▲ 3.95%
- F500 in state
- 110
Industry mix (Fortune 500 HQ in TX)
| Industry | F500 HQs | Revenue |
|---|---|---|
| Energy | 16 | $1,198B |
|
||
| Technology | 5 | $198B |
|
||
| Engineering / Construction | 4 | $72B |
|
||
| Energy Services | 3 | $60B |
|
||
| Utilities | 3 | $41B |
|
||
| Healthcare | 2 | $330B |
|
||
Price history
+6.5% since first listed7 events — show timeline
- 2026-05-19 Listed $90,500 CBMLS
- 2024-03-01 Sold (MLS) — CBMLS
- 2024-02-28 Pending — CBMLS
- 2024-01-09 Relisted — CBMLS
- 2024-01-04 Pending — CBMLS
- 2023-12-11 Price Changed $79,000 CBMLS
- 2023-12-08 Listed $85,000 CBMLS
Cash-flow waterfall
monthlySold comps — $/sqft
last 12 mo · ≤1 miLoading sold comps…