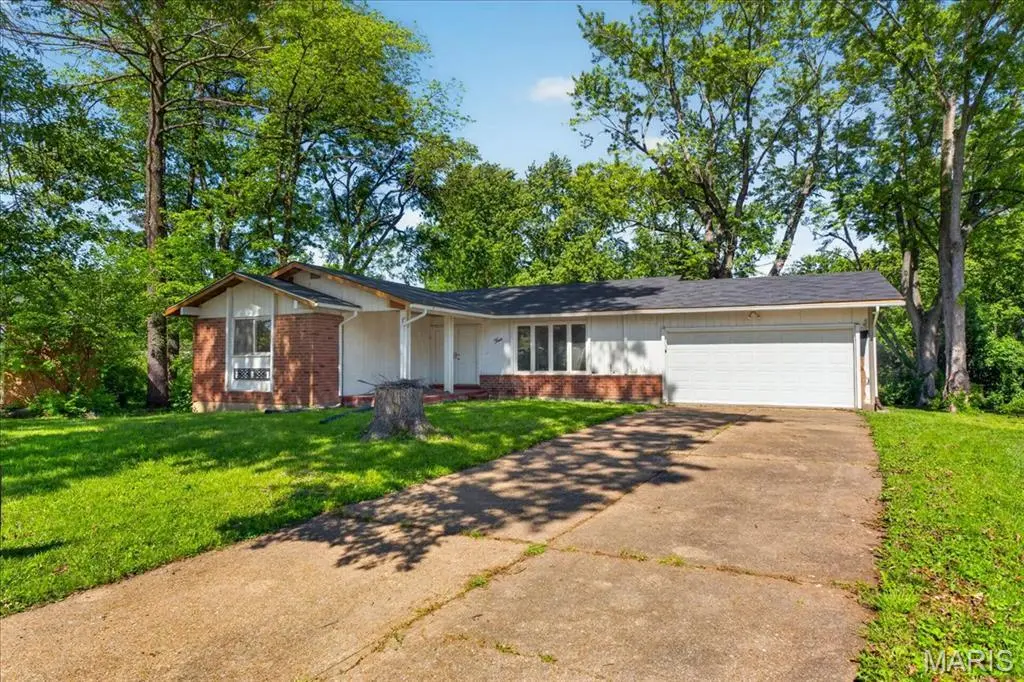
4 Cameo Ct · Florissant, MO
Flood risk 1/10 · Minimal
- FEMA flood zone
- X (unshaded)
- Chance of flooding over 30 yrs
- 0.0%
- Est. flood insurance / yr
- $473 – $860
Fire risk 1/10 · Minimal
- Est. fire insurance / yr
- $1,054 – $1,958
Heat risk 5/10 · Moderate
- Hot days now (above 106°F)
- 7 days/yr
- Hot days in 30 yrs
- 21 days/yr
Wind risk 2/10 · Minimal
- Chance of severe wind over 30 yrs
- 1.0%
Air-quality risk 3/10 · Minor
- Unhealthy air days now
- 3 days/yr
- Unhealthy air days in 30 yrs
- 5 days/yr
Risk factors via First Street. Map © Google.
Why this score? — see what drove the B+ grade
The composite is a weighted blend of 9 inputs, each scored 0–100. Each bar is that input's sub-score; the figure is the points it added to the 100-point composite (weight × sub-score).
- Cash flow +26.6/30.0
- ARV discount +15.0/15.0
- Appreciation +10.0/10.0
- DSCR +9.1/10.0
- 1% rule +7.2/10.0
- Rent growth +4.4/5.0
- Livability +3.7/5.0
- Condition / age +2.5/5.0
- Schools +1.2/10.0
$150,000
🖨 Deal sheet 📄 Offer letter ✓ Due diligence
Listing remarks MLS
Stop in and see this charming 3 bedroom, 2 bath ranch home with tons of potential. Enjoy the outdoors in the huge backyard with mature trees. Nestled in a cul-de-sac on a quiet tree lined street close to schools, parks, restaurants, shopping & easy access to highways. Don't miss this opportunity to own a great home in this lovely neighborhood. Call your favorite real estate agent today to find out how to make this your next home.
Key facts
- 9,718 sq ft lot
- 2 garage spots
- Built 1964
Property features AI
Finance
- Other: Private ownership
Exterior
- Parking: Attached 2-car garage; Total 2 parking spaces
- Utilities: Public water; Public sewer; Electricity connected (Ameren); Natural gas available; Water connected; Sewer available
- Home design: Single-family residence; House with one level
- Construction: Brick and vinyl siding construction
- Exterior features: Back yard
Interior
- Bedrooms: 3 bedrooms (all on main level)
- Bathrooms: 2 full bathrooms; 1 half bathroom
- Heating & cooling: Forced air heating; Central air conditioning; Electric cooling
- Interior features: Partially finished basement; Gas water heater; No fireplace
Neighborhood map
What this means for you Summary
Snapshot
- This is a 3-bed/2.0-bath single-family listed at $150k.
Deal economics
- At list price, monthly cash flow is $399 ($5k/yr) — positive.
- The deal already cash-flows at list — no discount required.
- Meets the 1% rule at list price ($2k rent vs $150k).
- Recommended offer: $148k (1.5% below list) — sets the bar for market timing.
- Cap rate 9.5% vs local median 6.3% in Florissant — top-decile yield for the area; either an underpriced asset or a hidden risk that comps aren't pricing in. Stress-test before assuming the spread holds.
Location & tenants
- Location reads 73/100 on livability (#82 in MO) — a middle-class / working-renter tenant base. Strengths: cost of living A+, housing A+, health & safety B+; Watch: crime C-, amenities D+, commute F.
- Ferguson-Florissant R-II (suburban): math 7% / reading 20% proficiency, ranked #311 of 324 in MO (top 96%) — low school quality limits family demand, transient renter base, plan for 1-2y turnover; 70% free/reduced lunch — lower-income household profile, screen leases tightly.
- Zoned schools: Mccluer North High (math 5% / reading 28%, grade F, #487 of 521 statewide, top 93%, 1,136 students, 100% FRL) — zoned schools average 100% FRL vs 70% district-wide (30 pts higher); higher-poverty schools than district average — tighter screening recommended.
- Market conditions: Rents rising fast (+7.5%/yr); 218 active listings in the ZIP; 22 comparable units currently listed for rent nearby; rentals at typical pace (median 18d on market — plan ~3-4 weeks tenant-placement turnaround); 45% of comp listings sitting > 30 days — soft ceiling on asking rent; 920 units permitted in St. Louis County in 2024 (250 in 5+ unit buildings).
- This rent runs 33% of the median local income ($67k/yr) — at the standard rent-burdened threshold; future hikes will face affordability resistance.
Forward outlook
- In year one you build about $16k of equity ($1k loan paydown + $15k appreciation (10.0% local appreciation)).
- At projected returns (10.0% appreciation + 7.5% rent growth), your $42k cash investment doubles in ~2 years — after that, you're playing with house money.
- By year 3, paydown + projected appreciation supports a ~$41k cash-out refi (75% LTV) — recoverable capital for the next deal without selling this one.
Negotiation context
- It's been on market 20 days — a 2% lower offer ($148k) is reasonable based on typical stale-listing flexibility.
- 2 sale attempts since 2y ago with the ask held roughly flat each time — persistent listings suggest the price (not the market) is what's stuck; bring a comps-based counter.
Risks & watch-outs
- Climate carrying-cost: extreme-heat days projected 7→21/yr by 2055 (HVAC capex compounding) — expect insurance premiums to compound above CPI over the hold.
Questions for the listing agent
- Built in 1964 — when were the roof, HVAC, electrical panel, plumbing, and water heater last replaced?
- Is there a deadline driving the sale (1031 exchange, divorce, estate, relocation)? That informs how much negotiation room exists.
- Schools are D-rated, which usually means shorter tenancies and higher turnover. Who's the typical renter profile here, and what's been the actual vacancy rate?
- What's the average days-on-market for RENTAL listings here right now (not sales)? A rising rental-DOM trend means longer vacancies and softer asking-rent achievability than the comps imply.
- What's the recent tenant-quality profile in this submarket — average credit score on applications, eviction rate, late-payment / NSF rate, and stable-employment percentage? A property-management company in the area should have these aggregated.
- How much new for-sale + rental construction is in the pipeline within 1–3 miles? Heavy new supply typically softens prices + rents 12–24 months out; constrained supply supports both.
Investment metrics
- 1% rule
- 1.22% ✓
- Cap rate
- 9.49%
- Cash-on-cash
- 11.41%
- DSCR
- 1.51
- GRM
- 6.8
CMA / ARV
- ARV (on-the-fly)
- $214,965
- Comps found
- 12
Show comp detail 12 sales within ~0.75 mi
| Address | Dist | Beds/Ba | Sqft | Sold | Price | $/sf | Match |
|---|---|---|---|---|---|---|---|
| 4 Cameo Ct | 0.00mi | 3/2.5 | 1,405 (0%) | 0mo | $150,000 | $107 | 98 |
| 2940 Dover Dr | 0.20mi | 3/2.0 | 1,402 (-0%) | 1mo | $210,000 | $150 | 90 |
| 2490 Yorkshire Dr | 0.21mi | 3/3.0 | 1,407 (+0%) | 7mo | $260,000 | $185 | 80 |
| 2560 Woodsage Dr | 0.29mi | 3/3.0 | 1,390 (-1%) | 1mo | $220,000 | $158 | 80 |
| 2945 Dover Dr | 0.23mi | 4/2.0 (+1) | 1,470 (+5%) | 2mo | $185,400 | $126 | 75 |
| 2910 Wellington Dr | 0.20mi | 4/2.0 (+1) | 1,517 (+8%) | 1mo | $159,900 | $105 | 71 |
| 9 Darwin Ct | 0.13mi | 3/3.0 | 1,540 (+10%) | 4mo | $235,000 | $153 | 71 |
| 7 Darwin Ct | 0.14mi | 4/2.0 (+1) | 1,560 (+11%) | 0mo | $200,000 | $128 | 70 |
| 549 Rancho Ln | 0.61mi | 3/3.0 | 1,432 (+2%) | 0mo | $279,000 | $195 | 64 |
| 2405 Orleans Ln | 0.71mi | 3/1.5 | 1,424 (+1%) | 2mo | $239,900 | $168 | 61 |
| 548 Rancho Ln | 0.61mi | 3/2.0 | 1,264 (-10%) | 4mo | $225,900 | $179 | 52 |
| 490 Jana Dr | 0.70mi | 4/3.0 (+1) | 1,600 (+14%) | 1mo | $195,000 | $122 | 34 |
Match score weights: distance 35% · size 25% · config 20% · recency 20%. Top-matched comps best support the ARV.
Projected returns pro-forma
10.0% appreciation · 7.51% rent growth · sell at horizon
- IRR
- 34.8%
- Equity multiple
- 3.76×
- Total profit
- $115,853
- Equity at exit
- $135,132
- IRR
- 31.6%
- Equity multiple
- 9.15×
- Total profit
- $342,370
- Equity at exit
- $291,417
Cash invested: $42,000 (down + closing). Projections, not guarantees.
Landlord ↔ Tenant lean methodology
- Overall (STATE)
- 81 Strongly Landlord-Friendly
- State Missouri
- 81 Strongly Landlord-Friendly · R+10
- County
- — inherits STATE
- City
- — inherits STATE
ZIP-level market 63033
- Home prices YoY
- 2.5%
- Rents YoY
- 7.5%
- Active inventory
- 218
- Price-to-rent
- 6.8×
Monthly cashflow live
- Estimated rent
- $1,833 high interval (Pro) →
- Mortgage (P&I)
- −$787
- Tax from tax record
- −$199 /mo · $2,392/yr
- Insurance
- −$62
- HOA
- −$0
- Vacancy / Maint / Mgmt
- −$385
- Net cashflow
- $399
Break-even live
UW: 25.0% down · 7.5% · 30yr · 1.5% tax · 5.0% vac · 8.0% maint · 8.0% mgmt
Financing live
Cash to close
- Down payment
- $37,500
- Closing costs
- $4,500
- Reserves months
- —
- Total cash needed
- —
Loan-product check · same deal, 3 products live
Conventional
25% down · 7.5% · 30yr
- Down + closing
- —
- Monthly P&I
- —
- Monthly cashflow
- —
- DSCR
- —
- Eligible?
- —
Personal DTI + credit; lowest rate.
DSCR
20% down · 8.5% · 30yr
- Down + closing
- —
- Monthly P&I
- —
- Monthly cashflow
- —
- DSCR
- —
- Eligible?
- —
No personal income docs; deal must DSCR.
Hard money
10% down · 12.0% · 12mo
- Down + closing
- —
- Monthly P&I
- —
- Monthly cashflow
- —
- DSCR
- —
- Eligible?
- —
Short-term bridge; refi at stabilization.
Rent comps 22 comps
| Address | Beds | Baths | Sqft | Rent | $/sqft | DOM | Units | Dist |
|---|---|---|---|---|---|---|---|---|
| 13 Cricket Ct Florissant, MO | 4.0 | 3.0 | 1560 | $2,550 | $1.63 | 43d | 1 | 0.32mi |
| 1983 Greenheath Dr Florissant, MO | 3.0 | 2.0 | 1040 | $1,331 | $1.28 | 2d | 1 | 0.46mi |
| 3144 Sunswept Pk Ct Florissant, MO | 1.0–3.0 | 1.0–2.0 | 818 | $1,250 | $1.53 | 1d | 12 | 0.54mi |
| 330 Moule Dr Florissant, MO | 3.0 | 1.0 | 1014 | $1,575 | $1.55 | 43d | 1 | 0.69mi |
| 1785 Trotter Way Florissant, MO | 3.0 | 2.0 | 1297 | $1,806 | $1.39 | 7d | 1 | 0.87mi |
| 775 Sherwood Dr Florissant, MO | 3.0 | 1.0 | 1023 | $1,690 | $1.65 | 43d | 1 | 0.87mi |
| 2942 Chance Dr Florissant, MO | 3.0 | 1.0 | 912 | $1,700 | $1.86 | 12d | 1 | 0.91mi |
| 2990 Santiago Dr Florissant, MO | 2.0 | 2.0 | 984 | $1,200 | $1.22 | 43d | 1 | 0.94mi |
| 1710 Kay Dr Florissant, MO | 3.0 | 1.0 | 960 | $1,500 | $1.56 | 1d | 1 | 0.98mi |
| 1740 Deborah Dr Florissant, MO | 3.0 | 2.5 | 1650 | $1,750 | $1.06 | 17d | 1 | 1.02mi |
| 3 Cantabrian Ct Florissant, MO | 3.0 | 2.0 | 1436 | $1,881 | $1.31 | 14d | 1 | 1.04mi |
| 1600 Horseshoe Dr Florissant, MO | 3.0 | 2.0 | 1314 | $1,550 | $1.18 | 43d | 1 | 1.10mi |
| 2857 Dawnview Dr Florissant, MO | 3.0 | 1.0 | 890 | $1,325 | $1.49 | 7d | 1 | 1.12mi |
| 15686 93rd Ave Florissant, MO | 3.0 | 2.0 | 1370 | $1,948 | $1.42 | 12d | 1 | 1.17mi |
| 2075 Cordoba Dr Florissant, MO | 3.0 | 2.0 | 1523 | $1,850 | $1.21 | 14d | 1 | 1.22mi |
| 9 Saint Celeste Dr Florissant, MO | 3.0 | 1.0 | 992 | $1,450 | $1.46 | 43d | 1 | 1.31mi |
| 3 Champlain Ct Florissant, MO | 3.0 | 1.0 | 1100 | $1,600 | $1.45 | 43d | 1 | 1.32mi |
| 4112 Monsols Dr Florissant, MO | 3.0 | 2.0 | 1120 | $1,945 | $1.74 | 43d | 1 | 1.36mi |
| 470 Hundley Dr Florissant, MO | 3.0 | 2.0 | 962 | $1,595 | $1.66 | 43d | 1 | 1.38mi |
| 3930 Belcroft Dr Florissant, MO | 3.0 | 3.0 | 1408 | $1,935 | $1.37 | 43d | 1 | 1.39mi |
| 1095 Humes Ln Florissant, MO | 3.0 | 1.5 | 1100 | $1,650 | $1.50 | 4d | 1 | 1.45mi |
| 1332 Langholm Dr Florissant, MO | 3.0 | 1.0 | 924 | $1,650 | $1.79 | 1d | 1 | 1.47mi |
Listing history 6 events
-
2026-05-11historical Active Under Contract
-
2026-05-09$150,000 Active
-
2026-05-08historical $150,000
-
2024-06-03soldstatus Closed 437-char remark
Show marketing remark (437 chars)
Stop in and see this charming 3 bedroom, 2 bath ranch home with tons of potential. Enjoy the outdoors in the huge backyard with mature trees. Nestled in a cul-de-sac on a quiet tree lined street close to schools, parks, restaurants, shopping & easy access to highways. Don't miss this opportunity to own a great home in this lovely neighborhood. Call your favorite real estate agent today to find out how to make this your next home.
-
2024-05-24status Pending 437-char remark
Show marketing remark (437 chars)
Stop in and see this charming 3 bedroom, 2 bath ranch home with tons of potential. Enjoy the outdoors in the huge backyard with mature trees. Nestled in a cul-de-sac on a quiet tree lined street close to schools, parks, restaurants, shopping & easy access to highways. Don't miss this opportunity to own a great home in this lovely neighborhood. Call your favorite real estate agent today to find out how to make this your next home.
-
2024-05-14$149,900 Active 437-char remark
Show marketing remark (437 chars)
Stop in and see this charming 3 bedroom, 2 bath ranch home with tons of potential. Enjoy the outdoors in the huge backyard with mature trees. Nestled in a cul-de-sac on a quiet tree lined street close to schools, parks, restaurants, shopping & easy access to highways. Don't miss this opportunity to own a great home in this lovely neighborhood. Call your favorite real estate agent today to find out how to make this your next home.
ⓘ Source: listings_history table (triggers on properties + properties_extension) + one-shot
backfill from property_details.listing_events for pre-trigger history.
Tax reassessment forecast MO · Resets to sale price
- Current annual tax
- $2,392 · $199/mo
- Projected year-2 tax
- $2,392 · $199/mo
- Expected delta
- $0/yr ($0/mo · 0.0%)
ⓘ Screening estimate from a state-policy table — verify with the county assessor before closing.
Climate risk First Street
- Flood 1/10 Low FEMA zone X (unshaded) · 0% chance over 30 yrs
- Wildfire 1/10 Low
- Heat 5/10 Major 7 d/yr ≥106°F today · 21 d/yr by 30 yrs out
- Wind 2/10 Low 100% chance of damaging wind over 30 yrs
- Air quality 3/10 Moderate 3 unhealthy d/yr today · 5 by 30 yrs out
Nearby sold comps map
Loading sold comps map…
Walkable amenities ~0.75 mi
Loading nearby amenities…
Taxation est. · year 1
- Rental income
- $21,991
- − Mortgage interest
- −$8,402
- − Property taxes
- −$2,392
- − Insurance
- −$750
- − Repairs & maintenance
- −$1,759
- − Management
- −$1,759
- − Depreciation
- −$4,364
- Taxable income
- $2,564
- Est. tax owed @ 24.0%
- −$615
- After-tax cash flow
- $4,176/yr
For passive investors: Depreciation is non-cash, so a rental often shows a tax loss while cash-flowing — sheltering income. Rental losses are passive: they offset passive income freely, and up to $25,000/yr can offset ordinary (W-2) income if you actively participate and your MAGI is under $100k (phasing out to $0 by $150k); unused losses carry forward. On sale, claimed depreciation is recaptured at up to 25%, and gains may owe capital-gains tax (a 1031 exchange can defer both). Figures are a year-1 estimate at your 24.0% rate — not tax advice; consult a CPA.
Schools (NCES district)
- District
- Ferguson-Florissant R-II
- NCES district ID
- 2912010
- Math proficiency
- 7% ▼ -9.00%
- Reading proficiency
- 20% ▼ -6.00%
- Median HH income
- $44,610
- Composite
- 11.96/100
- National rank
- #9666
- State rank
- #311 of 324 in MO
Livability — Florissant
- Score
- 73/100
- State rank
- #82
- US rank
- #5406
Category grades
Schools grade is shown separately in the Schools card above.
Census & demographics
- County
- Saint Louis County · 888,823 people
- City population
- 69,104
- Metro
- St. Louis, MO-IL
- Population (ZIP)
- 43,056
- Household income
- $66,776
- Rent vs Own
- Severe rent burden
- 1429.0
Population outlook (St. Louis County) Hauer SSP2
- Today (2025)
- 1,025,227 people
- By 2030
- 1,028,023 · +0.3%
- By 2040
- 1,020,940 · -0.4%
- By 2050
- 1,007,280 · -1.8%
- By 2075
- 987,277 · -3.7%
- By 2100
- 921,984 · -10.1%
Race, ethnicity, and origin ACS 2023
- Neighborhood character
- Predominantly Black (71%)
- Race & ethnicity
- Black 71% White 23% Two or more races 4% Hispanic / Latino 1%
- Common ancestry
- Romanian 1% Lithuanian 1% Italian 1%
- Foreign-born
- 3% · Canada, Vietnam
- Languages at home
- 95% English-only · Spanish 1% French/Haitian/Cajun 1%
Political lean MEDSL · St. Louis
- 2024 margin
- Strong D (+23.4) · D 60.8% · R 37.4% · Other 1.7%
- 2008→2024 swing
- +3.5pp toward D · 2008: 19.9pp · 2024: 23.4pp
- All cycles
- 2024: D+23.4 2020: D+24.0 2016: D+16.2 2012: D+13.7 2008: D+19.9
Not yet ingested
- Civics
- —
Market trends
- HPI YoY
- ▲ 13.78%
- Current HPI
- 570.6
- Rent YoY
- ▲ 7.51%
- Metro
- St. Louis, MO-IL
- State GDP YoY
- ▲ 1.84%
- F500 in state
- 20
Industry mix (Fortune 500 HQ in MO)
| Industry | F500 HQs | Revenue |
|---|---|---|
| Healthcare | 1 | $163B |
|
||
| Insurance | 1 | $21B |
|
||
| Industrial Technology | 1 | $17B |
|
||
| Retail | 1 | $16B |
|
||
| Industrial Distribution | 1 | $10B |
|
||
| Utilities | 1 | $9B |
|
||
Price history
+0.1% since first listed6 events — show timeline
- 2026-05-11 Contingent — MARIS as Distributed by MLS Grid
- 2026-05-09 Listed $150,000 MARIS as Distributed by MLS Grid
- 2026-05-08 Coming Soon $150,000 MARIS as Distributed by MLS Grid
- 2024-06-03 Sold (MLS) — MARIS as Distributed by MLS Grid
- 2024-05-24 Pending — MARIS as Distributed by MLS Grid
- 2024-05-14 Listed $149,900 MARIS as Distributed by MLS Grid
Property tax history
+2.2%/yrLatest (2022): $2,392 · +0.3% YoY. Source: county tax records.
Cash-flow waterfall
monthlySold comps — $/sqft
last 12 mo · ≤1 miLoading sold comps…