188 Church St · Lewisburg, KY
Flood risk 1/10 · Minimal
- FEMA flood zone
- X (unshaded)
- Chance of flooding over 30 yrs
- 0.0%
- Est. flood insurance / yr
- $507 – $1,088
Fire risk 4/10 · Minor
- Est. fire insurance / yr
- $839 – $1,559
Heat risk 5/10 · Moderate
- Hot days now (above 108°F)
- 7 days/yr
- Hot days in 30 yrs
- 19 days/yr
Wind risk 4/10 · Minor
- Chance of severe wind over 30 yrs
- 9.0%
Air-quality risk 2/10 · Minimal
- Unhealthy air days now
- 1 days/yr
- Unhealthy air days in 30 yrs
- 1 days/yr
Risk factors via First Street. Map © Google.
Why this score? — see what drove the D+ grade
The composite is a weighted blend of 9 inputs, each scored 0–100. Each bar is that input's sub-score; the figure is the points it added to the 100-point composite (weight × sub-score).
- Cash flow +16.2/30.0
- ARV discount +7.5/15.0
- DSCR +5.0/10.0
- Appreciation +5.0/10.0
- 1% rule +4.4/10.0
- Schools +3.3/10.0
- Livability +3.2/5.0
- Rent growth +2.5/5.0
- Condition / age +2.5/5.0
$120,000
🖨 Deal sheet (PDF) 📄 Offer letter ✓ Due diligence
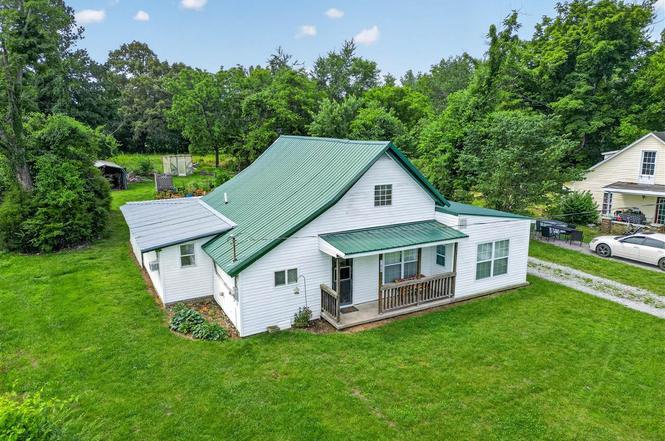
Listing remarks
Welcome to 188 Church St. This unique home is situated on two lots offering a generous 0.75 +/- acres combined. This property gives you the rare advantage of a huge, sprawling backyard within town limits as well as having two addresses and two utility sites. Whether you want to plant a massive garden, lose yourself in the detached workshop, or just enjoy the wide-open Kentucky views, this acreage delivers. Inside the home, you’ll find a large open living room, plenty of storage space in the pantry and a primary bedroom with two adjoining offices and a walk in closet. This property won’t last long, call today to schedule your showing!
Key facts
- Two lots
- Two addresses
- Detached workshop
Tags
Property features AI
Exterior
- Parking: Gravel parking; 1-car garage
- Utilities: Public water; Public sewer
- Home design: Single-family residence; Residential property
- Construction: Vinyl siding
- Exterior features: Metal roof; 0.75 acre lot
Interior
- Kitchen: Dishwasher; Range/Oven; Refrigerator
- Flooring: Hardwood; Vinyl
- Bathrooms: 1 full bathroom (main level)
- Heating & cooling: Propane heating (space heater); Window cooling units
- Interior features: Eat-in kitchen; Vaulted ceilings; Walk-in closet(s)
- Laundry & utility: Washer; Dryer; Electric water heater
Neighborhood map
What this means for you Summary
Snapshot
- This is a 3-bed/1.0-bath other listed at $120k.
Deal economics
- At list price, monthly cash flow is $63 ($759/yr) — positive.
- The deal already cash-flows at list — no discount required.
- To meet the 1% rule (rent ≥ 1% of price), the offer needs to be $113k (5.9% below list).
- Recommended offer: $113k (5.9% below list) — sets the bar for 1% rule.
Location & tenants
- Location reads 64/100 on livability (#295 in KY) — a middle-class / working-renter tenant base. Strengths: crime A+, cost of living A+, housing A+; Watch: amenities F, commute F, employment F.
- Logan County (rural): math 35% / reading 44% proficiency, ranked #32 of 165 in KY (top 19%) — families likely to look elsewhere, expect single-tenant / working-renter base with shorter leases.
- Zoned schools: Lewisburg Elementary School (math 41% / reading 43%, grade F, #178 of 676 statewide, top 29%, 484 students, 64% FRL); Logan County High School (math 32% / reading 54%, grade F, #30 of 254 statewide, top 12%, 953 students, 47% FRL).
- Market conditions: 66 active listings in the ZIP; 30 units permitted in Logan County in 2024 (0 in 5+ unit buildings).
Forward outlook
- In year one you build about $876 of equity ($830 loan paydown + $46 appreciation (0.0% local appreciation)).
- Logan County population projected at -13% by 2050 — secular population decline; favor cash flow + early exit over multi-decade hold.
Negotiation context
- Only 10 days on market — expect competitive offers; lowballing is unlikely to land.
Risks & watch-outs
- Watch-outs: built in 1950 — expect roof / HVAC / electrical / plumbing capex.
- Climate carrying-cost: extreme-heat days projected 7→19/yr by 2055 (HVAC capex compounding) — expect insurance premiums to compound above CPI over the hold.
Questions for the listing agent
- Built in 1950 — when were the roof, HVAC, electrical panel, plumbing, and water heater last replaced?
- Is there a deadline driving the sale (1031 exchange, divorce, estate, relocation)? That informs how much negotiation room exists.
- Schools are D-rated, which usually means shorter tenancies and higher turnover. Who's the typical renter profile here, and what's been the actual vacancy rate?
- The area grade is low — what's the realistic commute time and amenity access for the typical tenant pool here? Any planned neighborhood developments (good or bad) we should know about?
- What's the average days-on-market for RENTAL listings here right now (not sales)? A rising rental-DOM trend means longer vacancies and softer asking-rent achievability than the comps imply.
- What's the recent tenant-quality profile in this submarket — average credit score on applications, eviction rate, late-payment / NSF rate, and stable-employment percentage? A property-management company in the area should have these aggregated.
- How much new for-sale + rental construction is in the pipeline within 1–3 miles? Heavy new supply typically softens prices + rents 12–24 months out; constrained supply supports both.
Investment metrics
- 1% rule
- 0.94% ✗
- Cap rate
- 6.93%
- Cash-on-cash
- 2.26%
- DSCR
- 1.10
- GRM
- 8.9
CMA / ARV
No comps found within radius.
Projected returns pro-forma
0.04% appreciation · 3.0% rent growth · sell at horizon
- IRR
- 0.5%
- Equity multiple
- 1.02×
- Total profit
- $749
- Equity at exit
- $35,074
- IRR
- 6.0%
- Equity multiple
- 1.65×
- Total profit
- $21,894
- Equity at exit
- $42,345
Cash invested: $33,600 (down + closing). Projections, not guarantees.
Landlord ↔ Tenant lean methodology
- Overall (STATE)
- 83 Strongly Landlord-Friendly
- State Kentucky
- 83 Strongly Landlord-Friendly · R+16
- County
- — inherits STATE
- City
- — inherits STATE
ZIP-level market 42256
- Home prices YoY
- 0.0%
- Active inventory
- 66
- Price-to-rent
- 8.9×
Monthly cashflow live
- Estimated rent
- $1,130 medium interval (Pro) →
- Mortgage (P&I)
- −$629
- Tax est. 1.5%
- −$150 /mo · $1,800/yr
- Insurance
- −$50
- HOA
- −$0
- Vacancy / Maint / Mgmt
- −$237
- Net cashflow
- $63
Break-even live
Sensitivity live
| Price | -10% $146 | -5% $105 | +0% $63 | +5% $22 | +10% $-20 |
|---|---|---|---|---|---|
| Rent | -10% $-26 | -5% $19 | +0% $63 | +5% $108 | +10% $152 |
| Rate | -1.0pp $124 | -0.5pp $94 | base $63 | +0.5pp $32 | +1.0pp $0 |
UW: 25.0% down · 7.5% · 30yr · 1.5% tax · 5.0% vac · 8.0% maint · 8.0% mgmt
Financing live
Cash to close
- Down payment
- $30,000
- Closing costs
- $3,600
- Reserves months
- —
- Total cash needed
- —
Loan-product check · same deal, 3 products live
Conventional
25% down · 7.5% · 30yr
- Down + closing
- —
- Monthly P&I
- —
- Monthly cashflow
- —
- DSCR
- —
- Eligible?
- —
Personal DTI + credit; lowest rate.
DSCR
20% down · 8.5% · 30yr
- Down + closing
- —
- Monthly P&I
- —
- Monthly cashflow
- —
- DSCR
- —
- Eligible?
- —
No personal income docs; deal must DSCR.
Hard money
10% down · 12.0% · 12mo
- Down + closing
- —
- Monthly P&I
- —
- Monthly cashflow
- —
- DSCR
- —
- Eligible?
- —
Short-term bridge; refi at stabilization.
Listing history 8 events
-
2026-06-21days on market $120,000 Active 10 DOM
-
2026-06-18days on market $120,000 Active 7 DOM
-
2026-06-17days on market $120,000 Active 6 DOM
-
2026-06-16days on market $120,000 Active 5 DOM
-
2026-06-15days on market $120,000 Active 4 DOM
-
2026-06-14days on market $120,000 Active 2 DOM
-
2026-06-13remarks 641-char remark
-
2026-06-13$120,000 Active 1 DOM
ⓘ Source: listings_history table (triggers on properties + properties_extension) + one-shot
backfill from property_details.listing_events for pre-trigger history.
Climate risk First Street
- Flood 1/10 Low FEMA zone X (unshaded) · 0% chance over 30 yrs
- Wildfire 4/10 Moderate
- Heat 5/10 Major 7 d/yr ≥108°F today · 19 d/yr by 30 yrs out
- Wind 4/10 Moderate 9% chance of damaging wind over 30 yrs
- Air quality 2/10 Low 1 unhealthy d/yr today · 1 by 30 yrs out
Nearby sold comps map
Loading sold comps map…
Walkable amenities ~0.75 mi
Loading nearby amenities…
Taxation est. · year 1
- Rental income
- $13,557
- − Mortgage interest
- −$6,722
- − Property taxes
- −$1,800
- − Insurance
- −$600
- − Repairs & maintenance
- −$1,085
- − Management
- −$1,085
- − Depreciation
- −$3,491
- Taxable loss
- −$1,225
- Est. tax savings @ 24.0%
- +$294
- After-tax cash flow
- $1,053/yr
For passive investors: Depreciation is non-cash, so a rental often shows a tax loss while cash-flowing — sheltering income. Rental losses are passive: they offset passive income freely, and up to $25,000/yr can offset ordinary (W-2) income if you actively participate and your MAGI is under $100k (phasing out to $0 by $150k); unused losses carry forward. On sale, claimed depreciation is recaptured at up to 25%, and gains may owe capital-gains tax (a 1031 exchange can defer both). Figures are a year-1 estimate at your 24.0% rate — not tax advice; consult a CPA.
Schools (NCES district)
- District
- Logan County
- NCES district ID
- 2103540
- Math proficiency
- 35% ▼ -17.00%
- Reading proficiency
- 44% ▼ -14.00%
- Median HH income
- $42,577
- Composite
- 33.34/100
- National rank
- #5492
- State rank
- #32 of 165 in KY
Livability — Lewisburg
- Score
- 64/100
- State rank
- #295
- US rank
- #14165
Category grades
Schools grade is shown separately in the Schools card above.
Census & demographics
- Census place
- Lewisburg, KY
- Population (ZIP)
- 5,052
Population outlook (Logan County) Hauer SSP2
- Today (2025)
- 26,133 people
- By 2030
- 25,572 · -2.1%
- By 2040
- 24,247 · -7.2%
- By 2050
- 22,849 · -12.6%
- By 2075
- 19,587 · -25.0%
- By 2100
- 15,927 · -39.1%
Race, ethnicity, and origin ACS 2023
- Neighborhood character
- Predominantly White (95%)
- Race & ethnicity
- White 95% Hispanic / Latino 3% Two or more races 2%
- Common ancestry
- Italian 2% Slovak 1% Romanian 1%
- Foreign-born
- 0%
- Languages at home
- 96% English-only · German/W. Germanic 2% Russian/Polish/Slavic 1% Other Indo-European 1%
Political lean MEDSL · Logan
- 2024 margin
- Solid R (+55.1) · D 21.9% · R 76.9% · Other 1.2%
- 2008→2024 swing
- -26.5pp toward R · 2008: -28.6pp · 2024: -55.1pp
- All cycles
- 2024: R+55.1 2020: R+48.4 2016: R+46.1 2012: R+32.6 2008: R+28.6
Not yet ingested
- Civics
- —
Market trends
- HPI YoY
- ▬ 0.04%
- Current HPI
- 265.4274
- Rent YoY
- —
- Metro
- —
- State GDP YoY
- ▲ 1.81%
- F500 in state
- 4
Industry mix (Fortune 500 HQ in KY)
| Industry | F500 HQs | Revenue |
|---|---|---|
| Healthcare | 1 | $118B |
|
||
| Food / Beverage | 1 | $7B |
|
||
Price history
1 event — show timeline
- 2026-06-10 Listed $120,000 RASKMLS
Property tax history
+3.7%/yrLatest (2025): $216 · -0.8% YoY. Source: county tax records.
Cash-flow waterfall
monthlySold comps — $/sqft
last 12 mo · ≤1 miLoading sold comps…