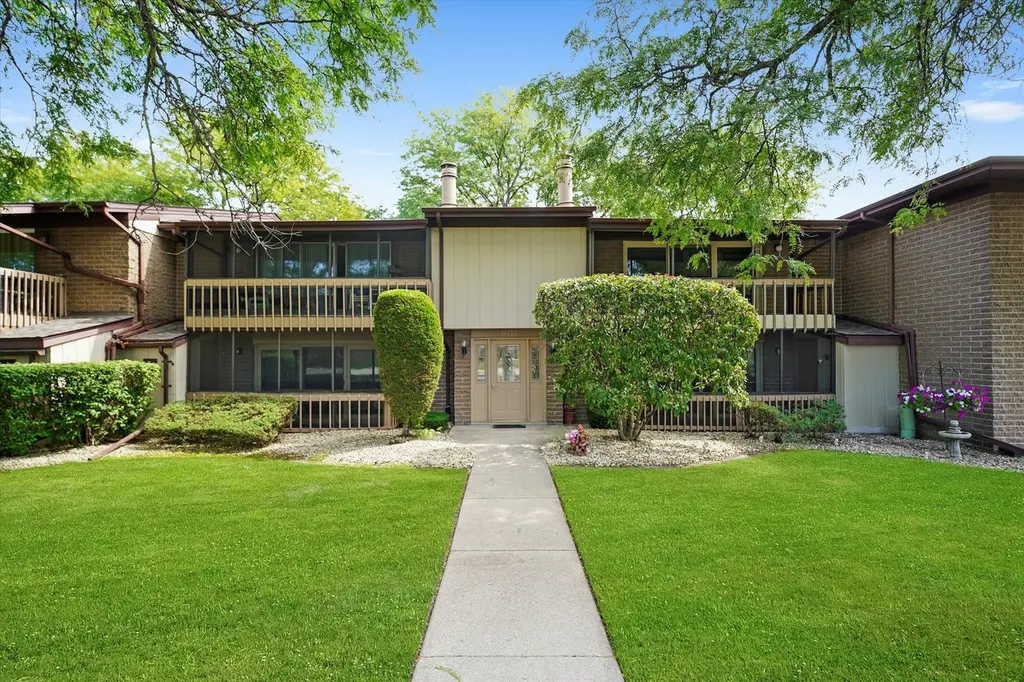
15713 Orlan Brook Dr #98 · Orland Park, IL
Flood risk 1/10 · Minimal
- FEMA flood zone
- X (unshaded)
- Chance of flooding over 30 yrs
- 0.0%
- Est. flood insurance / yr
- $507 – $1,088
Fire risk 1/10 · Minimal
- Est. fire insurance / yr
- $804 – $1,492
Heat risk 3/10 · Minor
- Hot days now (above 102°F)
- 7 days/yr
- Hot days in 30 yrs
- 15 days/yr
Wind risk 2/10 · Minimal
- Chance of severe wind over 30 yrs
- —
Air-quality risk 4/10 · Minor
- Unhealthy air days now
- 4 days/yr
- Unhealthy air days in 30 yrs
- 5 days/yr
Risk factors via First Street. Map © Google.
Why this score? — see what drove the D grade
The composite is a weighted blend of 9 inputs, each scored 0–100. Each bar is that input's sub-score; the figure is the points it added to the 100-point composite (weight × sub-score).
- Cash flow +11.9/30.0
- ARV discount +7.5/15.0
- 1% rule +5.5/10.0
- Livability +4.2/5.0
- DSCR +3.5/10.0
- Schools +3.4/10.0
- Rent growth +2.5/5.0
- Condition / age +2.5/5.0
- Appreciation +0.0/10.0
$214,500
🖨 Deal sheet (PDF) 📄 Offer letter ✓ Due diligence
Listing remarks
Desirable 2nd floor condo with 2 bedrooms, 1.5 baths (including master bath). Plenty of storage space and a walk-in closet. Large living room/dining room area, huge outdoor balcony with additional attached storage room. In-unit laundry. Attached 1-car garage with opener (exterior access only) and one additional exterior parking space immediately in front of garage door. Homeowners have access to the community amenities, including indoor/outdoor pools, clubhouse and exercise room.
Key facts
- Clubhouse
- Walk-in closet
- Community amenities
Tags
Property features AI
Finance
- Other: Building contains 4 units; Living area is estimated; Special service area: No
- HOA & community: Monthly association fee of $328; HOA covers water, parking, insurance, clubhouse, exercise facilities, pool, exterior maintenance, lawn care, and snow removal; Pets allowed (cats and dogs); maximum pet weight 25 lbs
Exterior
- Parking: Attached garage with garage door opener (1 garage space; 1 total parking); Asphalt driveway
- Utilities: Water source: Lake Michigan; Public sewer
- Home design: Attached single condo; Entry on second level; Rehab completed in 2025; Approximately 41–50 years old
- Construction: Brick construction
- Exterior features: Condo setting; Condominium development with commuter and interstate access
Interior
- Kitchen: Kitchen (second level) with ceramic tile flooring
- Bedrooms: Master bedroom (second level) with half bath; Second bedroom (second level)
- Flooring: Ceramic tile in the kitchen
- Bathrooms: One full bathroom; One half bathroom
- Heating & cooling: Natural gas heating; Central air conditioning
- Interior features: Five total rooms; Balcony/porch (second level)
- Laundry & utility: In-unit laundry (second level, 7 x 5)
Neighborhood map
What this means for you Summary
Snapshot
- This is a 2-bed/1.5-bath condo listed at $214k.
Deal economics
- At list price, monthly cash flow is $-55 ($-661/yr) — negative.
- To cash-flow at today's rent, offer at most $205k (4.5% below list).
- Meets the 1% rule at list price ($2k rent vs $214k).
- Recommended offer: $189k (12.0% below list) — sets the bar for market timing.
- Cap rate 6.0% vs local median 4.5% in Orland Park — top-decile yield for the area; either an underpriced asset or a hidden risk that comps aren't pricing in. Stress-test before assuming the spread holds.
Location & tenants
- Location reads 85/100 on livability (#29 in IL, #529 nationally) — a professional / high-income tenant draw. Strengths: crime A+, amenities A+, commute A+.
- Cons Hsd 230 (suburban): math 35% / reading 39% proficiency, ranked #146 of 620 in IL (top 24%) — families likely to look elsewhere, expect single-tenant / working-renter base with shorter leases.
- Zoned schools: Carl Sandburg High School (math 41% / reading 45%, grade F, #72 of 693 statewide, top 10%, 2,894 students, 0% FRL).
- Market conditions: Rents soft (-0.2%/yr); 105 active listings in the ZIP; 9 comparable units currently listed for rent nearby; rentals leasing fast (median 10d on market — plan ~1-2 weeks tenant-placement turnaround); solid renter incomes; 6,272 units permitted in Cook County in 2024 (4,658 in 5+ unit buildings).
Forward outlook
- Local home prices are declining (-3.0%/yr); year-one equity from $1k of loan paydown is wiped out by about $6k of value loss. Plan a longer hold.
Negotiation context
- It's been on market 278 days — a 12% lower offer ($189k) is reasonable based on typical stale-listing flexibility.
- 2 sale attempts since 6y ago; this cycle's ask has dropped $14k (6%) from the opening price — seller is motivated, your offer sets the floor, not the list.
- Current owner paid $182k; 18% above their basis — modest negotiation headroom, anchor on the comps not their cost.
Questions for the listing agent
- What do current leases actually rent for vs. the listed asking? Can we see a recent rent roll and the last 12 months of T-12 income?
- It's been on market 278 days. Have you received any prior offers? Is the seller open to a 12% concession, seller financing, or rate buy-down credit?
- What does the HOA fee cover, when was the last increase, and are there any pending special assessments or reserve-fund shortfalls?
- Any open or pending special assessments — roof, HVAC, plumbing, elevator, façade? What's the per-unit balance and payoff schedule, and is the seller paying it off at close or rolling it to the buyer?
- Why hasn't it sold? Are there any deal-killer items the seller is aware of (foundation, flood, title, zoning, code violations)?
- Is there a deadline driving the sale (1031 exchange, divorce, estate, relocation)? That informs how much negotiation room exists.
- The area grade is low — what's the realistic commute time and amenity access for the typical tenant pool here? Any planned neighborhood developments (good or bad) we should know about?
- What's the average days-on-market for RENTAL listings here right now (not sales)? A rising rental-DOM trend means longer vacancies and softer asking-rent achievability than the comps imply.
- What's the recent tenant-quality profile in this submarket — average credit score on applications, eviction rate, late-payment / NSF rate, and stable-employment percentage? A property-management company in the area should have these aggregated.
- How much new apartment / multifamily construction is in the pipeline within 1–3 miles? Heavy new supply (>2% of stock underway) typically softens rents 12–24 months out; light construction supports rent growth.
Investment metrics
- 1% rule
- 1.05% ✓
- Cap rate
- 5.98%
- Cash-on-cash
- -1.10%
- DSCR
- 0.95
- GRM
- 7.9
CMA / ARV
No comps found within radius.
Projected returns pro-forma
-3.0% appreciation · 0.0% rent growth · sell at horizon
- IRR
- -22.3%
- Equity multiple
- 0.26×
- Total profit
- $-44,620
- Equity at exit
- $31,983
- IRR
- -30.0%
- Equity multiple
- -0.13×
- Total profit
- $-67,880
- Equity at exit
- $18,546
Cash invested: $60,060 (down + closing). Projections, not guarantees.
Landlord ↔ Tenant lean methodology
- Overall (STATE)
- 43 Moderately Tenant-Leaning
- State Illinois
- 43 Moderately Tenant-Leaning · D+7
- County
- — inherits STATE
- City
- — inherits STATE
ZIP-level market 60462
- Rents YoY
- -0.2%
- Active inventory
- 105
- Price-to-rent
- 7.9×
Monthly cashflow live
- Estimated rent
- $2,254 high interval (Pro) →
- Mortgage (P&I)
- −$1,125
- Tax from tax record
- −$294 /mo · $3,525/yr
- Insurance
- −$89
- HOA
- −$328
- Vacancy / Maint / Mgmt
- −$473
- Net cashflow
- $-55
Break-even live
Sensitivity live
| Price | -10% $66 | -5% $6 | +0% $-55 | +5% $-116 | +10% $-176 |
|---|---|---|---|---|---|
| Rent | -10% $-233 | -5% $-144 | +0% $-55 | +5% $34 | +10% $123 |
| Rate | -1.0pp $53 | -0.5pp $0 | base $-55 | +0.5pp $-111 | +1.0pp $-167 |
UW: 25.0% down · 7.5% · 30yr · 1.5% tax · 5.0% vac · 8.0% maint · 8.0% mgmt
Financing live
Cash to close
- Down payment
- $53,625
- Closing costs
- $6,435
- Reserves months
- —
- Total cash needed
- —
Loan-product check · same deal, 3 products live
Conventional
25% down · 7.5% · 30yr
- Down + closing
- —
- Monthly P&I
- —
- Monthly cashflow
- —
- DSCR
- —
- Eligible?
- —
Personal DTI + credit; lowest rate.
DSCR
20% down · 8.5% · 30yr
- Down + closing
- —
- Monthly P&I
- —
- Monthly cashflow
- —
- DSCR
- —
- Eligible?
- —
No personal income docs; deal must DSCR.
Hard money
10% down · 12.0% · 12mo
- Down + closing
- —
- Monthly P&I
- —
- Monthly cashflow
- —
- DSCR
- —
- Eligible?
- —
Short-term bridge; refi at stabilization.
Rent comps 9 comps
| Address | Beds | Baths | Sqft | Rent | $/sqft | DOM | Units | Dist |
|---|---|---|---|---|---|---|---|---|
| 15834 Orlan Brook Dr Unit 3E Orland Park, IL | 2.0 | 1.0 | 1000 | $1,800 | $1.80 | 19d | 1 | 0.13mi |
| 15826 Farm Hill Dr Orland Park, IL | 3.0 | 1.5 | 1500 | $2,500 | $1.67 | 12d | 1 | 0.16mi |
| 15502 Orlan Brook Dr #222 Orland Park, IL | 2.0 | 2.0 | 1069 | $2,500 | $2.34 | 9d | 1 | 0.23mi |
| 15502 Orlan Brook Dr #222 Orland Park, IL | 2.0 | 2.0 | 1069 | $2,700 | $2.53 | 26d | 1 | 0.23mi |
| 16180 Apple Ln #2 Tinley Park, IL | 3.0 | 2.5 | 1250 | $2,900 | $2.32 | 7d | 1 | 0.59mi |
| 9309 Wherry Ln Orland Park, IL | 2.0 | 2.5 | 1500 | $2,525 | $1.68 | 26d | 1 | 0.84mi |
| 16450 Cherry Hill Ave Tinley Park, IL | 3.0 | 2.0 | 1370 | $3,100 | $2.26 | 9d | 1 | 0.96mi |
| 9119 Lincoln Ct #204 Orland Park, IL | 2.0 | 2.0 | 1172 | $1,995 | $1.70 | 0d | 1 | 1.16mi |
| 7927 163rd Ct Tinley Park, IL | 2.0 | 1.0 | 1000 | $2,300 | $2.30 | 0d | 1 | 1.25mi |
HOA detail condo
- Monthly dues
- $328 · $3,936/yr
- Likely covers
- pool
- Assessments
- None detected in remarks — confirm with the listing agent.
Listing history 23 events
-
2026-06-21days on market $214,500 Active 278 DOM
-
2026-06-18days on market $214,500 Active 275 DOM
-
2026-06-17pricedays on market $214,500 Active 274 DOM
-
2026-06-16days on market $219,500 Active 273 DOM
-
2026-06-15days on market $219,500 Active 272 DOM
-
2026-06-13days on market $219,500 Active 270 DOM
-
2026-06-09days on market $219,500 Active 266 DOM
-
2026-06-08days on market $219,500 Active 265 DOM
-
2026-06-07days on market $219,500 Active 264 DOM
-
2026-06-04days on market $219,500 Active 261 DOM
-
2026-06-03days on market $219,500 Active 260 DOM
-
2026-06-02days on market $219,500 Active 259 DOM
-
2026-06-01days on market $219,500 Active 258 DOM
-
2026-05-31days on market $219,500 Active 257 DOM
-
2026-03-23price $219,500
-
2025-09-15$228,500 Active
-
2025-07-15soldstatus $182,500
-
2021-06-30soldstatus $140,000
-
2020-12-29status Contingent (Do Not Show)
-
2020-12-28historical
-
2020-11-08New
-
1989-05-17soldstatus $40,500
-
1988-03-01soldstatus $75,000
ⓘ Source: listings_history table (triggers on properties + properties_extension) + one-shot
backfill from property_details.listing_events for pre-trigger history.
Tax reassessment forecast IL · Partial reset (capped growth)
- Current annual tax
- $3,525 · $294/mo
- Projected year-2 tax
- $4,197 · $350/mo
- Expected delta
- +$672/yr (+$56/mo · 19.1%)
ⓘ Screening estimate from a state-policy table — verify with the county assessor before closing.
Climate risk First Street
- Flood 1/10 Low FEMA zone X (unshaded) · 0% chance over 30 yrs
- Wildfire 1/10 Low
- Heat 3/10 Moderate 7 d/yr ≥102°F today · 15 d/yr by 30 yrs out
- Wind 2/10 Low
- Air quality 4/10 Moderate 4 unhealthy d/yr today · 5 by 30 yrs out
Nearby sold comps map
Loading sold comps map…
Walkable amenities ~0.75 mi
Loading nearby amenities…
Taxation est. · year 1
- Rental income
- $27,053
- − Mortgage interest
- −$12,015
- − Property taxes
- −$3,525
- − Insurance
- −$1,072
- − Repairs & maintenance
- −$2,164
- − Management
- −$2,164
- − HOA
- −$3,936
- − Depreciation
- −$6,240
- Taxable loss
- −$4,065
- Est. tax savings @ 24.0%
- +$976
- After-tax cash flow
- $315/yr
For passive investors: Depreciation is non-cash, so a rental often shows a tax loss while cash-flowing — sheltering income. Rental losses are passive: they offset passive income freely, and up to $25,000/yr can offset ordinary (W-2) income if you actively participate and your MAGI is under $100k (phasing out to $0 by $150k); unused losses carry forward. On sale, claimed depreciation is recaptured at up to 25%, and gains may owe capital-gains tax (a 1031 exchange can defer both). Figures are a year-1 estimate at your 24.0% rate — not tax advice; consult a CPA.
Schools (NCES district)
- District
- Cons Hsd 230
- NCES district ID
- 1708400
- Math proficiency
- 35% ▼ -8.00%
- Reading proficiency
- 39% ▼ -6.00%
- Median HH income
- $73,953
- Composite
- 34.29/100
- National rank
- #5244
- State rank
- #146 of 620 in IL
Livability — Orland Park
- Score
- 85/100
- State rank
- #29
- US rank
- #529
Category grades
Schools grade is shown separately in the Schools card above.
Census & demographics
- Census place
- Orland Park, IL
- County
- Cook County · 4,486,803 people
- City population
- 41,456
- Metro
- Chicago-Naperville-Elgin, IL-IN-WI
- Population (ZIP)
- 41,456
- Household income
- $96,526
- Rent vs Own
- Severe rent burden
- 668.0
Population outlook (Cook County) Hauer SSP2
- Today (2025)
- 5,347,519 people
- By 2030
- 5,357,703 · +0.2%
- By 2040
- 5,324,924 · -0.4%
- By 2050
- 5,230,762 · -2.2%
- By 2075
- 4,785,735 · -10.5%
- By 2100
- 4,188,836 · -21.7%
Race, ethnicity, and origin ACS 2023
- Neighborhood character
- Predominantly White (78%)
- Race & ethnicity
- White 78% Hispanic / Latino 12% Two or more races 8% Asian 6% Black 3%
- Hispanic origin (detail)
- Mexican 7% Cuban 2%
- Common ancestry
- Romanian 17% Armenian 2% Iranian 2%
- Foreign-born
- 16% · Canada, South Korea
- Languages at home
- 73% English-only · Spanish 7% Arabic 7% Russian/Polish/Slavic 6%
Political lean MEDSL · Cook
- 2024 margin
- Solid D (+42.0) · D 70.4% · R 28.4% · Other 1.2%
- 2008→2024 swing
- -11.4pp toward R · 2008: 53.4pp · 2024: 42.0pp
- All cycles
- 2024: D+42.0 2020: D+50.3 2016: D+53.0 2012: D+49.4 2008: D+53.4
Not yet ingested
- Civics
- —
Market trends
- HPI YoY
- ▼ -198.71%
- Current HPI
- 203.5329
- Rent YoY
- ▼ -0.17%
- Metro
- Chicago-Naperville-Elgin, IL-IN-WI
- State GDP YoY
- ▲ 1.59%
- F500 in state
- 60
Industry mix (Fortune 500 HQ in IL)
| Industry | F500 HQs | Revenue |
|---|---|---|
| Insurance | 4 | $201B |
|
||
| Consumer Goods | 4 | $87B |
|
||
| Industrial Machinery | 3 | $64B |
|
||
| Healthcare | 2 | $55B |
|
||
| Retail / Pharmacy | 1 | $148B |
|
||
| Agriculture / Food | 1 | $86B |
|
||
Price history
+192.7% since first listed9 events — show timeline
- 2026-03-23 Price Changed $219,500 MRED as Distributed by MLS Grid
- 2025-09-15 Listed $228,500 MRED as Distributed by MLS Grid
- 2025-07-15 Sold (Public Records) $182,500 Public Records
- 2021-06-30 Sold (Public Records) $140,000 Public Records
- 2020-12-29 Pending — MRED as Distributed by MLS Grid
- 2020-12-28 Listing Removed — MRED as Distributed by MLS Grid
- 2020-11-08 Listed — MRED as Distributed by MLS Grid
- 1989-05-17 Sold (Public Records) $40,500 Public Records
- 1988-03-01 Sold (Public Records) $75,000 Public Records
Property tax history
+5.3%/yrLatest (2023): $3,525 · +45.9% YoY. Source: county tax records.
Cash-flow waterfall
monthlySold comps — $/sqft
last 12 mo · ≤1 miLoading sold comps…