 15-Plex
755 S Canyon Blvd · John Day, OR
Flood risk 6/10 · Moderate
- FEMA flood zone
- X (shaded)
- Chance of flooding over 30 yrs
- 0.27%
- Est. flood insurance / yr
- $507 – $1,088
Fire risk 4/10 · Minor
- Est. fire insurance / yr
- $498 – $926
Heat risk 4/10 · Minor
- Hot days now (above 93°F)
- 8 days/yr
- Hot days in 30 yrs
- 19 days/yr
Wind risk 1/10 · Minimal
- Chance of severe wind over 30 yrs
- —
Air-quality risk 7/10 · Major
- Unhealthy air days now
- 9 days/yr
- Unhealthy air days in 30 yrs
- 11 days/yr
Risk factors via First Street. Map © Google.
Why this score? — see what drove the B- grade
The composite is a weighted blend of 9 inputs, each scored 0–100. Each bar is that input's sub-score; the figure is the points it added to the 100-point composite (weight × sub-score).
- Cash flow +30.0/30.0
- 1% rule +10.0/10.0
- DSCR +10.0/10.0
- ARV discount +7.5/15.0
- Livability +4.0/5.0
- Schools +3.4/10.0
- Rent growth +2.5/5.0
- Condition / age +2.2/5.0
- Appreciation +0.0/10.0
$450,000
🖨 Deal sheet 📄 Offer letter ✓ Due diligence
Multi-family units
County records classify this as Multi-Family (5+ Unit). Listing-text estimate: 15 units. confirmed
5+ unit building — per-unit beds/baths from public records are typically unavailable; the breakdown below (if shown) is an estimate from the listing text.
Listing remarks MLS
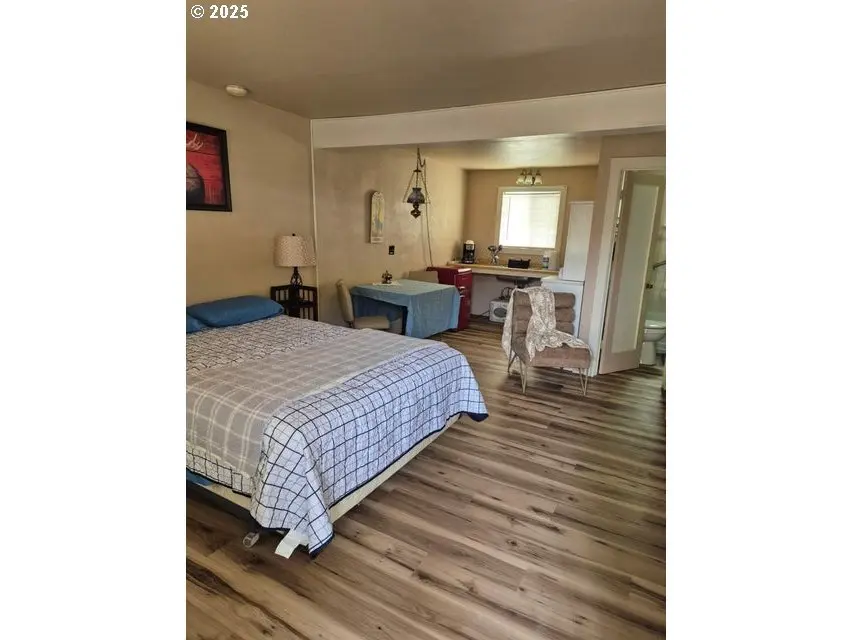
Elkhorn Cabins & Storage offers a rare investment opportunity in the heart of John Day. This property includes a 15-unit apartment complex situated on half an acre, along with 20 on-site storage units that provide additional monthly income. There is also excellent potential to add a laundromat, giving future owners the option to expand revenue even further. Conveniently located close to local amenities, this property is well-positioned for strong occupancy and long-term growth. A versatile and affordable investment like this doesn't come along often—Elkhorn Cabins & Storage could be yours.
Key facts
- Long term growth
- 0.52 acre lot
- 25 parking spots
Tags
Neighborhood map
What this means for you Summary
Snapshot
- This is a 15 × 1-bed/1-bath units multifamily listed at $450k. Condition is rated fair.
Deal economics
- At list price, monthly cash flow is $6k ($76k/yr) — positive. Per door: $420/mo.
- The deal already cash-flows at list — no discount required.
- Meets the 1% rule at list price ($12k rent vs $450k).
- Recommended offer: $396k (12.0% below list) — sets the bar for market timing.
- Cap rate 23.1% vs local median 1.9% in John Day — top-decile yield for the area; either an underpriced asset or a hidden risk that comps aren't pricing in. Stress-test before assuming the spread holds.
Location & tenants
- Location reads 81/100 on livability (#53 in OR, #1,604 nationally) — a professional / high-income tenant draw. Strengths: cost of living A+, housing A+, health & safety A+; Watch: schools D+, commute F, employment D-.
- John Day SD 3 (rural): math 31% / reading 50% proficiency, ranked #16 of 58 in OR (top 28%) — families likely to look elsewhere, expect single-tenant / working-renter base with shorter leases.
- Market conditions: 47 active listings in the ZIP; 9 units permitted in Grant County in 2024 (0 in 5+ unit buildings).
Forward outlook
- Local home prices are declining (-3.0%/yr); year-one equity from $3k of loan paydown is wiped out by about $14k of value loss. Plan a longer hold.
- Grant County population projected at -29% by 2050 — secular population decline; favor cash flow + early exit over multi-decade hold.
- At projected returns (-3.0% appreciation + 3.0% rent growth), your $126k cash investment doubles in ~2 years — after that, you're playing with house money.
Negotiation context
- It's been on market 188 days — a 12% lower offer ($396k) is reasonable based on typical stale-listing flexibility.
- 2 sale attempts with the ask held roughly flat each time — persistent listings suggest the price (not the market) is what's stuck; bring a comps-based counter.
Risks & watch-outs
- Watch-outs: built in 1948 — expect roof / HVAC / electrical / plumbing capex.
- Climate carrying-cost: major flood risk — expect insurance premiums to compound above CPI over the hold.
Questions for the listing agent
- It's been on market 188 days. Have you received any prior offers? Is the seller open to a 12% concession, seller financing, or rate buy-down credit?
- Can we see the unit-by-unit rent roll, current vacancy, and any below-market leases? What's the average tenancy length?
- What capital expenditures (roof, boiler, parking lot, exteriors) have been made in the last 5 years, and what's planned in the next 2?
- Have any recent inspections been done? Can we get a copy of the seller's disclosures and any deferred-maintenance estimates?
- Built in 1948 — when were the roof, HVAC, electrical panel, plumbing, and water heater last replaced?
- Why hasn't it sold? Are there any deal-killer items the seller is aware of (foundation, flood, title, zoning, code violations)?
- Is there a deadline driving the sale (1031 exchange, divorce, estate, relocation)? That informs how much negotiation room exists.
- Schools are D-rated, which usually means shorter tenancies and higher turnover. Who's the typical renter profile here, and what's been the actual vacancy rate?
- What's the average days-on-market for RENTAL listings here right now (not sales)? A rising rental-DOM trend means longer vacancies and softer asking-rent achievability than the comps imply.
- What's the recent tenant-quality profile in this submarket — average credit score on applications, eviction rate, late-payment / NSF rate, and stable-employment percentage? A property-management company in the area should have these aggregated.
- How much new apartment / multifamily construction is in the pipeline within 1–3 miles? Heavy new supply (>2% of stock underway) typically softens rents 12–24 months out; light construction supports rent growth.
Investment metrics
- 1% rule
- 2.65% ✓
- Cap rate
- 23.09%
- Cash-on-cash
- 59.98%
- DSCR
- 3.67
- GRM
- 3.1
CMA / ARV
No comps found within radius.
Projected returns pro-forma
-3.0% appreciation · 3.0% rent growth · sell at horizon
- IRR
- 58.7%
- Equity multiple
- 3.61×
- Total profit
- $328,350
- Equity at exit
- $67,096
- IRR
- 63.5%
- Equity multiple
- 7.37×
- Total profit
- $803,118
- Equity at exit
- $38,908
Cash invested: $126,000 (down + closing). Projections, not guarantees.
Landlord ↔ Tenant lean methodology
- Overall (STATE)
- 28 Tenant-Leaning
- State Oregon
- 28 Tenant-Leaning · D+6
- County
- — inherits STATE
- City
- — inherits STATE
ZIP-level market 97845
- Home prices YoY
- -6.1%
- Active inventory
- 47
- Price-to-rent
- 47.2×
Monthly cashflow live
- Estimated rent
- $11,908 medium interval (Pro) →
- Mortgage (P&I)
- −$2,360
- Tax est. 1.5%
- −$562 /mo · $6,750/yr
- Insurance
- −$188
- HOA
- −$0
- Vacancy / Maint / Mgmt
- −$2,501
- Net cashflow
- $6,297
Break-even live
15-unit breakdown (identical units grouped — click to expand)
| Units | Beds | Baths | Est. rent |
|---|---|---|---|
| 15× units | 1 | 1 | $11,910 |
| #1 | 1 | 1 | $794 |
| #2 | 1 | 1 | $794 |
| #3 | 1 | 1 | $794 |
| #4 | 1 | 1 | $794 |
| #5 | 1 | 1 | $794 |
| #6 | 1 | 1 | $794 |
| #7 | 1 | 1 | $794 |
| #8 | 1 | 1 | $794 |
| #9 | 1 | 1 | $794 |
| #10 | 1 | 1 | $794 |
| #11 | 1 | 1 | $794 |
| #12 | 1 | 1 | $794 |
| #13 | 1 | 1 | $794 |
| #14 | 1 | 1 | $794 |
| #15 | 1 | 1 | $794 |
| Total (15 units) | $11,908 | ||
UW: 25.0% down · 7.5% · 30yr · 1.5% tax · 5.0% vac · 8.0% maint · 8.0% mgmt
Financing live
Cash to close
- Down payment
- $112,500
- Closing costs
- $13,500
- Reserves months
- —
- Total cash needed
- —
Loan-product check · same deal, 3 products live
Conventional
25% down · 7.5% · 30yr
- Down + closing
- —
- Monthly P&I
- —
- Monthly cashflow
- —
- DSCR
- —
- Eligible?
- —
Personal DTI + credit; lowest rate.
DSCR
20% down · 8.5% · 30yr
- Down + closing
- —
- Monthly P&I
- —
- Monthly cashflow
- —
- DSCR
- —
- Eligible?
- —
No personal income docs; deal must DSCR.
Hard money
10% down · 12.0% · 12mo
- Down + closing
- —
- Monthly P&I
- —
- Monthly cashflow
- —
- DSCR
- —
- Eligible?
- —
Short-term bridge; refi at stabilization.
Listing history 16 events
-
2026-06-18days on market $450,000 Active 188 DOM
-
2026-06-17days on market $450,000 Active 187 DOM
-
2026-06-16days on market $450,000 Active 186 DOM
-
2026-06-15days on market $450,000 Active 185 DOM
-
2026-06-13days on market $450,000 Active 183 DOM
-
2026-06-12days on market $450,000 Active 182 DOM
-
2026-06-09days on market $450,000 Active 179 DOM
-
2026-06-08days on market $450,000 Active 178 DOM
-
2026-06-08days on market $450,000 Active 177 DOM
-
2026-06-07days on market $450,000 Active 176 DOM
-
2026-06-04days on market $450,000 Active 173 DOM
-
2026-06-02days on market $450,000 Active 172 DOM
-
2026-06-01days on market $450,000 Active 171 DOM
-
2026-05-31days on market $450,000 Active 170 DOM
-
2025-12-12$450,000 Active 610-char remark
Show marketing remark (730 chars)
Elkhorn Cabins & Storage offers a rare investment opportunity in the heart of John Day. This property includes a 15-unit apartment complex situated on half an acre, along with 20 on-site storage units that provide additional monthly income. Many of the hotel rooms have already undergone rennovation. Some units have long-term month-to-month cash tenants. There is also excellent potential to add a laundromat, giving future owners the option to expand revenue even further. Conveniently located close to local amenities, this property is well-positioned for strong occupancy and long-term growth. A versatile and affordable investment like this doesn't come along often—Elkhorn Cabins & Storage could be yours.
-
2025-12-12$450,000 Active 730-char remark
Show marketing remark (730 chars)
Elkhorn Cabins & Storage offers a rare investment opportunity in the heart of John Day. This property includes a 15-unit apartment complex situated on half an acre, along with 20 on-site storage units that provide additional monthly income. Many of the hotel rooms have already undergone rennovation. Some units have long-term month-to-month cash tenants. There is also excellent potential to add a laundromat, giving future owners the option to expand revenue even further. Conveniently located close to local amenities, this property is well-positioned for strong occupancy and long-term growth. A versatile and affordable investment like this doesn't come along often—Elkhorn Cabins & Storage could be yours.
ⓘ Source: listings_history table (triggers on properties + properties_extension) + one-shot
backfill from property_details.listing_events for pre-trigger history.
Climate risk First Street
- Flood 6/10 Major FEMA zone X (shaded) · 27% chance over 30 yrs
- Wildfire 4/10 Moderate
- Heat 4/10 Moderate 8 d/yr ≥93°F today · 19 d/yr by 30 yrs out
- Wind 1/10 Low
- Air quality 7/10 Severe 9 unhealthy d/yr today · 11 by 30 yrs out
Nearby sold comps map
Loading sold comps map…
Walkable amenities ~0.75 mi
Loading nearby amenities…
Taxation est. · year 1
- Rental income
- $142,896
- − Mortgage interest
- −$25,207
- − Property taxes
- −$6,750
- − Insurance
- −$2,250
- − Repairs & maintenance
- −$11,432
- − Management
- −$11,432
- − Depreciation
- −$13,091
- Taxable income
- $72,735
- Est. tax owed @ 24.0%
- −$17,456
- After-tax cash flow
- $58,113/yr
For passive investors: Depreciation is non-cash, so a rental often shows a tax loss while cash-flowing — sheltering income. Rental losses are passive: they offset passive income freely, and up to $25,000/yr can offset ordinary (W-2) income if you actively participate and your MAGI is under $100k (phasing out to $0 by $150k); unused losses carry forward. On sale, claimed depreciation is recaptured at up to 25%, and gains may owe capital-gains tax (a 1031 exchange can defer both). Figures are a year-1 estimate at your 24.0% rate — not tax advice; consult a CPA.
Condition & rehab AI · 12 photos
This multi-family property requires moderate renovations to improve its condition and increase its value. Key areas for improvement include the kitchen and bathrooms, as well as landscaping and curb appeal. Adding a laundromat could significantly boost rental income.
Repairs flagged
- Major kitchen appliances — Outdated and worn, need replacement.
- Major bathroom fixtures — Worn and outdated, need replacement.
- Major landscaping — Overgrown and not maintained, needs trimming and planting.
Value-add opportunities
- Resale Paint and update kitchen appliances — Fresh paint and updated appliances will attract more renters.
- Both Landscaping and curb appeal improvements — Improved landscaping will enhance both resale and rental value.
- Resale Replace outdated bathroom fixtures — New fixtures will appeal to renters and buyers.
- Both Add a laundromat — Potential to increase revenue and attract more tenants.
- Both Update HVAC and mechanical systems — Modern systems will improve comfort and energy efficiency, attracting more tenants and buyers.
Renovation cost estimate screening
| Repair item | Severity | Est. cost |
|---|---|---|
| kitchen appliances · Outdated and worn, need replacement. | Major | $15,000–50,000 |
| bathroom fixtures · Worn and outdated, need replacement. | Major | $15,000–50,000 |
| landscaping · Overgrown and not maintained, needs trimming and planting. | Major | $15,000–50,000 |
| Total estimated repair cost · 3 items | $45,000–150,000 |
Value-add ROI direction
- Resale Paint and update kitchen appliances — Fresh paint and updated appliances will attract more renters. ↑
- Both Landscaping and curb appeal improvements — Improved landscaping will enhance both resale and rental value. ↑
- Resale Replace outdated bathroom fixtures — New fixtures will appeal to renters and buyers. ↑
- Both Add a laundromat — Potential to increase revenue and attract more tenants. ↑
- Both Update HVAC and mechanical systems — Modern systems will improve comfort and energy efficiency, attracting more tenants and buyers. ↑
ⓘ Cost ranges are severity-bucket heuristics (US national rule-of-thumb). Get contractor quotes + a written scope before underwriting a rehab budget.
Schools (NCES district)
- District
- John Day SD 3
- NCES district ID
- 4106780
- Math proficiency
- 31% ▼ -2.00%
- Reading proficiency
- 50% ▼ -8.00%
- Median HH income
- $39,007
- Composite
- 33.78/100
- National rank
- #5366
- State rank
- #16 of 58 in OR
Livability — John Day
- Score
- 81/100
- State rank
- #53
- US rank
- #1604
Category grades
Schools grade is shown separately in the Schools card above.
Census & demographics
- Census place
- John Day, OR
- Population (ZIP)
- 2,326
Population outlook (Grant County) Hauer SSP2
- Today (2025)
- 6,485 people
- By 2030
- 6,060 · -6.6%
- By 2040
- 5,222 · -19.5%
- By 2050
- 4,581 · -29.4%
- By 2075
- 3,578 · -44.8%
- By 2100
- 2,756 · -57.5%
Race, ethnicity, and origin ACS 2023
- Neighborhood character
- Predominantly White (89%)
- Race & ethnicity
- White 89% Two or more races 9% Asian 2%
- Common ancestry
- Slovak 8% Italian 6% Lithuanian 3%
- Foreign-born
- 2% · Canada
- Languages at home
- 98% English-only · Other Indo-European 1% Spanish 1%
Political lean MEDSL · Grant
- 2024 margin
- Solid R (+60.4) · D 18.4% · R 78.8% · Other 2.8%
- 2008→2024 swing
- -14.9pp toward R · 2008: -45.5pp · 2024: -60.4pp
- All cycles
- 2024: R+60.4 2020: R+56.9 2016: R+58.9 2012: R+53.3 2008: R+45.5
Not yet ingested
- Civics
- —
Market trends
- HPI YoY
- ▼ -15.58%
- Current HPI
- 239.7254
- Rent YoY
- —
- Metro
- —
- State GDP YoY
- ▲ 2.05%
- F500 in state
- 2
Industry mix (Fortune 500 HQ in OR)
| Industry | F500 HQs | Revenue |
|---|---|---|
| Consumer Goods | 1 | $51B |
|
||
Price history
+0.0% since first listed2 events — show timeline
- 2025-12-12 Listed $450,000 MLSCO
- 2025-12-12 Listed $450,000 RMLS
Cash-flow waterfall
monthlySold comps — $/sqft
last 12 mo · ≤1 miLoading sold comps…