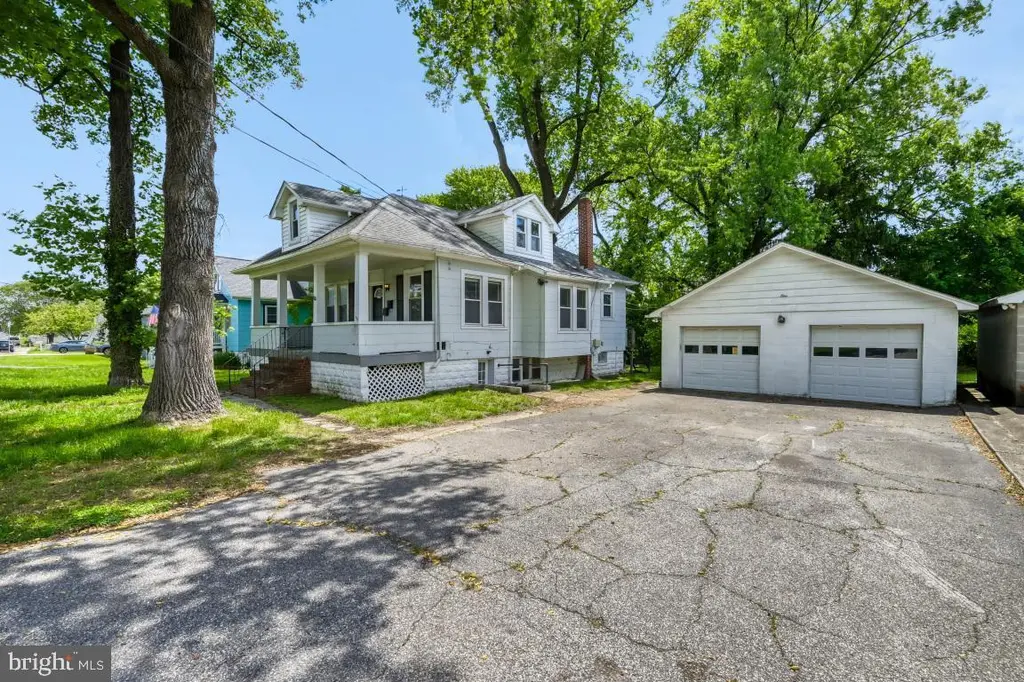
1 Eugenia Ave · Ferndale, MD
Flood risk No data
- FEMA flood zone
- —
- Chance of flooding over 30 yrs
- —
- Est. flood insurance / yr
- —
Fire risk No data
- Est. fire insurance / yr
- —
Heat risk No data
- Hot days now (above threshold)
- —
- Hot days in 30 yrs
- —
Wind risk No data
- Chance of severe wind over 30 yrs
- —
Air-quality risk No data
- Unhealthy air days now
- —
- Unhealthy air days in 30 yrs
- —
Risk factors via First Street. Map © Google.
Why this score? — see what drove the D grade
The composite is a weighted blend of 9 inputs, each scored 0–100. Each bar is that input's sub-score; the figure is the points it added to the 100-point composite (weight × sub-score).
- ARV discount +15.0/15.0
- Cash flow +11.0/30.0
- Livability +3.7/5.0
- Rent growth +3.5/5.0
- DSCR +3.2/10.0
- Schools +2.9/10.0
- 1% rule +2.8/10.0
- Condition / age +2.5/5.0
- Appreciation +0.0/10.0
$300,000
🖨 Deal sheet (PDF) 📄 Offer letter ✓ Due diligence
Listing remarks
Welcome to Ferndale Farms! This 3 bedroom, 1 bath home is full of potential and ready for your personal touch. A great starter home or investment opportunity, this property offers a solid layout, spacious living areas, and endless possibilities to make it your own. Situated in a fantastic location close to shopping, dining, major commuter routes, and local amenities. The standout feature is the huge detached 2-car garage — perfect for storage, a workshop, hobbies, or extra parking. With a little TLC, this home can truly shine. Don’t miss the chance to build equity and create the home you’ve been dreaming of! This home is AS-IS
Key facts
- 8,000 sq ft lot
- 2 garage spots
- Built 1917
Property features AI
Exterior
- Parking: Detached front-entry garage with 2 spaces; Driveway parking; Two total garage/parking spaces
- Utilities: Public water; Public sewer
- Home design: Detached structure; Above-grade and below-grade living/structures
- Construction: Block construction; Block foundation; Estimated year built
- Exterior features: No tidal water
Interior
- Bedrooms: Two bedrooms on the main level; One bedroom on the upper level
- Bathrooms: One full bathroom on the main level; One full bathroom total
- Heating & cooling: Central heating (oil); Central air conditioning (electric); Electric hot water
- Interior features: Unfinished basement; Estimated living area
Neighborhood map
What this means for you Summary
Snapshot
- This is a 3-bed/1.0-bath single-family listed at $300k.
Deal economics
- At list price, monthly cash flow is $-125 ($-1k/yr) — negative.
- To cash-flow at today's rent, offer at most $278k (7.4% below list).
- To meet the 1% rule (rent ≥ 1% of price), the offer needs to be $234k (22.0% below list).
- Recommended offer: $234k (22.0% below list) — sets the bar for 1% rule.
- Cap rate 5.8% vs local median 4.5% in Ferndale — meaningfully above typical; check what's discounted (condition, days-on-market, listing class) to confirm the premium yield is real.
Location & tenants
- Location reads 73/100 on livability (#128 in MD) — a middle-class / working-renter tenant base. Strengths: commute A+, housing A+, employment A; Watch: cost of living C-, crime F, amenities F.
- Anne Arundel County Public Schools (suburban): math 20% / reading 37% proficiency, ranked #10 of 24 in MD (top 42%) — low school quality limits family demand, transient renter base, plan for 1-2y turnover.
- Zoned schools: Monarch Global Academy Pcs Laurel Campus (math 13% / reading 28%, grade F, #341 of 860 statewide, top 40%, 830 students, 53% FRL); Lindale Middle (math 9% / reading 35%, grade F, #125 of 225 statewide, top 58%, 1,178 students, 59% FRL); North County High (math 33% / reading 58%, grade D-, #121 of 222 statewide, top 55%, 2,451 students, 63% FRL) — zoned schools average 58% FRL vs 25% district-wide (33 pts higher); higher-poverty schools than district average — tighter screening recommended.
- Market conditions: Rents rising (+3.9%/yr); 142 active listings in the ZIP; 13 comparable units currently listed for rent nearby; rentals at typical pace (median 20d on market — plan ~3-4 weeks tenant-placement turnaround); solid renter incomes; 1,303 units permitted in Anne Arundel County in 2024 (299 in 5+ unit buildings).
- This rent runs 32% of the median local income ($88k/yr) — at the standard rent-burdened threshold; future hikes will face affordability resistance.
Forward outlook
- Local home prices are declining (-3.0%/yr); year-one equity from $2k of loan paydown is wiped out by about $9k of value loss. Plan a longer hold.
- Anne Arundel County population projected at +17% by 2050 — long-run rental-demand tailwind backs the buy-and-hold thesis.
Negotiation context
- It's been on market 33 days — a 3% lower offer ($291k) is reasonable based on typical stale-listing flexibility.
- 4 sale attempts; this cycle's ask has dropped $25k (8%) from the opening price — seller is motivated, your offer sets the floor, not the list.
- Current owner paid $78k; list at $300k implies a 282% gain — meaningful room to come down on a strong offer.
Risks & watch-outs
- Watch-outs: built in 1917 — expect roof / HVAC / electrical / plumbing capex.
Questions for the listing agent
- What do current leases actually rent for vs. the listed asking? Can we see a recent rent roll and the last 12 months of T-12 income?
- It's been on market 33 days. Have you received any prior offers? Is the seller open to a 22% concession, seller financing, or rate buy-down credit?
- Built in 1917 — when were the roof, HVAC, electrical panel, plumbing, and water heater last replaced?
- Is there a deadline driving the sale (1031 exchange, divorce, estate, relocation)? That informs how much negotiation room exists.
- Schools are B-rated — typically a magnet for longer-tenancy family renters. What's the average tenant stay here, and is there a school-zone premium baked into asking?
- Crime grade is F in this area — have there been break-ins, vandalism, or insurance claims at this property in the last 3 years? What carrier currently insures it and at what premium?
- The area grade is low — what's the realistic commute time and amenity access for the typical tenant pool here? Any planned neighborhood developments (good or bad) we should know about?
- What's the average days-on-market for RENTAL listings here right now (not sales)? A rising rental-DOM trend means longer vacancies and softer asking-rent achievability than the comps imply.
- What's the recent tenant-quality profile in this submarket — average credit score on applications, eviction rate, late-payment / NSF rate, and stable-employment percentage? A property-management company in the area should have these aggregated.
- How much new for-sale + rental construction is in the pipeline within 1–3 miles? Heavy new supply typically softens prices + rents 12–24 months out; constrained supply supports both.
Investment metrics
- 1% rule
- 0.78% ✗
- Cap rate
- 5.79%
- Cash-on-cash
- -1.78%
- DSCR
- 0.92
- GRM
- 10.7
CMA / ARV
- ARV (median comp)
- $380,832
- List price
- $300,000
- Delta
- -14.66%
- Verdict
- UNDERPRICED
- Comps
- 4 within 1.0 mi
Show comp detail 12 sales within ~0.75 mi
| Address | Dist | Beds/Ba | Sqft | Sold | Price | $/sf | Match |
|---|---|---|---|---|---|---|---|
| 3 Belvedere Ave | 0.29mi | 3/3.0 | 1,440 (+3%) | 1mo | $470,000 | $326 | 74 |
| 405 Melrose Ave | 0.27mi | 4/2.0 (+1) | 1,440 (+3%) | 8mo | $440,000 | $306 | 67 |
| 258 Heartwood Ct | 0.57mi | 3/2.0 | 1,438 (+2%) | 1mo | $390,000 | $271 | 64 |
| 104 1st Ave W | 0.41mi | 3/2.0 | 1,468 (+5%) | 8mo | $400,000 | $272 | 63 |
| 819 Bentwillow Dr | 0.68mi | 3/1.0 | 1,346 (-4%) | 0mo | $350,000 | $260 | 61 |
| 205 Wicklow Rd | 0.42mi | 3/2.0 | 1,525 (+9%) | 3mo | $458,000 | $300 | 59 |
| 104 Baltimore Ave | 0.22mi | 4/2.0 (+1) | 1,612 (+15%) | 3mo | $315,000 | $195 | 54 |
| 1002 Rosedale Ave | 0.70mi | 3/1.5 | 1,498 (+7%) | 1mo | $312,000 | $208 | 53 |
| 220 Poplar Ave | 0.63mi | 3/1.0 | 1,512 (+8%) | 7mo | $255,000 | $169 | 52 |
| 1628 Pleasantville Dr | 0.71mi | 3/1.5 | 1,496 (+7%) | 2mo | $405,000 | $271 | 52 |
| 38 Glendale Ave | 0.75mi | 3/1.5 | 1,560 (+11%) | 4mo | $340,000 | $218 | 41 |
| 898 Brighton Pl | 0.74mi | 3/2.0 | 1,540 (+10%) | 6mo | $425,000 | $276 | 40 |
Match score weights: distance 35% · size 25% · config 20% · recency 20%. Top-matched comps best support the ARV.
Projected returns pro-forma
-3.0% appreciation · 3.87% rent growth · sell at horizon
- IRR
- -18.3%
- Equity multiple
- 0.35×
- Total profit
- $-54,523
- Equity at exit
- $44,731
- IRR
- -9.1%
- Equity multiple
- 0.41×
- Total profit
- $-49,190
- Equity at exit
- $25,939
Cash invested: $84,000 (down + closing). Projections, not guarantees.
Landlord ↔ Tenant lean methodology
- Overall (STATE)
- 27 Tenant-Leaning
- State Maryland
- 27 Tenant-Leaning · D+14
- County
- — inherits STATE
- City
- — inherits STATE
ZIP-level market 21061
- Rents YoY
- 3.9%
- Active inventory
- 142
- Price-to-rent
- 10.7×
Monthly cashflow live
- Estimated rent
- $2,340 high interval (Pro) →
- Mortgage (P&I)
- −$1,573
- Tax from tax record
- −$275 /mo · $3,305/yr
- Insurance
- −$125
- HOA
- −$0
- Vacancy / Maint / Mgmt
- −$491
- Net cashflow
- $-125
Break-even live
Sensitivity live
| Price | -10% $45 | -5% $-40 | +0% $-125 | +5% $-210 | +10% $-295 |
|---|---|---|---|---|---|
| Rent | -10% $-310 | -5% $-217 | +0% $-125 | +5% $-32 | +10% $60 |
| Rate | -1.0pp $26 | -0.5pp $-49 | base $-125 | +0.5pp $-203 | +1.0pp $-282 |
UW: 25.0% down · 7.5% · 30yr · 1.5% tax · 5.0% vac · 8.0% maint · 8.0% mgmt
Financing live
Cash to close
- Down payment
- $75,000
- Closing costs
- $9,000
- Reserves months
- —
- Total cash needed
- —
Loan-product check · same deal, 3 products live
Conventional
25% down · 7.5% · 30yr
- Down + closing
- —
- Monthly P&I
- —
- Monthly cashflow
- —
- DSCR
- —
- Eligible?
- —
Personal DTI + credit; lowest rate.
DSCR
20% down · 8.5% · 30yr
- Down + closing
- —
- Monthly P&I
- —
- Monthly cashflow
- —
- DSCR
- —
- Eligible?
- —
No personal income docs; deal must DSCR.
Hard money
10% down · 12.0% · 12mo
- Down + closing
- —
- Monthly P&I
- —
- Monthly cashflow
- —
- DSCR
- —
- Eligible?
- —
Short-term bridge; refi at stabilization.
Rent comps 13 comps
| Address | Beds | Baths | Sqft | Rent | $/sqft | DOM | Units | Dist |
|---|---|---|---|---|---|---|---|---|
| 105 Dinsmore Ave Glen Burnie, MD | 3.0 | 2.5 | 1731 | $2,800 | $1.62 | 20d | 1 | 0.21mi |
| 220 Poplar Ave Glen Burnie, MD | 3.0 | 1.0 | 1512 | $2,250 | $1.49 | 20d | 1 | 0.62mi |
| 906 Rosedale Ave Glen Burnie, MD | 3.0 | 2.0 | 1128 | $3,000 | $2.66 | 4d | 1 | 0.66mi |
| 1407 Gordon Dr Glen Burnie, MD | 3.0 | 2.0 | 1404 | $2,750 | $1.96 | 26d | 1 | 0.80mi |
| 6459 Grafton Garth Ct Glen Burnie, MD | 2.0 | 2.0 | 1116 | $1,900 | $1.70 | 24d | 1 | 0.98mi |
| 323 Lindera Ct Glen Burnie, MD | 4.0 | 2.5 | 1240 | $2,200 | $1.77 | 20d | 1 | 1.06mi |
| 6001 Heritage Hill Dr Glen Burnie, MD | 2.0 | 1.5 | 887 | $1,953 | $2.20 | 0d | 19 | 1.12mi |
| 6455 Heritage Hill Dr Glen Burnie, MD | 3.0 | 1.5 | 1152 | $1,700 | $1.48 | 5d | 1 | 1.37mi |
| 6401 Jefferson Pl Glen Burnie, MD | 3.0 | 1.5 | 1216 | $1,895 | $1.56 | 5d | 1 | 1.41mi |
| 57 Glen Ridge Rd Glen Burnie, MD | 1.0–2.0 | 1.0 | 806 | $1,700 | $2.11 | 0d | 24 | 1.41mi |
| 6456 Washington Sq Glen Burnie, MD | 3.0 | 1.5 | 1216 | $1,799 | $1.48 | 24d | 1 | 1.42mi |
| 6449 Union Ct Glen Burnie, MD | 3.0 | 1.5 | 1152 | $2,200 | $1.91 | 46d | 1 | 1.44mi |
| 101 S Charter Rd Glen Burnie, MD | 1.0–3.0 | 1.0–2.0 | 823 | $1,845 | $2.24 | 0d | 1 | 1.46mi |
Listing history 20 events
-
2026-06-21days on market $300,000 Active 33 DOM
-
2026-06-18days on market $300,000 Active 30 DOM
-
2026-06-17days on market $300,000 Active 29 DOM
-
2026-06-16days on market $300,000 Active 28 DOM
-
2026-06-15days on market $300,000 Active 27 DOM
-
2026-06-13days on market $300,000 Active 25 DOM
-
2026-06-09days on market $300,000 Active 21 DOM
-
2026-06-08days on market $300,000 Active 20 DOM
-
2026-06-07days on market $300,000 Active 19 DOM
-
2026-06-04days on market $300,000 Active 16 DOM
-
2026-06-03days on market $300,000 Active 15 DOM
-
2026-06-02days on market $300,000 Active 14 DOM
-
2026-06-01days on market $300,000 Active 13 DOM
-
2026-05-31days on market $300,000 Active 12 DOM
-
2026-05-18Active Under Contract 652-char remark
-
2026-05-18$325,000 652-char remark
-
2026-05-15historical Active Under Contract
-
2026-05-15historical
-
2026-05-01$325,000 Active
-
1987-11-16soldstatus $78,500
ⓘ Source: listings_history table (triggers on properties + properties_extension) + one-shot
backfill from property_details.listing_events for pre-trigger history.
Tax reassessment forecast MD · Partial reset (capped growth)
- Current annual tax
- $3,305 · $275/mo
- Projected year-2 tax
- $3,305 · $275/mo
- Expected delta
- $0/yr ($0/mo · 0.0%)
ⓘ Screening estimate from a state-policy table — verify with the county assessor before closing.
Nearby sold comps map
Loading sold comps map…
Walkable amenities ~0.75 mi
Loading nearby amenities…
Taxation est. · year 1
- Rental income
- $28,084
- − Mortgage interest
- −$16,805
- − Property taxes
- −$3,305
- − Insurance
- −$1,500
- − Repairs & maintenance
- −$2,247
- − Management
- −$2,247
- − Depreciation
- −$8,727
- Taxable loss
- −$6,747
- Est. tax savings @ 24.0%
- +$1,619
- After-tax cash flow
- $121/yr
For passive investors: Depreciation is non-cash, so a rental often shows a tax loss while cash-flowing — sheltering income. Rental losses are passive: they offset passive income freely, and up to $25,000/yr can offset ordinary (W-2) income if you actively participate and your MAGI is under $100k (phasing out to $0 by $150k); unused losses carry forward. On sale, claimed depreciation is recaptured at up to 25%, and gains may owe capital-gains tax (a 1031 exchange can defer both). Figures are a year-1 estimate at your 24.0% rate — not tax advice; consult a CPA.
Schools (NCES district)
- District
- Anne Arundel County Public Schools
- NCES district ID
- 2400060
- Math proficiency
- 20% ▼ -21.00%
- Reading proficiency
- 37% ▼ -13.00%
- Median HH income
- $87,880
- Composite
- 28.52/100
- National rank
- #6733
- State rank
- #10 of 24 in MD
Livability — Ferndale
- Score
- 73/100
- State rank
- #128
- US rank
- #5483
Category grades
Schools grade is shown separately in the Schools card above.
Census & demographics
- Census place
- Ferndale, MD
- County
- Anne Arundel County · 535,653 people
- Metro
- Baltimore-Columbia-Towson, MD
- Population (ZIP)
- 57,230
- Household income
- $87,751
- Rent vs Own
- Severe rent burden
- 2134.0
Population outlook (Anne Arundel County) Hauer SSP2
- Today (2025)
- 617,384 people
- By 2030
- 642,094 · +4.0%
- By 2040
- 686,621 · +11.2%
- By 2050
- 723,031 · +17.1%
- By 2075
- 809,346 · +31.1%
- By 2100
- 837,658 · +35.7%
Race, ethnicity, and origin ACS 2023
- Neighborhood character
- Diverse neighborhood (Simpson 0.67)
- Race & ethnicity
- White 50% Black 26% Hispanic / Latino 11% Two or more races 10% Asian 4%
- Hispanic origin (detail)
- Mexican 2% Puerto Rican 1%
- Common ancestry
- Romanian 3% Lithuanian 1% Slovak 1%
- Foreign-born
- 12% · Canada, Dominican Republic
- Languages at home
- 84% English-only · Spanish 9% Tagalog/Filipino 2% Other Indo-European 2%
Political lean MEDSL · Anne Arundel
- 2024 margin
- D (+13.9) · D 55.7% · R 41.7% · Other 2.6%
- 2008→2024 swing
- +15.7pp toward D · 2008: -1.8pp · 2024: 13.9pp
- All cycles
- 2024: D+13.9 2020: D+14.5 2016: D+0.7 2012: R+0.9 2008: R+1.8
Not yet ingested
- Civics
- —
Market trends
- HPI YoY
- ▼ -341.00%
- Current HPI
- 300.196
- Rent YoY
- ▲ 3.87%
- Metro
- Baltimore-Columbia-Towson, MD
- State GDP YoY
- ▲ 2.97%
- F500 in state
- 12
Industry mix (Fortune 500 HQ in MD)
| Industry | F500 HQs | Revenue |
|---|---|---|
| Aerospace / Defense | 1 | $71B |
|
||
| Utilities | 1 | $25B |
|
||
| Hotels | 1 | $24B |
|
||
| Consumer Goods | 1 | $7B |
|
||
| Real Estate | 1 | $6B |
|
||
| Chemicals | 1 | $2B |
|
||
Price history
+282.2% since first listed8 events — show timeline
- 2026-05-20 Price Changed $300,000 BRIGHT MLS
- 2026-05-19 Relisted — BRIGHT MLS
- 2026-05-18 Listed — BRIGHT MLS
- 2026-05-18 Listed $325,000 BRIGHT MLS
- 2026-05-15 Contingent — BRIGHT MLS
- 2026-05-15 Listing Removed — BRIGHT MLS
- 2026-05-01 Listed $325,000 BRIGHT MLS
- 1987-11-16 Sold (Public Records) $78,500 Public Records
Property tax history
+3.5%/yrLatest (2025): $3,305 · +4.3% YoY. Source: county tax records.
Cash-flow waterfall
monthlySold comps — $/sqft
last 12 mo · ≤1 miLoading sold comps…