 Multi-family
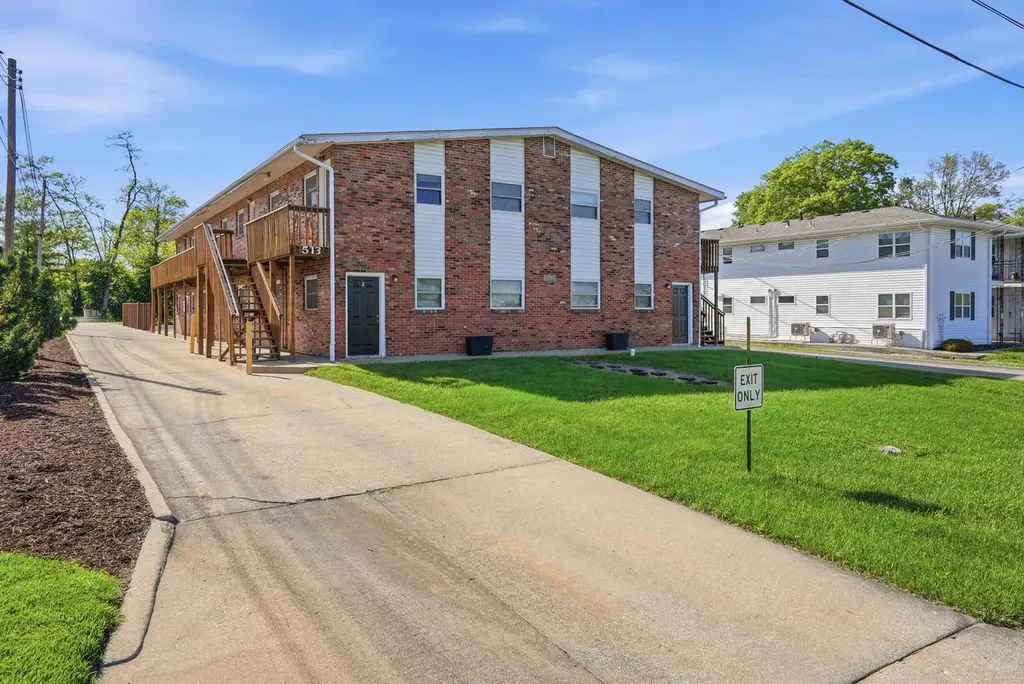
513 N Old Hwy 63 · Columbia, MO
Flood risk No data
- FEMA flood zone
- —
- Chance of flooding over 30 yrs
- —
- Est. flood insurance / yr
- —
Fire risk No data
- Est. fire insurance / yr
- —
Heat risk No data
- Hot days now (above threshold)
- —
- Hot days in 30 yrs
- —
Wind risk No data
- Chance of severe wind over 30 yrs
- —
Air-quality risk No data
- Unhealthy air days now
- —
- Unhealthy air days in 30 yrs
- —
Risk factors via First Street. Map © Google.
Why this score? — see what drove the B grade
The composite is a weighted blend of 9 inputs, each scored 0–100. Each bar is that input's sub-score; the figure is the points it added to the 100-point composite (weight × sub-score).
- Cash flow +30.0/30.0
- 1% rule +10.0/10.0
- DSCR +10.0/10.0
- ARV discount +7.5/15.0
- Rent growth +5.0/5.0
- Livability +4.2/5.0
- Schools +3.1/10.0
- Condition / age +1.0/5.0
- Appreciation +0.0/10.0
$925,000
🖨 Deal sheet 📄 Offer letter ✓ Due diligence
Multi-family units
County records classify this as Multi-Family (2-4 Unit). Listing-text estimate: 1 unit. estimate disagrees with records
Listing remarks MLS
9 1BR units at $480/mo and 3 2BR units at $580/mo for 12 total units. Well maintained building.
Key facts
- On site parking
- Close to campus
- Centrally located
Tags
Neighborhood map
What this means for you Summary
Snapshot
- This is a multifamily listed at $925k. Condition is rated poor.
Deal economics
- At list price, monthly cash flow is $7k ($79k/yr) — positive.
- The deal already cash-flows at list — no discount required.
- Meets the 1% rule at list price ($16k rent vs $925k).
- Cap rate 14.8% vs local median 2.9% in Columbia — top-decile yield for the area; either an underpriced asset or a hidden risk that comps aren't pricing in. Stress-test before assuming the spread holds.
Location & tenants
- Location reads 83/100 on livability (#9 in MO, #862 nationally) — a professional / high-income tenant draw. Strengths: amenities A+, commute A+, cost of living A+; Watch: crime D+.
- Columbia 93 (urban): math 30% / reading 43% proficiency, ranked #194 of 324 in MO (top 60%) — families likely to look elsewhere, expect single-tenant / working-renter base with shorter leases.
- Zoned schools: Jefferson Middle School (math 45% / reading 54%, grade C, #74 of 391 statewide, top 20%, 625 students, 32% FRL); David H. Hickman High (math 27% / reading 55%, grade F, #236 of 521 statewide, top 45%, 2,044 students, 33% FRL) — zoned schools at 33% FRL track the district average.
- Market conditions: Rents rising fast (+10.3%/yr); 355 active listings in the ZIP; 2 comparable units currently listed for rent nearby; 1,303 units permitted in Boone County in 2024 (549 in 5+ unit buildings).
- At $16,436/mo this rent would consume 410% of the median local household income ($48k/yr) (locally 4323% of renters already pay >50% of income on rent) — very limited rent-growth headroom before tenants either downsize or default.
Forward outlook
- Local home prices are declining (-3.0%/yr); year-one equity from $6k of loan paydown is wiped out by about $28k of value loss. Plan a longer hold.
- Boone County population projected at +36% by 2050 — long-run rental-demand tailwind backs the buy-and-hold thesis.
- At projected returns (-3.0% appreciation + 8.0% rent growth), your $259k cash investment doubles in ~4 years — after that, you're playing with house money.
Negotiation context
- Only 1 days on market — expect competitive offers; lowballing is unlikely to land.
Questions for the listing agent
- Have any recent inspections been done? Can we get a copy of the seller's disclosures and any deferred-maintenance estimates?
- Built in 1971 — when were the roof, HVAC, electrical panel, plumbing, and water heater last replaced?
- Is there a deadline driving the sale (1031 exchange, divorce, estate, relocation)? That informs how much negotiation room exists.
- Schools are B-rated — typically a magnet for longer-tenancy family renters. What's the average tenant stay here, and is there a school-zone premium baked into asking?
- Crime grade is D in this area — have there been break-ins, vandalism, or insurance claims at this property in the last 3 years? What carrier currently insures it and at what premium?
- What's the average days-on-market for RENTAL listings here right now (not sales)? A rising rental-DOM trend means longer vacancies and softer asking-rent achievability than the comps imply.
- What's the recent tenant-quality profile in this submarket — average credit score on applications, eviction rate, late-payment / NSF rate, and stable-employment percentage? A property-management company in the area should have these aggregated.
- How much new apartment / multifamily construction is in the pipeline within 1–3 miles? Heavy new supply (>2% of stock underway) typically softens rents 12–24 months out; light construction supports rent growth.
Investment metrics
- 1% rule
- 1.78% ✓
- Cap rate
- 14.84%
- Cash-on-cash
- 30.54%
- DSCR
- 2.36
- GRM
- 4.7
CMA / ARV
No comps found within radius.
Show comp detail 4 sales within ~0.75 mi
| Address | Dist | Beds/Ba | Sqft | Sold | Price | $/sf | Match |
|---|---|---|---|---|---|---|---|
| 4818 E Schooner Rd | 0.34mi | —/— | 3,068 | 6mo | $279,000 | $91 | 67 |
| 4816 E Schooner Rd | 0.37mi | —/— | 3,074 | 17mo | $310,000 | $101 | 56 |
| 4814 E Meadow Lark Lane A+b Ln | 0.45mi | —/— | 2,376 | 14mo | $235,000 | $99 | 55 |
| 4824 E Prairie Cir Unit A+B | 0.39mi | —/— | 3,482 | 22mo | $295,900 | $85 | 51 |
Match score weights: distance 35% · size 25% · config 20% · recency 20%. Top-matched comps best support the ARV.
Projected returns pro-forma
-3.0% appreciation · 8.0% rent growth · sell at horizon
- IRR
- 30.8%
- Equity multiple
- 2.38×
- Total profit
- $357,065
- Equity at exit
- $137,921
- IRR
- 40.7%
- Equity multiple
- 5.82×
- Total profit
- $1,247,890
- Equity at exit
- $79,977
Cash invested: $259,000 (down + closing). Projections, not guarantees.
Landlord ↔ Tenant lean methodology
- Overall (STATE)
- 81 Strongly Landlord-Friendly
- State Missouri
- 81 Strongly Landlord-Friendly · R+10
- County
- — inherits STATE
- City
- — inherits STATE
ZIP-level market 65201
- Rents YoY
- 10.3%
- Active inventory
- 355
- Price-to-rent
- 61.2×
Monthly cashflow live
- Estimated rent
- $16,436 medium interval (Pro) →
- Mortgage (P&I)
- −$4,851
- Tax est. 1.5%
- −$1,156 /mo · $13,875/yr
- Insurance
- −$385
- HOA
- −$0
- Vacancy / Maint / Mgmt
- −$3,452
- Net cashflow
- $6,592
Break-even live
12-unit breakdown (identical units grouped — click to expand)
| Units | Beds | Baths | Est. rent |
|---|---|---|---|
| 9× units | 1 | 1 | $11,340 |
| #1 | 1 | 1 | $1,260 |
| #2 | 1 | 1 | $1,260 |
| #3 | 1 | 1 | $1,260 |
| #4 | 1 | 1 | $1,260 |
| #5 | 1 | 1 | $1,260 |
| #6 | 1 | 1 | $1,260 |
| #7 | 1 | 1 | $1,260 |
| #8 | 1 | 1 | $1,260 |
| #9 | 1 | 1 | $1,260 |
| 3× units | 2 | 1 | $5,100 |
| #10 | 2 | 1 | $1,700 |
| #11 | 2 | 1 | $1,700 |
| #12 | 2 | 1 | $1,700 |
| Total (12 units) | $16,436 | ||
UW: 25.0% down · 7.5% · 30yr · 1.5% tax · 5.0% vac · 8.0% maint · 8.0% mgmt
Financing live
Cash to close
- Down payment
- $231,250
- Closing costs
- $27,750
- Reserves months
- —
- Total cash needed
- —
Loan-product check · same deal, 3 products live
Conventional
25% down · 7.5% · 30yr
- Down + closing
- —
- Monthly P&I
- —
- Monthly cashflow
- —
- DSCR
- —
- Eligible?
- —
Personal DTI + credit; lowest rate.
DSCR
20% down · 8.5% · 30yr
- Down + closing
- —
- Monthly P&I
- —
- Monthly cashflow
- —
- DSCR
- —
- Eligible?
- —
No personal income docs; deal must DSCR.
Hard money
10% down · 12.0% · 12mo
- Down + closing
- —
- Monthly P&I
- —
- Monthly cashflow
- —
- DSCR
- —
- Eligible?
- —
Short-term bridge; refi at stabilization.
Rent comps 2 comps
| Address | Beds | Baths | Sqft | Rent | $/sqft | DOM | Units | Dist |
|---|---|---|---|---|---|---|---|---|
| 4500 Kentsfield Ln Columbia, MO | 1.0–3.0 | 1.0–2.0 | 1238 | $1,988 | $1.60 | 13d | 105 | 0.88mi |
| 4005 Ledger DR Columbia, MO | 1.0–2.0 | 1.0–2.0 | 914 | $1,900 | $2.08 | 13d | 40 | 1.42mi |
Listing history 3 events
-
2026-04-24status Pending
-
2026-04-23$925,000 Active
-
2020-10-23soldstatus 95-char remark
Show marketing remark (95 chars)
9 1BR units at $480/mo and 3 2BR units at $580/mo for 12 total units. Well maintained building.
ⓘ Source: listings_history table (triggers on properties + properties_extension) + one-shot
backfill from property_details.listing_events for pre-trigger history.
Nearby sold comps map
Loading sold comps map…
Walkable amenities ~0.75 mi
Loading nearby amenities…
Taxation est. · year 1
- Rental income
- $197,232
- − Mortgage interest
- −$51,814
- − Property taxes
- −$13,875
- − Insurance
- −$4,625
- − Repairs & maintenance
- −$15,779
- − Management
- −$15,779
- − Depreciation
- −$26,909
- Taxable income
- $68,451
- Est. tax owed @ 24.0%
- −$16,428
- After-tax cash flow
- $62,675/yr
For passive investors: Depreciation is non-cash, so a rental often shows a tax loss while cash-flowing — sheltering income. Rental losses are passive: they offset passive income freely, and up to $25,000/yr can offset ordinary (W-2) income if you actively participate and your MAGI is under $100k (phasing out to $0 by $150k); unused losses carry forward. On sale, claimed depreciation is recaptured at up to 25%, and gains may owe capital-gains tax (a 1031 exchange can defer both). Figures are a year-1 estimate at your 24.0% rate — not tax advice; consult a CPA.
Condition & rehab AI · 2 photos
This 12-unit apartment building requires extensive repairs and maintenance, including painting, roof repair, landscaping, and fencing. Immediate action is needed to improve the property's condition and value.
Repairs flagged
- Major exterior paint — Significant chipping and fading
- Major roof — Condition unknown, but weathered appearance suggests potential issues
- Major landscaping — Overgrown and unkempt
- Major fencing — Visible rust and damage
Value-add opportunities
- Both paint exterior — Fresh paint would improve curb appeal and property value
- Both repair roof — A new roof would significantly increase the property's value
- Both landscape — A well-maintained landscape would enhance curb appeal and attract tenants
- Both repair fencing — A sturdy and attractive fence would improve property value and security
Renovation cost estimate screening
| Repair item | Severity | Est. cost |
|---|---|---|
| exterior paint · Significant chipping and fading | Major | $15,000–50,000 |
| roof · Condition unknown, but weathered appearance suggests potential issues | Major | $15,000–50,000 |
| landscaping · Overgrown and unkempt | Major | $15,000–50,000 |
| fencing · Visible rust and damage | Major | $15,000–50,000 |
| Total estimated repair cost · 4 items | $60,000–200,000 |
Value-add ROI direction
- Both paint exterior — Fresh paint would improve curb appeal and property value ↑
- Both repair roof — A new roof would significantly increase the property's value ↑
- Both landscape — A well-maintained landscape would enhance curb appeal and attract tenants ↑
- Both repair fencing — A sturdy and attractive fence would improve property value and security ↑
ⓘ Cost ranges are severity-bucket heuristics (US national rule-of-thumb). Get contractor quotes + a written scope before underwriting a rehab budget.
Schools (NCES district)
- District
- Columbia 93
- NCES district ID
- 2901000
- Math proficiency
- 30% ▼ -12.00%
- Reading proficiency
- 43% ▼ -4.00%
- Median HH income
- $46,547
- Composite
- 31.21/100
- National rank
- #6036
- State rank
- #194 of 324 in MO
Livability — Columbia
- Score
- 83/100
- State rank
- #9
- US rank
- #862
Category grades
Schools grade is shown separately in the Schools card above.
Census & demographics
- County
- Boone County · 158,877 people
- City population
- 158,877
- Metro
- Columbia, MO
- Population (ZIP)
- 50,011
- Household income
- $48,113
- Rent vs Own
- Severe rent burden
- 4323.0
Population outlook (Boone County) Hauer SSP2
- Today (2025)
- 202,891 people
- By 2030
- 217,799 · +7.3%
- By 2040
- 246,789 · +21.6%
- By 2050
- 276,116 · +36.1%
- By 2075
- 348,426 · +71.7%
- By 2100
- 400,856 · +97.6%
Race, ethnicity, and origin ACS 2023
- Neighborhood character
- Predominantly White (74%)
- Race & ethnicity
- White 74% Black 8% Two or more races 7% Asian 7% Hispanic / Latino 6%
- Hispanic origin (detail)
- Mexican 5%
- Common ancestry
- Slovak 2% Italian 2% Romanian 2%
- Foreign-born
- 9% · China, Canada, Vietnam
- Languages at home
- 88% English-only · Spanish 4% Chinese 2% Other Indo-European 2%
Political lean MEDSL · Boone
- 2024 margin
- Lean D (+9.8) · D 53.9% · R 44.1% · Other 2.1%
- 2008→2024 swing
- -2.2pp toward R · 2008: 12.0pp · 2024: 9.8pp
- All cycles
- 2024: D+9.8 2020: D+12.5 2016: D+5.9 2012: D+3.1 2008: D+12.0
Not yet ingested
- Civics
- —
Market trends
- HPI YoY
- ▼ -170.32%
- Current HPI
- 195.2059
- Rent YoY
- ▲ 10.33%
- Metro
- Columbia, MO
- State GDP YoY
- ▲ 1.84%
- F500 in state
- 20
Industry mix (Fortune 500 HQ in MO)
| Industry | F500 HQs | Revenue |
|---|---|---|
| Healthcare | 1 | $163B |
|
||
| Insurance | 1 | $21B |
|
||
| Industrial Technology | 1 | $17B |
|
||
| Retail | 1 | $16B |
|
||
| Industrial Distribution | 1 | $10B |
|
||
| Utilities | 1 | $9B |
|
||
Price history
3 events — show timeline
- 2026-04-24 Pending — CBORMLS
- 2026-04-23 Listed $925,000 CBORMLS
- 2020-10-23 Sold (MLS) — CBORMLS
Cash-flow waterfall
monthlySold comps — $/sqft
last 12 mo · ≤1 miLoading sold comps…