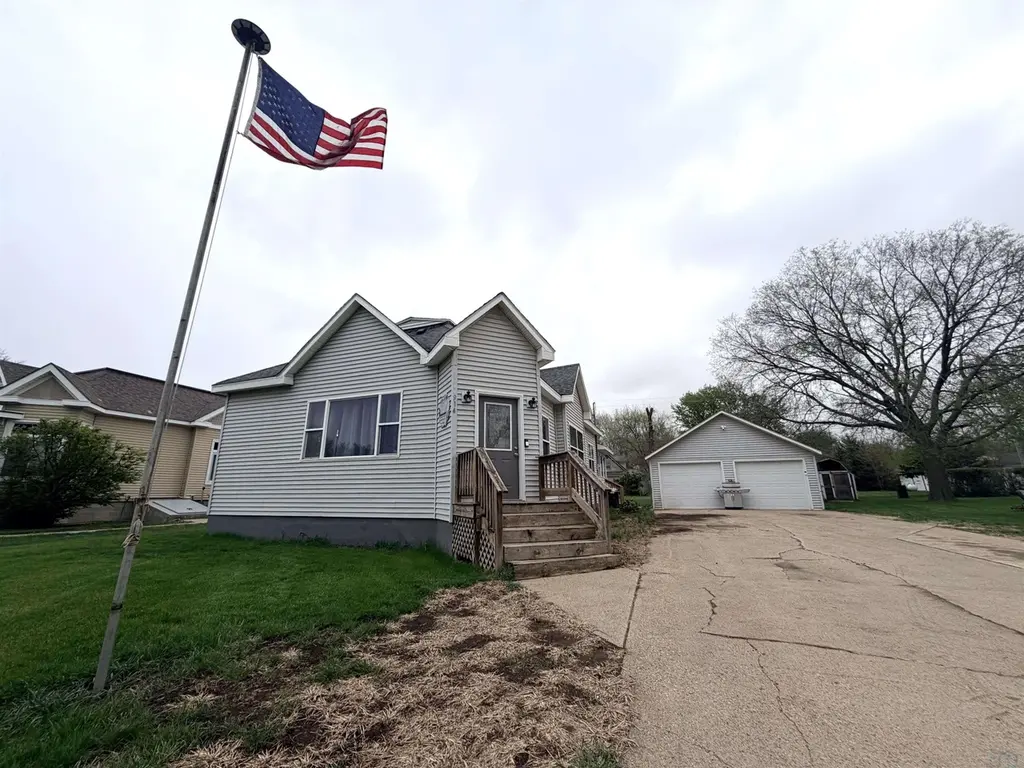
914 Driftwood St · Correctionville, IA
Flood risk 1/10 · Minimal
- FEMA flood zone
- X (unshaded)
- Chance of flooding over 30 yrs
- 0.0%
- Est. flood insurance / yr
- $473 – $860
Fire risk 1/10 · Minimal
- Est. fire insurance / yr
- $902 – $1,676
Heat risk 3/10 · Minor
- Hot days now (above 102°F)
- 7 days/yr
- Hot days in 30 yrs
- 15 days/yr
Wind risk 2/10 · Minimal
- Chance of severe wind over 30 yrs
- —
Air-quality risk 1/10 · Minimal
- Unhealthy air days now
- 0 days/yr
- Unhealthy air days in 30 yrs
- 0 days/yr
Risk factors via First Street. Map © Google.
Why this score? — see what drove the D+ grade
The composite is a weighted blend of 9 inputs, each scored 0–100. Each bar is that input's sub-score; the figure is the points it added to the 100-point composite (weight × sub-score).
- Cash flow +13.5/30.0
- Appreciation +6.8/10.0
- ARV discount +6.5/15.0
- Schools +5.2/10.0
- DSCR +4.1/10.0
- 1% rule +3.8/10.0
- Livability +3.3/5.0
- Rent growth +2.5/5.0
- Condition / age +2.5/5.0
$125,000
🖨 Deal sheet (PDF) 📄 Offer letter ✓ Due diligence
Listing remarks
Small Town Living at Its Finest! Welcome to 914 Driftwood St — a charming single-family bungalow nestled in the heart of Correctionville, IA. Offering 1,349 sq ft of living space on a generous 9,450 sq ft lot, this 2-bedroom, 1-bathroom home perfectly captures the warmth and simplicity of small-town life — ideal for anyone craving a slower pace without sacrificing comfort. Inside, you'll find a functional bungalow layout with recently updated windows throughout the main living areas, bringing in abundant natural light and improved energy efficiency. The unfinished basement offers endless potential — whether you need extra storage, a workshop, or dream of creating additiona
Key facts
- Off street parking
- Unfinished basement
- Large backyard
Tags
Property features AI
Finance
- Other: Lot size approximately 0.22 acres
- Financial info: Financial details not provided
- HOA & community: HOA information not provided
Exterior
- Parking: Detached oversized concrete garage with 2 spaces; Garage door opener
- Security: Smoke detectors
- Utilities: Public water; Public sewer
- Home design: Residential single-family property
- Construction: Vinyl siding; Shingle roof; Basement: full, unfinished
- Exterior features: Front porch; In-ground pool; Level lot with a few trees
Interior
- Kitchen: Kitchen appliances not specifically listed
- Bedrooms: Bedrooms information not provided
- Flooring: Flooring information not provided
- Bathrooms: 1 full bathroom
- Heating & cooling: Forced air heating; Heating available via propane and natural gas; Wood heating option; Window air conditioning units
- Interior features: Built-in features; Water softener
- Laundry & utility: Main-level laundry; Full unfinished basement (utility/storage space)
Neighborhood map
What this means for you Summary
Snapshot
- This is a 2-bed/1.0-bath single-family listed at $125k.
Deal economics
- At list price, monthly cash flow is $5 ($66/yr) — positive.
- The deal already cash-flows at list — no discount required.
- To meet the 1% rule (rent ≥ 1% of price), the offer needs to be $110k (11.6% below list).
- Recommended offer: $110k (11.6% below list) — sets the bar for 1% rule.
Location & tenants
- Location reads 66/100 on livability (#528 in IA) — a middle-class / working-renter tenant base. Strengths: cost of living A+, housing A+; Watch: employment D+, health & safety D, amenities F.
- River Valley Community School District (rural): math 60% / reading 63% proficiency, ranked #238 of 289 in IA (top 82%) — acceptable for families but not a draw, mixed tenant base, ~2y average lease.
- Zoned schools: River Valley Elementary (math 62% / reading 52%, grade C+, #436 of 616 statewide, top 74%, 174 students, 60% FRL); River Valley Junior- Senior High School (math 62% / reading 67%, grade B-, #211 of 336 statewide, top 70%, 168 students, 54% FRL) — zoned schools average 57% FRL vs 34% district-wide (24 pts higher); higher-poverty schools than district average — tighter screening recommended.
- Market conditions: 15 active listings in the ZIP; 170 units permitted in Woodbury County in 2024 (90 in 5+ unit buildings).
Forward outlook
- In year one you build about $5k of equity ($864 loan paydown + $5k appreciation (3.6% local appreciation)).
- At projected returns (3.6% appreciation + 3.0% rent growth), your $35k cash investment doubles in ~6 years — after that, you're playing with house money.
- By year 7, paydown + projected appreciation supports a ~$34k cash-out refi (75% LTV) — recoverable capital for the next deal without selling this one.
Negotiation context
- It's been on market 52 days — a 3% lower offer ($121k) is reasonable based on typical stale-listing flexibility.
- Current owner paid $49k; list at $125k implies a 155% gain — meaningful room to come down on a strong offer.
Risks & watch-outs
- Watch-outs: built in 1900 — expect roof / HVAC / electrical / plumbing capex.
Questions for the listing agent
- It's been on market 52 days. Have you received any prior offers? Is the seller open to a 12% concession, seller financing, or rate buy-down credit?
- Built in 1900 — when were the roof, HVAC, electrical panel, plumbing, and water heater last replaced?
- Is there a deadline driving the sale (1031 exchange, divorce, estate, relocation)? That informs how much negotiation room exists.
- Schools are B-rated — typically a magnet for longer-tenancy family renters. What's the average tenant stay here, and is there a school-zone premium baked into asking?
- The area grade is low — what's the realistic commute time and amenity access for the typical tenant pool here? Any planned neighborhood developments (good or bad) we should know about?
- What's the average days-on-market for RENTAL listings here right now (not sales)? A rising rental-DOM trend means longer vacancies and softer asking-rent achievability than the comps imply.
- What's the recent tenant-quality profile in this submarket — average credit score on applications, eviction rate, late-payment / NSF rate, and stable-employment percentage? A property-management company in the area should have these aggregated.
- How much new for-sale + rental construction is in the pipeline within 1–3 miles? Heavy new supply typically softens prices + rents 12–24 months out; constrained supply supports both.
Investment metrics
- 1% rule
- 0.88% ✗
- Cap rate
- 6.35%
- Cash-on-cash
- 0.19%
- DSCR
- 1.01
- GRM
- 9.4
CMA / ARV
- ARV (median comp)
- $122,281
- List price
- $125,000
- Delta
- 2.22%
- Verdict
- FAIR
- Comps
- 14 within 1.0 mi
Show comp detail 4 sales within ~0.75 mi
| Address | Dist | Beds/Ba | Sqft | Sold | Price | $/sf | Match |
|---|---|---|---|---|---|---|---|
| 925 Elm St | 0.04mi | 2/1.0 | 1,408 (+4%) | 1mo | $56,000 | $40 | 90 |
| 306 Haven Ave | 0.12mi | 2/1.0 | 1,288 (-4%) | 17mo | $136,000 | $106 | 72 |
| 617 Birch St | 0.29mi | 2/1.0 | 1,184 (-12%) | 0mo | $160,000 | $135 | 66 |
| 4161 150th St | 0.73mi | 3/2.5 (+1) | 1,494 (+11%) | 24mo | $445,000 | $298 | 17 |
Match score weights: distance 35% · size 25% · config 20% · recency 20%. Top-matched comps best support the ARV.
Projected returns pro-forma
3.61% appreciation · 3.0% rent growth · sell at horizon
- IRR
- 9.4%
- Equity multiple
- 1.56×
- Total profit
- $19,480
- Equity at exit
- $60,517
- IRR
- 11.5%
- Equity multiple
- 2.83×
- Total profit
- $64,009
- Equity at exit
- $96,765
Cash invested: $35,000 (down + closing). Projections, not guarantees.
Landlord ↔ Tenant lean methodology
- Overall (STATE)
- 83 Strongly Landlord-Friendly
- State Iowa
- 83 Strongly Landlord-Friendly · R+6
- County
- — inherits STATE
- City
- — inherits STATE
ZIP-level market 51016
- Home prices YoY
- 1.7%
- Active inventory
- 15
- Price-to-rent
- 9.4×
Monthly cashflow live
- Estimated rent
- $1,105 medium interval (Pro) →
- Mortgage (P&I)
- −$656
- Tax from tax record
- −$160 /mo · $1,914/yr
- Insurance
- −$52
- HOA
- −$0
- Vacancy / Maint / Mgmt
- −$232
- Net cashflow
- $5
Break-even live
Sensitivity live
| Price | -10% $76 | -5% $41 | +0% $5 | +5% $-30 | +10% $-65 |
|---|---|---|---|---|---|
| Rent | -10% $-82 | -5% $-38 | +0% $5 | +5% $49 | +10% $93 |
| Rate | -1.0pp $68 | -0.5pp $37 | base $5 | +0.5pp $-27 | +1.0pp $-60 |
UW: 25.0% down · 7.5% · 30yr · 1.5% tax · 5.0% vac · 8.0% maint · 8.0% mgmt
Financing live
Cash to close
- Down payment
- $31,250
- Closing costs
- $3,750
- Reserves months
- —
- Total cash needed
- —
Loan-product check · same deal, 3 products live
Conventional
25% down · 7.5% · 30yr
- Down + closing
- —
- Monthly P&I
- —
- Monthly cashflow
- —
- DSCR
- —
- Eligible?
- —
Personal DTI + credit; lowest rate.
DSCR
20% down · 8.5% · 30yr
- Down + closing
- —
- Monthly P&I
- —
- Monthly cashflow
- —
- DSCR
- —
- Eligible?
- —
No personal income docs; deal must DSCR.
Hard money
10% down · 12.0% · 12mo
- Down + closing
- —
- Monthly P&I
- —
- Monthly cashflow
- —
- DSCR
- —
- Eligible?
- —
Short-term bridge; refi at stabilization.
Listing history 20 events
-
2026-06-21days on market $125,000 Active 52 DOM
-
2026-06-21days on market $125,000 Active 51 DOM
-
2026-06-18days on market $125,000 Active 49 DOM
-
2026-06-17price $125,000 Active 48 DOM
-
2026-06-17days on market $130,000 Active 48 DOM
-
2026-06-16days on market $130,000 Active 47 DOM
-
2026-06-15days on market $130,000 Active 46 DOM
-
2026-06-13days on market $130,000 Active 44 DOM
-
2026-06-12days on market $130,000 Active 43 DOM
-
2026-06-09days on market $130,000 Active 40 DOM
-
2026-06-08days on market $130,000 Active 39 DOM
-
2026-06-07days on market $130,000 Active 38 DOM
-
2026-06-05days on market $130,000 Active 36 DOM
-
2026-06-04days on market $130,000 Active 34 DOM
-
2026-06-02days on market $130,000 Active 33 DOM
-
2026-06-01days on market $130,000 Active 32 DOM
-
2026-05-31days on market $130,000 Active 31 DOM
-
2026-05-31days on market $130,000 Active 30 DOM
-
2026-04-30$130,000 Active 1134-char remark
-
2022-10-27soldstatus $49,000
ⓘ Source: listings_history table (triggers on properties + properties_extension) + one-shot
backfill from property_details.listing_events for pre-trigger history.
Tax reassessment forecast IA · Partial reset (capped growth)
- Current annual tax
- $1,914 · $160/mo
- Projected year-2 tax
- $1,938 · $162/mo
- Expected delta
- +$24/yr (+$2/mo · 1.3%)
ⓘ Screening estimate from a state-policy table — verify with the county assessor before closing.
Climate risk First Street
- Flood 1/10 Low FEMA zone X (unshaded) · 0% chance over 30 yrs
- Wildfire 1/10 Low
- Heat 3/10 Moderate 7 d/yr ≥102°F today · 15 d/yr by 30 yrs out
- Wind 2/10 Low
- Air quality 1/10 Low 0 unhealthy d/yr today · 0 by 30 yrs out
Nearby sold comps map
Loading sold comps map…
Walkable amenities ~0.75 mi
Loading nearby amenities…
Taxation est. · year 1
- Rental income
- $13,254
- − Mortgage interest
- −$7,002
- − Property taxes
- −$1,914
- − Insurance
- −$625
- − Repairs & maintenance
- −$1,060
- − Management
- −$1,060
- − Depreciation
- −$3,636
- Taxable loss
- −$2,044
- Est. tax savings @ 24.0%
- +$490
- After-tax cash flow
- $556/yr
For passive investors: Depreciation is non-cash, so a rental often shows a tax loss while cash-flowing — sheltering income. Rental losses are passive: they offset passive income freely, and up to $25,000/yr can offset ordinary (W-2) income if you actively participate and your MAGI is under $100k (phasing out to $0 by $150k); unused losses carry forward. On sale, claimed depreciation is recaptured at up to 25%, and gains may owe capital-gains tax (a 1031 exchange can defer both). Figures are a year-1 estimate at your 24.0% rate — not tax advice; consult a CPA.
Schools (NCES district)
- District
- River Valley Community School District
- NCES district ID
- 1910340
- Math proficiency
- 60% ▼ -5.00%
- Reading proficiency
- 63% ▼ -2.00%
- Median HH income
- $43,677
- Composite
- 51.71/100
- National rank
- #1686
- State rank
- #238 of 289 in IA
Livability — Correctionville
- Score
- 66/100
- State rank
- #528
- US rank
- #11786
Category grades
Schools grade is shown separately in the Schools card above.
Census & demographics
- Census place
- Correctionville, IA
- Population (ZIP)
- 1,095
Population outlook (Woodbury County) Hauer SSP2
- Today (2025)
- 103,226 people
- By 2030
- 103,060 · -0.2%
- By 2040
- 102,533 · -0.7%
- By 2050
- 102,788 · -0.4%
- By 2075
- 107,227 · +3.9%
- By 2100
- 113,980 · +10.4%
Race, ethnicity, and origin ACS 2023
- Neighborhood character
- Predominantly White (83%)
- Race & ethnicity
- White 83% Two or more races 16% Hispanic / Latino 15%
- Hispanic origin (detail)
- Mexican 14%
- Common ancestry
- Romanian 3% Lithuanian 2% Portuguese 1%
- Foreign-born
- 3% · Canada
- Languages at home
- 84% English-only · Spanish 14% German/W. Germanic 1%
Political lean MEDSL · Woodbury
- 2024 margin
- Strong R (+23.0) · D 37.8% · R 60.9% · Other 1.3%
- 2008→2024 swing
- -22.5pp toward R · 2008: -0.5pp · 2024: -23.0pp
- All cycles
- 2024: R+23.0 2020: R+15.5 2016: R+19.9 2012: R+0.2 2008: R+0.5
Not yet ingested
- Civics
- —
Market trends
- HPI YoY
- ▲ 3.61%
- Current HPI
- 215.7251
- Rent YoY
- —
- Metro
- —
- State GDP YoY
- ▲ 2.48%
- F500 in state
- 4
Industry mix (Fortune 500 HQ in IA)
| Industry | F500 HQs | Revenue |
|---|---|---|
| Financial Services | 1 | $16B |
|
||
| Retail / Convenience | 1 | $15B |
|
||
Price history
+155.1% since first listed3 events — show timeline
- 2026-06-17 Price Changed $125,000 NWIA
- 2026-04-30 Listed $130,000 NWIA
- 2022-10-27 Sold (Public Records) $49,000 Public Records
Property tax history
+6.0%/yrLatest (2025): $1,914 · +3.9% YoY. Source: county tax records.
Cash-flow waterfall
monthlySold comps — $/sqft
last 12 mo · ≤1 miLoading sold comps…