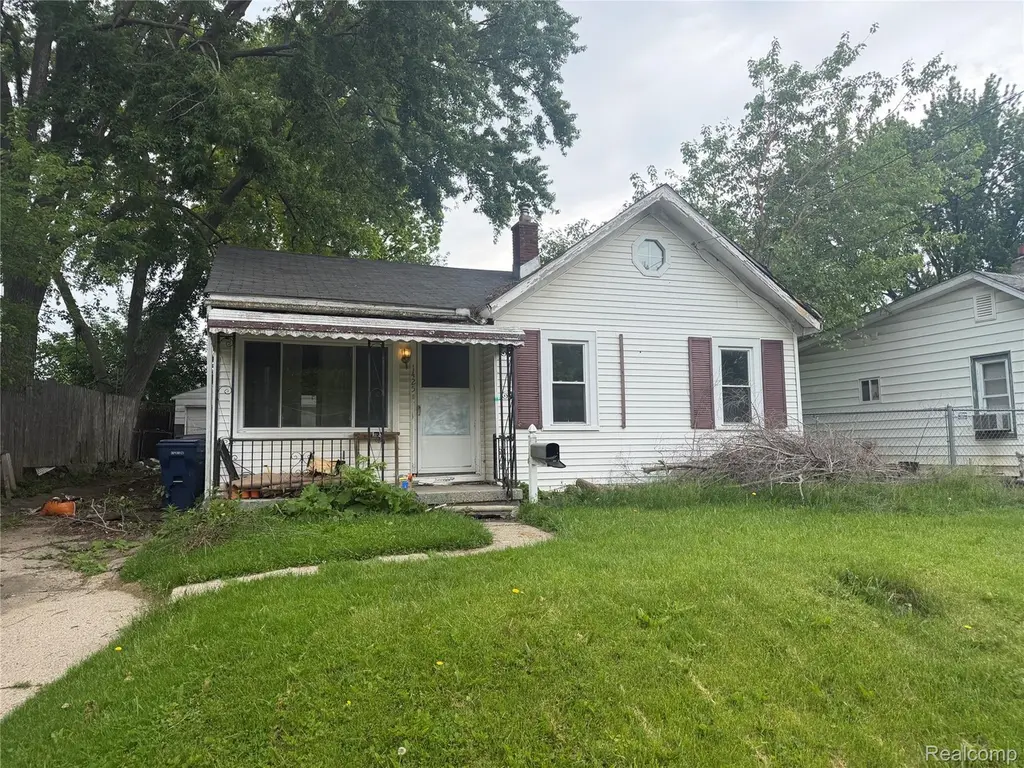
1425 Knight Ave · Flint, MI
Flood risk 1/10 · Minimal
- FEMA flood zone
- X (unshaded)
- Chance of flooding over 30 yrs
- 0.0%
- Est. flood insurance / yr
- $473 – $860
Fire risk 1/10 · Minimal
- Est. fire insurance / yr
- $784 – $1,456
Heat risk 2/10 · Minimal
- Hot days now (above 96°F)
- 7 days/yr
- Hot days in 30 yrs
- 15 days/yr
Wind risk 2/10 · Minimal
- Chance of severe wind over 30 yrs
- —
Air-quality risk 3/10 · Minor
- Unhealthy air days now
- 3 days/yr
- Unhealthy air days in 30 yrs
- 4 days/yr
Risk factors via First Street. Map © Google.
Why this score? — see what drove the B- grade
The composite is a weighted blend of 9 inputs, each scored 0–100. Each bar is that input's sub-score; the figure is the points it added to the 100-point composite (weight × sub-score).
- Cash flow +30.0/30.0
- 1% rule +10.0/10.0
- DSCR +10.0/10.0
- ARV discount +5.6/15.0
- Rent growth +5.0/5.0
- Livability +3.7/5.0
- Condition / age +2.5/5.0
- Schools +1.1/10.0
- Appreciation +0.0/10.0
$53,500
🖨 Deal sheet 📄 Offer letter ✓ Due diligence
Listing remarks MLS
Investor special, comps in the area are in the $80-100k+ price range. All Utilities work, home has good bones. Needs to be heavily cleaned and redone. Home is sold AS IS and Cash only. There is a piece of roof that is damaged from a tree that would need to be fixed for Conv lending if a buyer wants to do at their cost for lending MISSING STEP GOING TO BASEMENT at bottom of stairs. Agent owned
Key facts
- 4,792 sq ft lot
- 2 garage spots
- Built 1929
Property features AI
Exterior
- Parking: Detached garage (2.5 car)
- Utilities: Public water; Public sewer
- Home design: Single-family residence; One level; Ground-level entry with steps
- Construction: Vinyl siding; Brick/mortar foundation; Asphalt roof; Built as residential single-family
- Exterior features: Awning(s); Balcony; Covered porch
Interior
- Kitchen: Free-standing electric range; Free-standing refrigerator
- Bathrooms: 1 full bathroom
- Heating & cooling: Forced air heating (natural gas); No central cooling
- Interior features: Free-standing electric range; Free-standing refrigerator; Unfinished basement with sump pump; Basement present
Neighborhood map
What this means for you Summary
Snapshot
- This is a 3-bed/1.0-bath single-family listed at $54k.
Deal economics
- At list price, monthly cash flow is $497 ($6k/yr) — positive.
- The deal already cash-flows at list — no discount required.
- Meets the 1% rule at list price ($1k rent vs $54k).
- Recommended offer: $53k (1.5% below list) — sets the bar for market timing.
- Cap rate 17.4% vs local median 11.5% in Flint — top-decile yield for the area; either an underpriced asset or a hidden risk that comps aren't pricing in. Stress-test before assuming the spread holds.
Location & tenants
- Location reads 74/100 on livability (#196 in MI, #4,946 nationally) — a middle-class / working-renter tenant base. Strengths: commute A+, cost of living A+, housing A+; Watch: schools F, crime F, employment F.
- Flint School District (urban): math 7% / reading 13% proficiency, ranked #714 of 760 in MI (top 94%) — low school quality limits family demand, transient renter base, plan for 1-2y turnover; 83% free/reduced lunch — lower-income household profile, screen leases tightly.
- Market conditions: Rents rising fast (+12.3%/yr); 135 active listings in the ZIP; 6 comparable units currently listed for rent nearby; rentals at typical pace (median 21d on market — plan ~3-4 weeks tenant-placement turnaround); lower-income renter base — watch delinquency; 419 units permitted in Genesee County in 2024 (68 in 5+ unit buildings).
- This rent runs 31% of the median local income ($44k/yr) — at the standard rent-burdened threshold; future hikes will face affordability resistance.
Forward outlook
- Local home prices are declining (-3.0%/yr); year-one equity from $370 of loan paydown is wiped out by about $2k of value loss. Plan a longer hold.
- Genesee County population projected at -27% by 2050 — secular population decline; favor cash flow + early exit over multi-decade hold.
- At projected returns (-3.0% appreciation + 8.0% rent growth), your $15k cash investment doubles in ~3 years — after that, you're playing with house money.
Negotiation context
- It's been on market 15 days — a 2% lower offer ($53k) is reasonable based on typical stale-listing flexibility.
- 15 sale attempts since 28y ago with the ask held roughly flat each time — persistent listings suggest the price (not the market) is what's stuck; bring a comps-based counter.
- Current owner paid $4k; list at $54k implies a 1429% gain — meaningful room to come down on a strong offer.
Risks & watch-outs
- Watch-outs: built in 1929 — expect roof / HVAC / electrical / plumbing capex.
Questions for the listing agent
- Built in 1929 — when were the roof, HVAC, electrical panel, plumbing, and water heater last replaced?
- Is there a deadline driving the sale (1031 exchange, divorce, estate, relocation)? That informs how much negotiation room exists.
- Schools are F-rated, which usually means shorter tenancies and higher turnover. Who's the typical renter profile here, and what's been the actual vacancy rate?
- Crime grade is F in this area — have there been break-ins, vandalism, or insurance claims at this property in the last 3 years? What carrier currently insures it and at what premium?
- What's the average days-on-market for RENTAL listings here right now (not sales)? A rising rental-DOM trend means longer vacancies and softer asking-rent achievability than the comps imply.
- What's the recent tenant-quality profile in this submarket — average credit score on applications, eviction rate, late-payment / NSF rate, and stable-employment percentage? A property-management company in the area should have these aggregated.
- How much new for-sale + rental construction is in the pipeline within 1–3 miles? Heavy new supply typically softens prices + rents 12–24 months out; constrained supply supports both.
Investment metrics
- 1% rule
- 2.13% ✓
- Cap rate
- 17.45%
- Cash-on-cash
- 39.83%
- DSCR
- 2.77
- GRM
- 3.9
CMA / ARV
- ARV (on-the-fly)
- $51,354
- Comps found
- 12
Show comp detail 12 sales within ~0.75 mi
| Address | Dist | Beds/Ba | Sqft | Sold | Price | $/sf | Match |
|---|---|---|---|---|---|---|---|
| 2729 Chicago Blvd | 0.15mi | 3/1.0 | 895 (-6%) | 2mo | $88,000 | $98 | 82 |
| 3205 Clairmont St | 0.24mi | 3/1.0 | 888 (-7%) | 3mo | $42,000 | $47 | 75 |
| 3018 Fielding St | 0.37mi | 3/1.0 | 993 (+4%) | 1mo | $21,000 | $21 | 75 |
| 1114 Clancy Ave | 0.19mi | 2/1.0 (-1) | 1,009 (+6%) | 3mo | $36,000 | $36 | 73 |
| 2810 Gibson St | 0.34mi | 3/1.0 | 892 (-6%) | 1mo | $15,500 | $17 | 73 |
| 924 Hammond Ave | 0.49mi | 3/1.0 | 948 (-0%) | 5mo | $51,000 | $54 | 73 |
| 1205 Stocker Ave | 0.23mi | 3/1.5 | 1,024 (+8%) | 5mo | $55,000 | $54 | 70 |
| 3801 Augusta St | 0.54mi | 2/1.0 (-1) | 949 (-0%) | 3mo | $63,000 | $66 | 67 |
| 2429 Brown St | 0.46mi | 2/1.0 (-1) | 933 (-2%) | 4mo | $8,500 | $9 | 67 |
| 2621 Swayze St | 0.28mi | 2/1.0 (-1) | 1,043 (+10%) | 3mo | $76,950 | $74 | 63 |
| 1115 Barney Ave | 0.33mi | 3/1.0 | 833 (-12%) | 5mo | $43,500 | $52 | 60 |
| 2210 Brown St | 0.60mi | 2/1.0 (-1) | 816 (-14%) | 1mo | $49,900 | $61 | 43 |
Match score weights: distance 35% · size 25% · config 20% · recency 20%. Top-matched comps best support the ARV.
Projected returns pro-forma
-3.0% appreciation · 8.0% rent growth · sell at horizon
- IRR
- 42.0%
- Equity multiple
- 2.94×
- Total profit
- $29,064
- Equity at exit
- $7,977
- IRR
- 50.5%
- Equity multiple
- 7.25×
- Total profit
- $93,673
- Equity at exit
- $4,626
Cash invested: $14,980 (down + closing). Projections, not guarantees.
Landlord ↔ Tenant lean methodology
- Overall (STATE)
- 62 Landlord-Friendly
- State Michigan
- 62 Landlord-Friendly · EVEN
- County
- — inherits STATE
- City
- — inherits STATE
ZIP-level market 48503
- Home prices YoY
- -27.7%
- Rents YoY
- 12.3%
- Active inventory
- 135
- Price-to-rent
- 3.9×
Monthly cashflow live
- Estimated rent
- $1,140 high interval (Pro) →
- Mortgage (P&I)
- −$281
- Tax from tax record
- −$101 /mo · $1,211/yr
- Insurance
- −$22
- HOA
- −$0
- Vacancy / Maint / Mgmt
- −$239
- Net cashflow
- $497
Break-even live
UW: 25.0% down · 7.5% · 30yr · 1.5% tax · 5.0% vac · 8.0% maint · 8.0% mgmt
Financing live
Cash to close
- Down payment
- $13,375
- Closing costs
- $1,605
- Reserves months
- —
- Total cash needed
- —
Loan-product check · same deal, 3 products live
Conventional
25% down · 7.5% · 30yr
- Down + closing
- —
- Monthly P&I
- —
- Monthly cashflow
- —
- DSCR
- —
- Eligible?
- —
Personal DTI + credit; lowest rate.
DSCR
20% down · 8.5% · 30yr
- Down + closing
- —
- Monthly P&I
- —
- Monthly cashflow
- —
- DSCR
- —
- Eligible?
- —
No personal income docs; deal must DSCR.
Hard money
10% down · 12.0% · 12mo
- Down + closing
- —
- Monthly P&I
- —
- Monthly cashflow
- —
- DSCR
- —
- Eligible?
- —
Short-term bridge; refi at stabilization.
Rent comps 6 comps
| Address | Beds | Baths | Sqft | Rent | $/sqft | DOM | Units | Dist |
|---|---|---|---|---|---|---|---|---|
| 3701 Whitney Ave Flint, MI | 2.0 | 1.0 | 850 | $900 | $1.06 | 13d | 1 | 0.44mi |
| 3901 Herrick St Flint, MI | 3.0 | 1.5 | 1100 | $1,300 | $1.18 | 13d | 1 | 0.55mi |
| 3929 Larchmont St Flint, MI | 2.0 | 1.0 | 900 | $1,100 | $1.22 | 13d | 1 | 0.62mi |
| 806 Barney Ave Flint, MI | 2.0 | 1.0 | 1000 | $1,000 | $1.00 | 20d | 1 | 0.65mi |
| 314 Sheffield Ave Flint, MI | 2.0 | 1.0 | 896 | $1,250 | $1.40 | 20d | 1 | 0.92mi |
| 1426 Pettibone Ave Flint, MI | 2.0 | 1.0 | 750 | $900 | $1.20 | 20d | 1 | 1.47mi |
Listing history 44 events
-
2026-06-18remarks 431-char remark
-
2026-06-18pricestatus $53,500 Active 15 DOM
-
2026-06-13pricestatusdays on market $54,000 Pending 15 DOM
-
2026-06-10days on market $54,500 Active 14 DOM
-
2026-06-09days on market $54,500 Active 13 DOM
-
2026-06-08days on market $54,500 Active 12 DOM
-
2026-06-07pricedays on market $54,500 Active 11 DOM
-
2026-06-05days on market $54,999 Active 8 DOM
-
2026-06-03days on market $54,999 Active 7 DOM
-
2026-06-03price $54,999 Active 6 DOM
-
2026-06-02days on market $55,000 Active 6 DOM
-
2026-06-01days on market $55,000 Active 5 DOM
-
2026-05-31days on market $55,000 Active 4 DOM
-
2026-05-30days on market $55,000 Active 3 DOM
-
2026-05-28$55,000 Active
-
2026-05-27$55,000 Active 395-char remark
Show marketing remark (395 chars)
Investor special, comps in the area are in the $80-100k+ price range. All Utilities work, home has good bones. Needs to be heavily cleaned and redone. Home is sold AS IS and Cash only. There is a piece of roof that is damaged from a tree that would need to be fixed for Conv lending if a buyer wants to do at their cost for lending MISSING STEP GOING TO BASEMENT at bottom of stairs. Agent owned
-
2014-10-29soldstatus $3,500 359-char remark
Show marketing remark (359 chars)
Corunna/Miller/Ballenger area - Nice 3 bedroom home with hardwood floors, a full basement, 2 car garage, and more! Go to CitySideCorp.com for bidding info, links to inspection reports, and Lead Based Paint Notices. FHA # 262-152126 - FHA Insurability Code -UI. 203K - Subject to an Appraisal. New homes are added each day! A great opportunity for home buyers!
-
2014-10-29soldstatus $3,500
Show marketing remark (359 chars)
Corunna/Miller/Ballenger area - Nice 3 bedroom home with hardwood floors, a full basement, 2 car garage, and more! Go to CitySideCorp.com for bidding info, links to inspection reports, and Lead Based Paint Notices. FHA # 262-152126 - FHA Insurability Code -UI. 203K - Subject to an Appraisal. New homes are added each day! A great opportunity for home buyers!
-
2014-10-16historical
-
2014-07-07$7,533 359-char remark
Show marketing remark (359 chars)
Corunna/Miller/Ballenger area - Nice 3 bedroom home with hardwood floors, a full basement, 2 car garage, and more! Go to CitySideCorp.com for bidding info, links to inspection reports, and Lead Based Paint Notices. FHA # 262-152126 - FHA Insurability Code -UI. 203K - Subject to an Appraisal. New homes are added each day! A great opportunity for home buyers!
-
2014-07-07$7,533
Show marketing remark (359 chars)
Corunna/Miller/Ballenger area - Nice 3 bedroom home with hardwood floors, a full basement, 2 car garage, and more! Go to CitySideCorp.com for bidding info, links to inspection reports, and Lead Based Paint Notices. FHA # 262-152126 - FHA Insurability Code -UI. 203K - Subject to an Appraisal. New homes are added each day! A great opportunity for home buyers!
-
2010-12-06historical
-
2010-12-06historical
-
2010-12-06historical
-
2010-12-06historical
-
2004-12-06historical
-
2004-08-18$72,000
-
2004-08-18$72,000
-
2003-09-05$64,900
-
2003-09-05$64,900
-
2003-09-05historical
-
2003-07-16$65,000
-
2003-07-16historical
-
2003-07-16$65,000
-
2003-06-08historical
-
2003-06-08historical
-
2002-12-11$69,900
-
2002-12-10$69,900
-
2002-12-10$69,900
-
1999-01-08soldstatus $51,800
-
1999-01-08soldstatus $51,800
-
1998-12-01historical
-
1998-11-09$52,600
-
1998-11-09$52,600
ⓘ Source: listings_history table (triggers on properties + properties_extension) + one-shot
backfill from property_details.listing_events for pre-trigger history.
Tax reassessment forecast MI · Partial reset (capped growth)
- Current annual tax
- $1,211 · $101/mo
- Projected year-2 tax
- $1,211 · $101/mo
- Expected delta
- $0/yr ($0/mo · 0.0%)
ⓘ Screening estimate from a state-policy table — verify with the county assessor before closing.
Climate risk First Street
- Flood 1/10 Low FEMA zone X (unshaded) · 0% chance over 30 yrs
- Wildfire 1/10 Low
- Heat 2/10 Low 7 d/yr ≥96°F today · 15 d/yr by 30 yrs out
- Wind 2/10 Low
- Air quality 3/10 Moderate 3 unhealthy d/yr today · 4 by 30 yrs out
Nearby sold comps map
Loading sold comps map…
Walkable amenities ~0.75 mi
Loading nearby amenities…
Taxation est. · year 1
- Rental income
- $13,686
- − Mortgage interest
- −$2,997
- − Property taxes
- −$1,211
- − Insurance
- −$268
- − Repairs & maintenance
- −$1,095
- − Management
- −$1,095
- − Depreciation
- −$1,556
- Taxable income
- $5,464
- Est. tax owed @ 24.0%
- −$1,311
- After-tax cash flow
- $4,655/yr
For passive investors: Depreciation is non-cash, so a rental often shows a tax loss while cash-flowing — sheltering income. Rental losses are passive: they offset passive income freely, and up to $25,000/yr can offset ordinary (W-2) income if you actively participate and your MAGI is under $100k (phasing out to $0 by $150k); unused losses carry forward. On sale, claimed depreciation is recaptured at up to 25%, and gains may owe capital-gains tax (a 1031 exchange can defer both). Figures are a year-1 estimate at your 24.0% rate — not tax advice; consult a CPA.
Schools (NCES district)
- District
- Flint School District
- NCES district ID
- 2614520
- Math proficiency
- 7% ▬ 0.00%
- Reading proficiency
- 13% ▲ 3.00%
- Median HH income
- $25,954
- Composite
- 10.97/100
- National rank
- #14642
- State rank
- #714 of 760 in MI
Livability — Flint
- Score
- 74/100
- State rank
- #196
- US rank
- #4946
Category grades
Schools grade is shown separately in the Schools card above.
Census & demographics
- Census place
- Flint, MI
- County
- Genesee County · 221,329 people
- City population
- 93,814
- Metro
- Flint, MI
- Population (ZIP)
- 22,347
- Household income
- $44,411
- Rent vs Own
- Severe rent burden
- 1293.0
Population outlook (Genesee County) Hauer SSP2
- Today (2025)
- 381,312 people
- By 2030
- 362,731 · -4.9%
- By 2040
- 321,550 · -15.7%
- By 2050
- 279,212 · -26.8%
- By 2075
- 193,336 · -49.3%
- By 2100
- 128,118 · -66.4%
Race, ethnicity, and origin ACS 2023
- Neighborhood character
- Diverse neighborhood (Simpson 0.56)
- Race & ethnicity
- Black 55% White 36% Two or more races 4% Hispanic / Latino 3%
- Common ancestry
- Romanian 2% Lithuanian 2% Slovak 1%
- Foreign-born
- 5% · China, Canada
- Languages at home
- 93% English-only · Arabic 4% Spanish 1% Chinese 1%
Political lean MEDSL · Genesee
- 2024 margin
- Toss-up / Even · D 51.4% · R 47.2% · Other 1.4%
- 2008→2024 swing
- -28.3pp toward R · 2008: 32.5pp · 2024: 4.2pp
- All cycles
- 2024: D+4.2 2020: D+9.3 2016: D+9.5 2012: D+28.2 2008: D+32.5
Not yet ingested
- Civics
- —
Market trends
- HPI YoY
- ▼ -49.84%
- Current HPI
- 130.1152
- Rent YoY
- ▲ 12.35%
- Metro
- Flint, MI
- State GDP YoY
- ▲ 1.37%
- F500 in state
- 28
Industry mix (Fortune 500 HQ in MI)
| Industry | F500 HQs | Revenue |
|---|---|---|
| Automotive Parts | 3 | $48B |
|
||
| Automotive | 2 | $372B |
|
||
| Chemicals | 1 | $45B |
|
||
| Automotive Retail | 1 | $29B |
|
||
| Healthcare / Medical Devices | 1 | $23B |
|
||
| Automotive Technology | 1 | $20B |
|
||
Price history
+4.6% since first listed30 events — show timeline
- 2026-05-28 Listed $55,000 REALCOMP
- 2026-05-27 Listed $55,000 MiRealSource-MiMLS
- 2014-10-29 Sold (MLS) $3,500 MiRealSource-MiMLS
- 2014-10-29 Sold (MLS) $3,500 REALCOMP
- 2014-10-16 Listing Removed — MiRealSource-MiMLS
- 2014-07-07 Listed $7,533 MiRealSource-MiMLS
- 2014-07-07 Listed $7,533 REALCOMP
- 2010-12-06 Listing Removed — REALCOMP
- 2010-12-06 Listing Removed — REALCOMP
- 2010-12-06 Listing Removed — REALCOMP
- 2010-12-06 Listing Removed — REALCOMP
- 2004-12-06 Listing Removed — MiRealSource-MiMLS
- 2004-08-18 Listed $72,000 MiRealSource-MiMLS
- 2004-08-18 Listed $72,000 REALCOMP
- 2003-09-05 Listing Removed — MiRealSource-MiMLS
- 2003-09-05 Listed $64,900 MiRealSource-MiMLS
- 2003-09-05 Listed $64,900 REALCOMP
- 2003-07-16 Listed $65,000 MiRealSource-MiMLS
- 2003-07-16 Listing Removed — MiRealSource-MiMLS
- 2003-07-16 Listed $65,000 REALCOMP
- 2003-06-08 Listing Removed — MiRealSource-MiMLS
- 2003-06-08 Listing Removed — REALCOMP
- 2002-12-11 Listed $69,900 REALCOMP
- 2002-12-10 Listed $69,900 MiRealSource-MiMLS
- 2002-12-10 Listed $69,900 REALCOMP
- 1999-01-08 Sold (MLS) $51,800 REALCOMP
- 1999-01-08 Sold (MLS) $51,800 MiRealSource-MiMLS
- 1998-12-01 Listing Removed — MiRealSource-MiMLS
- 1998-11-09 Listed $52,600 REALCOMP
- 1998-11-09 Listed $52,600 MiRealSource-MiMLS
Property tax history
+2.5%/yrLatest (2025): $1,211 · +1.7% YoY. Source: county tax records.
Cash-flow waterfall
monthlySold comps — $/sqft
last 12 mo · ≤1 miLoading sold comps…