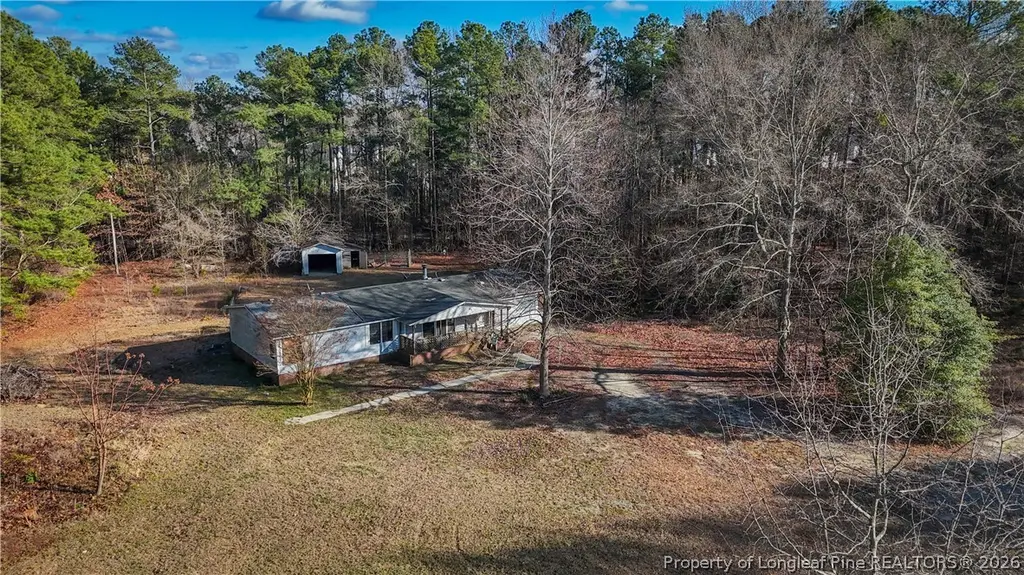
3600 Quarter Horse Run Ln · Hope Mills, NC
Flood risk 1/10 · Minimal
- FEMA flood zone
- X (unshaded)
- Chance of flooding over 30 yrs
- 0.0%
- Est. flood insurance / yr
- $507 – $1,088
Fire risk 7/10 · Major
- Est. fire insurance / yr
- $906 – $1,684
Heat risk 7/10 · Major
- Hot days now (above 106°F)
- 7 days/yr
- Hot days in 30 yrs
- 16 days/yr
Wind risk 7/10 · Major
- Chance of severe wind over 30 yrs
- 78.0%
Air-quality risk 1/10 · Minimal
- Unhealthy air days now
- 0 days/yr
- Unhealthy air days in 30 yrs
- 0 days/yr
Risk factors via First Street. Map © Google.
Why this score? — see what drove the B grade
The composite is a weighted blend of 9 inputs, each scored 0–100. Each bar is that input's sub-score; the figure is the points it added to the 100-point composite (weight × sub-score).
- Cash flow +28.3/30.0
- DSCR +10.0/10.0
- Appreciation +10.0/10.0
- 1% rule +7.5/10.0
- ARV discount +7.5/15.0
- Livability +3.4/5.0
- Schools +3.1/10.0
- Rent growth +2.5/5.0
- Condition / age +1.0/5.0
$115,000
🖨 Deal sheet 📄 Offer letter ✓ Due diligence
Listing remarks MLS
Buy today: Profit for tomorrow! Hidden asset! Great secluded location, near the entrance to US 295 extension. This property is being sold as is and need work, but great upside for the investor or owner occupant. Features 3+ acre lot, over 1800 sq. ft. of living space and so much more. Don't miss out on this great opportunity!
Key facts
- 3.32-acre lot
- Zoned rr
- Existing well
Tags
Property features AI
Exterior
- Parking: No garage
- Utilities: Spring and well water; Septic tank and holding tank sewer
- Home design: Manufactured home; Single-story
- Construction: Vinyl siding
- Exterior features: Level lot; Located on a cul-de-sac
Interior
- Kitchen: Eat-in kitchen
- Flooring: Carpet; Hardwood; Laminate; Tile
- Bathrooms: 2 full bathrooms
- Heating & cooling: Central electric air conditioning
- Interior features: Eat-in kitchen; Factory-built fireplace
Neighborhood map
What this means for you Summary
Snapshot
- This is a 3-bed/3.0-bath manufactured listed at $115k. Condition is rated poor.
Deal economics
- At list price, monthly cash flow is $369 ($4k/yr) — positive.
- The deal already cash-flows at list — no discount required.
- Meets the 1% rule at list price ($1k rent vs $115k).
- Recommended offer: $108k (6.0% below list) — sets the bar for market timing.
- Cap rate 10.1% vs local median 4.8% in Hope Mills — top-decile yield for the area; either an underpriced asset or a hidden risk that comps aren't pricing in. Stress-test before assuming the spread holds.
Location & tenants
- Location reads 67/100 on livability (#234 in NC) — a middle-class / working-renter tenant base. Strengths: cost of living A+, housing A+, health & safety B+; Watch: crime D-, amenities F, commute F.
- Cumberland County Schools (urban): math 32% / reading 41% proficiency, ranked #126 of 178 in NC (top 71%) — families likely to look elsewhere, expect single-tenant / working-renter base with shorter leases.
- Zoned schools: Rockfish Elementary (math 32% / reading 45%, grade F, #750 of 1,410 statewide, top 54%, 696 students, 98% FRL); Hope Mills Middle (math 27% / reading 34%, grade F, #331 of 475 statewide, top 70%, 514 students, 99% FRL); South View High (math 60% / reading 43%, grade D+, #299 of 535 statewide, top 56%, 1,502 students, 66% FRL) — zoned schools average 88% FRL vs 55% district-wide (33 pts higher); higher-poverty schools than district average — tighter screening recommended.
- Market conditions: 44 active listings in the ZIP; 3 comparable units currently listed for rent nearby; rentals at typical pace (median 24d on market — plan ~3-4 weeks tenant-placement turnaround); 1,125 units permitted in Cumberland County in 2024 (104 in 5+ unit buildings).
Forward outlook
- In year one you build about $12k of equity ($795 loan paydown + $12k appreciation (10.0% local appreciation)).
- At projected returns (10.0% appreciation + 3.0% rent growth), your $32k cash investment doubles in ~2 years — after that, you're playing with house money.
- By year 3, paydown + projected appreciation supports a ~$31k cash-out refi (75% LTV) — recoverable capital for the next deal without selling this one.
Negotiation context
- It's been on market 81 days — a 6% lower offer ($108k) is reasonable based on typical stale-listing flexibility.
- 3 sale attempts; this cycle's ask has dropped $20k (15%) from the opening price — seller is motivated, your offer sets the floor, not the list.
- Current owner paid $70k; list at $115k implies a 64% gain — meaningful room to come down on a strong offer.
Risks & watch-outs
- Climate carrying-cost: major wind risk, 78% chance of damaging wind over 30y; major wildfire risk; extreme-heat days projected 7→16/yr by 2055 (HVAC capex compounding) — expect insurance premiums to compound above CPI over the hold.
Questions for the listing agent
- It's been on market 81 days. Have you received any prior offers? Is the seller open to a 6% concession, seller financing, or rate buy-down credit?
- Have any recent inspections been done? Can we get a copy of the seller's disclosures and any deferred-maintenance estimates?
- Why hasn't it sold? Are there any deal-killer items the seller is aware of (foundation, flood, title, zoning, code violations)?
- Is there a deadline driving the sale (1031 exchange, divorce, estate, relocation)? That informs how much negotiation room exists.
- Schools are D-rated, which usually means shorter tenancies and higher turnover. Who's the typical renter profile here, and what's been the actual vacancy rate?
- Crime grade is D in this area — have there been break-ins, vandalism, or insurance claims at this property in the last 3 years? What carrier currently insures it and at what premium?
- What's the average days-on-market for RENTAL listings here right now (not sales)? A rising rental-DOM trend means longer vacancies and softer asking-rent achievability than the comps imply.
- What's the recent tenant-quality profile in this submarket — average credit score on applications, eviction rate, late-payment / NSF rate, and stable-employment percentage? A property-management company in the area should have these aggregated.
- How much new for-sale + rental construction is in the pipeline within 1–3 miles? Heavy new supply typically softens prices + rents 12–24 months out; constrained supply supports both.
Investment metrics
- 1% rule
- 1.25% ✓
- Cap rate
- 10.14%
- Cash-on-cash
- 13.75%
- DSCR
- 1.61
- GRM
- 6.7
CMA / ARV
No comps found within radius.
Projected returns pro-forma
10.0% appreciation · 3.0% rent growth · sell at horizon
- IRR
- 34.4%
- Equity multiple
- 3.68×
- Total profit
- $86,136
- Equity at exit
- $103,601
- IRR
- 29.7%
- Equity multiple
- 8.30×
- Total profit
- $235,189
- Equity at exit
- $223,420
Cash invested: $32,200 (down + closing). Projections, not guarantees.
Landlord ↔ Tenant lean methodology
- Overall (STATE)
- 85 Strongly Landlord-Friendly
- State North Carolina
- 85 Strongly Landlord-Friendly · R+3
- County
- — inherits STATE
- City
- — inherits STATE
ZIP-level market 28371
- Home prices YoY
- 5.0%
- Active inventory
- 44
- Price-to-rent
- 6.7×
Monthly cashflow live
- Estimated rent
- $1,440 medium interval (Pro) →
- Mortgage (P&I)
- −$603
- Tax from tax record
- −$118 /mo · $1,415/yr
- Insurance
- −$48
- HOA
- −$0
- Vacancy / Maint / Mgmt
- −$302
- Net cashflow
- $369
Break-even live
UW: 25.0% down · 7.5% · 30yr · 1.5% tax · 5.0% vac · 8.0% maint · 8.0% mgmt
Financing live
Cash to close
- Down payment
- $28,750
- Closing costs
- $3,450
- Reserves months
- —
- Total cash needed
- —
Loan-product check · same deal, 3 products live
Conventional
25% down · 7.5% · 30yr
- Down + closing
- —
- Monthly P&I
- —
- Monthly cashflow
- —
- DSCR
- —
- Eligible?
- —
Personal DTI + credit; lowest rate.
DSCR
20% down · 8.5% · 30yr
- Down + closing
- —
- Monthly P&I
- —
- Monthly cashflow
- —
- DSCR
- —
- Eligible?
- —
No personal income docs; deal must DSCR.
Hard money
10% down · 12.0% · 12mo
- Down + closing
- —
- Monthly P&I
- —
- Monthly cashflow
- —
- DSCR
- —
- Eligible?
- —
Short-term bridge; refi at stabilization.
Rent comps 3 comps
| Address | Beds | Baths | Sqft | Rent | $/sqft | DOM | Units | Dist |
|---|---|---|---|---|---|---|---|---|
| 5536 Gilcrest Sands Dr Hope Mills, NC | 3.0 | 2.0 | 1421 | $1,395 | $0.98 | 23d | 1 | 1.05mi |
| 3766 Colonial Cv Hope Mills, NC | 3.0 | 1.5 | 1475 | $1,445 | $0.98 | 14d | 1 | 1.23mi |
| 5660 Bauer St Hope Mills, NC | 3.0 | 2.0 | 1492 | $1,495 | $1.00 | 23d | 1 | 1.47mi |
Listing history 24 events
-
2026-06-18days on market $115,000 Active 81 DOM
-
2026-06-17days on market $115,000 Active 80 DOM
-
2026-06-16days on market $115,000 Active 79 DOM
-
2026-06-15days on market $115,000 Active 78 DOM
-
2026-06-14days on market $115,000 Active 76 DOM
-
2026-06-13days on market $115,000 Active 75 DOM
-
2026-06-10pricedays on market $115,000 Active 73 DOM
-
2026-06-09days on market $135,000 Active 72 DOM
-
2026-06-08days on market $135,000 Active 71 DOM
-
2026-06-07days on market $135,000 Active 70 DOM
-
2026-06-03days on market $135,000 Active 66 DOM
-
2026-06-02days on market $135,000 Active 65 DOM
-
2026-06-01days on market $135,000 Active 64 DOM
-
2026-05-31days on market $135,000 Active 63 DOM
-
2026-05-30days on market $135,000 Active 62 DOM
-
2026-03-29$135,000 Active
-
2026-02-25$135,000 Active
-
2025-08-12soldstatus $70,000
-
2025-08-11soldstatus $70,000 Closed 329-char remark
Show marketing remark (329 chars)
Buy today: Profit for tomorrow! Hidden asset! Great secluded location, near the entrance to US 295 extension. This property is being sold as is and need work, but great upside for the investor or owner occupant. Features 3+ acre lot, over 1800 sq. ft. of living space and so much more. Don't miss out on this great opportunity!
-
2025-07-24status Pending 329-char remark
Show marketing remark (329 chars)
Buy today: Profit for tomorrow! Hidden asset! Great secluded location, near the entrance to US 295 extension. This property is being sold as is and need work, but great upside for the investor or owner occupant. Features 3+ acre lot, over 1800 sq. ft. of living space and so much more. Don't miss out on this great opportunity!
-
2025-06-18price $84,900 329-char remark
Show marketing remark (329 chars)
Buy today: Profit for tomorrow! Hidden asset! Great secluded location, near the entrance to US 295 extension. This property is being sold as is and need work, but great upside for the investor or owner occupant. Features 3+ acre lot, over 1800 sq. ft. of living space and so much more. Don't miss out on this great opportunity!
-
2025-05-01price $89,900 329-char remark
Show marketing remark (329 chars)
Buy today: Profit for tomorrow! Hidden asset! Great secluded location, near the entrance to US 295 extension. This property is being sold as is and need work, but great upside for the investor or owner occupant. Features 3+ acre lot, over 1800 sq. ft. of living space and so much more. Don't miss out on this great opportunity!
-
2025-03-05$95,000 Active 329-char remark
Show marketing remark (329 chars)
Buy today: Profit for tomorrow! Hidden asset! Great secluded location, near the entrance to US 295 extension. This property is being sold as is and need work, but great upside for the investor or owner occupant. Features 3+ acre lot, over 1800 sq. ft. of living space and so much more. Don't miss out on this great opportunity!
-
1996-04-19soldstatus $70,000
ⓘ Source: listings_history table (triggers on properties + properties_extension) + one-shot
backfill from property_details.listing_events for pre-trigger history.
Tax reassessment forecast NC · Resets to sale price
- Current annual tax
- $1,415 · $118/mo
- Projected year-2 tax
- $1,415 · $118/mo
- Expected delta
- $0/yr ($0/mo · 0.0%)
ⓘ Screening estimate from a state-policy table — verify with the county assessor before closing.
Climate risk First Street
- Flood 1/10 Low FEMA zone X (unshaded) · 0% chance over 30 yrs
- Wildfire 7/10 Severe
- Heat 7/10 Severe 7 d/yr ≥106°F today · 16 d/yr by 30 yrs out
- Wind 7/10 Severe 78% chance of damaging wind over 30 yrs
- Air quality 1/10 Low 0 unhealthy d/yr today · 0 by 30 yrs out
Nearby sold comps map
Loading sold comps map…
Walkable amenities ~0.75 mi
Loading nearby amenities…
Taxation est. · year 1
- Rental income
- $17,284
- − Mortgage interest
- −$6,442
- − Property taxes
- −$1,415
- − Insurance
- −$575
- − Repairs & maintenance
- −$1,383
- − Management
- −$1,383
- − Depreciation
- −$3,345
- Taxable income
- $2,741
- Est. tax owed @ 24.0%
- −$658
- After-tax cash flow
- $3,769/yr
For passive investors: Depreciation is non-cash, so a rental often shows a tax loss while cash-flowing — sheltering income. Rental losses are passive: they offset passive income freely, and up to $25,000/yr can offset ordinary (W-2) income if you actively participate and your MAGI is under $100k (phasing out to $0 by $150k); unused losses carry forward. On sale, claimed depreciation is recaptured at up to 25%, and gains may owe capital-gains tax (a 1031 exchange can defer both). Figures are a year-1 estimate at your 24.0% rate — not tax advice; consult a CPA.
Condition & rehab AI · 12 photos
This property requires extensive repairs and maintenance, including major work on the roof and exterior. Painting and landscaping can improve its curb appeal and rental value.
Repairs flagged
- Major roof — Significant damage visible
- Major exterior siding — Significant damage visible
- Major interior walls/paint — Chipped and worn
- Major windows — Damaged
- Major HVAC/mechanicals — No visible signs, but likely outdated
Value-add opportunities
- Resale Painting and minor repairs — Fresh paint and repairs can significantly improve curb appeal
- Rental Landscaping — Well-maintained landscaping can attract renters
- Both HVAC upgrade — Upgrading HVAC can improve comfort and energy efficiency
Renovation cost estimate screening
| Repair item | Severity | Est. cost |
|---|---|---|
| roof · Significant damage visible | Major | $15,000–50,000 |
| exterior siding · Significant damage visible | Major | $15,000–50,000 |
| interior walls/paint · Chipped and worn | Major | $15,000–50,000 |
| windows · Damaged | Major | $15,000–50,000 |
| HVAC/mechanicals · No visible signs, but likely outdated | Major | $15,000–50,000 |
| Total estimated repair cost · 5 items | $75,000–250,000 |
Value-add ROI direction
- Resale Painting and minor repairs — Fresh paint and repairs can significantly improve curb appeal ↑
- Rental Landscaping — Well-maintained landscaping can attract renters ↑
- Both HVAC upgrade — Upgrading HVAC can improve comfort and energy efficiency ↑
ⓘ Cost ranges are severity-bucket heuristics (US national rule-of-thumb). Get contractor quotes + a written scope before underwriting a rehab budget.
Schools (NCES district)
- District
- Cumberland County Schools
- NCES district ID
- 3700011
- Math proficiency
- 32% ▼ -2.00%
- Reading proficiency
- 41% ▼ -1.00%
- Median HH income
- $44,168
- Composite
- 31.0/100
- National rank
- #6096
- State rank
- #126 of 178 in NC
Livability — Hope Mills
- Score
- 67/100
- State rank
- #234
- US rank
- #10761
Category grades
Schools grade is shown separately in the Schools card above.
Census & demographics
- City population
- 39,196
- Population (ZIP)
- 6,458
Population outlook (Cumberland County) Hauer SSP2
- Today (2025)
- 330,855 people
- By 2030
- 333,523 · +0.8%
- By 2040
- 335,583 · +1.4%
- By 2050
- 335,325 · +1.4%
- By 2075
- 342,853 · +3.6%
- By 2100
- 340,698 · +3.0%
Race, ethnicity, and origin ACS 2023
- Neighborhood character
- Diverse neighborhood (Simpson 0.69)
- Race & ethnicity
- White 42% Black 34% Hispanic / Latino 14% Two or more races 8% Native American 4%
- Hispanic origin (detail)
- Mexican 5% Puerto Rican 4%
- Common ancestry
- Serbian 3% Italian 2% Slovak 2%
- Foreign-born
- 6% · Canada, Vietnam
- Languages at home
- 91% English-only · Spanish 7% German/W. Germanic 1%
Political lean MEDSL · Cumberland
- 2024 margin
- D (+13.4) · D 56.1% · R 42.7% · Other 1.2%
- 2008→2024 swing
- -4.3pp toward R · 2008: 17.7pp · 2024: 13.4pp
- All cycles
- 2024: D+13.4 2020: D+16.6 2016: D+16.0 2012: D+19.7 2008: D+17.7
Not yet ingested
- Civics
- —
Market trends
- HPI YoY
- ▲ 15.91%
- Current HPI
- 330.85
- Rent YoY
- —
- Metro
- —
- State GDP YoY
- ▲ 3.28%
- F500 in state
- 26
Industry mix (Fortune 500 HQ in NC)
| Industry | F500 HQs | Revenue |
|---|---|---|
| Financial Services | 2 | $213B |
|
||
| Retail | 2 | $95B |
|
||
| Industrial Conglomerate | 1 | $38B |
|
||
| Metals / Steel | 1 | $35B |
|
||
| Utilities | 1 | $30B |
|
||
| Industrial Machinery | 1 | $19B |
|
||
Price history
+92.9% since first listed9 events — show timeline
- 2026-03-29 Listed $135,000 LPRMLS
- 2026-02-25 Listed $135,000 LPRMLS
- 2025-08-12 Sold (Public Records) $70,000 Public Records
- 2025-08-11 Sold (MLS) $70,000 LPRMLS
- 2025-07-24 Pending — LPRMLS
- 2025-06-18 Price Changed $84,900 LPRMLS
- 2025-05-01 Price Changed $89,900 LPRMLS
- 2025-03-05 Listed $95,000 LPRMLS
- 1996-04-19 Sold (Public Records) $70,000 Public Records
Property tax history
+16.4%/yrLatest (2025): $1,415 · +67.5% YoY. Source: county tax records.
Cash-flow waterfall
monthlySold comps — $/sqft
last 12 mo · ≤1 miLoading sold comps…