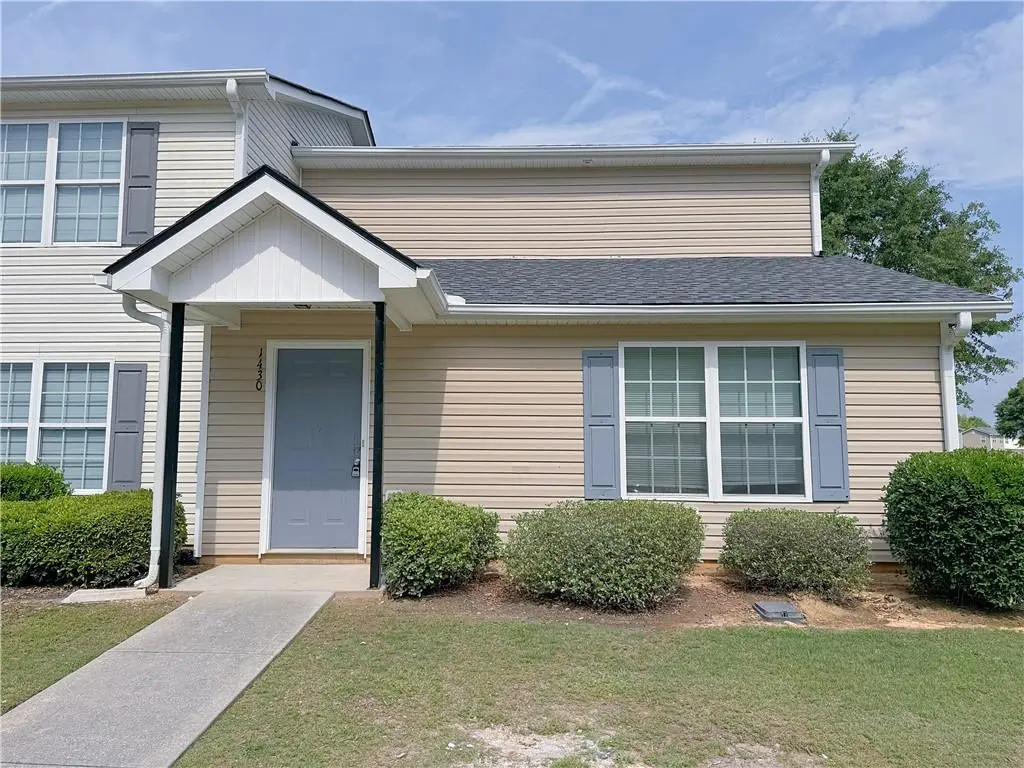
1430 Eastmont Dr NW · Conyers, GA
Flood risk 1/10 · Minimal
- FEMA flood zone
- X (unshaded)
- Chance of flooding over 30 yrs
- 0.0%
- Est. flood insurance / yr
- $507 – $1,088
Fire risk 4/10 · Minor
- Est. fire insurance / yr
- $963 – $1,789
Heat risk 6/10 · Moderate
- Hot days now (above 105°F)
- 7 days/yr
- Hot days in 30 yrs
- 18 days/yr
Wind risk 5/10 · Moderate
- Chance of severe wind over 30 yrs
- 25.0%
Air-quality risk 5/10 · Moderate
- Unhealthy air days now
- 6 days/yr
- Unhealthy air days in 30 yrs
- 8 days/yr
Risk factors via First Street. Map © Google.
Why this score? — see what drove the D- grade
The composite is a weighted blend of 9 inputs, each scored 0–100. Each bar is that input's sub-score; the figure is the points it added to the 100-point composite (weight × sub-score).
- Cash flow +13.4/30.0
- 1% rule +4.4/10.0
- ARV discount +4.3/15.0
- DSCR +4.0/10.0
- Livability +3.4/5.0
- Rent growth +2.6/5.0
- Condition / age +2.5/5.0
- Schools +1.9/10.0
- Appreciation +0.0/10.0
$169,900
🖨 Deal sheet (PDF) 📄 Offer letter ✓ Due diligence
Listing remarks MLS
Granite Countertops Brand-New First-Floor LVP HOA-Maintained Landscaping & Community Safety Located in an established Conyers community, 1430 Eastmont Dr NW offers a comfortable and functional layout with thoughtful updates throughout. The home features granite countertops, a practical kitchen setup, and brand-new LVP flooring throughout the first floor, creating a clean and low-maintenance living space. The main level offers an inviting living area with easy flow to the kitchen and dining space, while the upstairs layout provides privacy and flexibility for daily living. The HOA helps maintain the community landscaping and supports overall community safety, adding convenience and peace of mind for residents. With easy access to nearby shopping, dining, schools, and major highways, this property is a great option for both homeowners and investors looking for a well-located home in the growing Conyers market.
Key facts
- Inviting living area
- First-floor lvp
- Granite countertops
Tags
Property features AI
Finance
- Other: Directions: Please follow the GPS
- HOA & community: Monthly association fee of $140; Association covers grounds maintenance, security, trash, and water; Community of 165 units; Homeowners association
Exterior
- Parking: Parking lot; Parking pad
- Security: Community security included
- Utilities: Public water; Public sewer; Electricity available (220 volts)
- Home design: Two levels; Resale property; Fee simple ownership
- Construction: Vinyl siding; Composition roof; Slab foundation
- Exterior features: Concrete road frontage; City street access; Community playground; Community grounds maintenance included
Interior
- Kitchen: Stained cabinets with stone countertops; Electric oven; Electric range; Range hood; Refrigerator
- Bedrooms: One main-level bedroom; Two upper-level bedrooms; Bedroom features: Other
- Flooring: Carpet; Luxury vinyl
- Bathrooms: Two full bathrooms; One full bathroom on the main level; One full bathroom on the upper level; Master bathroom with double vanity
- Heating & cooling: Central heating; Central air conditioning
- Interior features: Double vanity in bathroom; Double-pane windows; Shared wall (1 common wall); Open-concept dining area; Other interior features
- Laundry & utility: Laundry closet on the upper level
Neighborhood map
What this means for you Summary
Snapshot
- This is a 3-bed/2.0-bath townhouse listed at $170k.
Deal economics
- At list price, monthly cash flow is $2 ($24/yr) — positive.
- The deal already cash-flows at list — no discount required.
- To meet the 1% rule (rent ≥ 1% of price), the offer needs to be $160k (5.7% below list).
- Recommended offer: $160k (5.7% below list) — sets the bar for 1% rule.
- Cap rate 6.3% vs local median 4.4% in Conyers — top-decile yield for the area; either an underpriced asset or a hidden risk that comps aren't pricing in. Stress-test before assuming the spread holds.
Location & tenants
- Location reads 67/100 on livability (#167 in GA) — a middle-class / working-renter tenant base. Strengths: cost of living A+, housing A+; Watch: crime D, amenities D, commute F.
- Rockdale County (suburban): math 14% / reading 29% proficiency, ranked #136 of 174 in GA (top 78%) — low school quality limits family demand, transient renter base, plan for 1-2y turnover.
- Zoned schools: Shoal Creek Elementary School (math 17% / reading 22%, grade F, #878 of 1,228 statewide, top 75%, 674 students, 75% FRL); Conyers Middle School (math 9% / reading 24%, grade F, #388 of 470 statewide, top 83%, 1,031 students, 78% FRL); Rockdale County High School (math 12% / reading 17%, grade F, #315 of 424 statewide, top 76%, 2,369 students, 64% FRL).
- Market conditions: Rents flat; 281 active listings in the ZIP; 24 comparable units currently listed for rent nearby; rentals at typical pace (median 24d on market — plan ~3-4 weeks tenant-placement turnaround); 483 units permitted in Rockdale County in 2024 (0 in 5+ unit buildings).
Forward outlook
- Local home prices are declining (-3.0%/yr); year-one equity from $1k of loan paydown is wiped out by about $5k of value loss. Plan a longer hold.
- Rockdale County population projected at +29% by 2050 — long-run rental-demand tailwind backs the buy-and-hold thesis.
Negotiation context
- It's been on market 18 days — a 2% lower offer ($167k) is reasonable based on typical stale-listing flexibility.
- 3 sale attempts since 8y ago with the ask held roughly flat each time — persistent listings suggest the price (not the market) is what's stuck; bring a comps-based counter.
- Current owner paid $10k; list at $170k implies a 1599% gain — meaningful room to come down on a strong offer.
Risks & watch-outs
- Climate carrying-cost: moderate wind risk, 25% chance of damaging wind over 30y; extreme-heat days projected 7→18/yr by 2055 (HVAC capex compounding) — expect insurance premiums to compound above CPI over the hold.
Questions for the listing agent
- What does the HOA fee cover, when was the last increase, and are there any pending special assessments or reserve-fund shortfalls?
- Is there a deadline driving the sale (1031 exchange, divorce, estate, relocation)? That informs how much negotiation room exists.
- Schools are D-rated, which usually means shorter tenancies and higher turnover. Who's the typical renter profile here, and what's been the actual vacancy rate?
- Crime grade is D in this area — have there been break-ins, vandalism, or insurance claims at this property in the last 3 years? What carrier currently insures it and at what premium?
- The area grade is low — what's the realistic commute time and amenity access for the typical tenant pool here? Any planned neighborhood developments (good or bad) we should know about?
- What's the average days-on-market for RENTAL listings here right now (not sales)? A rising rental-DOM trend means longer vacancies and softer asking-rent achievability than the comps imply.
- What's the recent tenant-quality profile in this submarket — average credit score on applications, eviction rate, late-payment / NSF rate, and stable-employment percentage? A property-management company in the area should have these aggregated.
- How much new for-sale + rental construction is in the pipeline within 1–3 miles? Heavy new supply typically softens prices + rents 12–24 months out; constrained supply supports both.
Investment metrics
- 1% rule
- 0.94% ✗
- Cap rate
- 6.31%
- Cash-on-cash
- 0.05%
- DSCR
- 1.00
- GRM
- 8.8
CMA / ARV
- ARV (on-the-fly)
- $158,592
- Comps found
- 12
Show comp detail 12 sales within ~0.75 mi
| Address | Dist | Beds/Ba | Sqft | Sold | Price | $/sf | Match |
|---|---|---|---|---|---|---|---|
| 1240 Pinedale Cir NW | 0.22mi | 3/2.5 | 1,324 (-2%) | 2mo | $169,000 | $128 | 83 |
| 1236 Pinedale Cir NW | 0.22mi | 3/2.5 | 1,324 (-2%) | 7mo | $175,000 | $132 | 79 |
| 1223 Cedar Creek Ct | 0.09mi | 3/1.5 | 1,444 (+7%) | 4mo | $110,000 | $76 | 78 |
| 1211 Cedar Creek Ct NW | 0.10mi | 3/1.5 | 1,160 (-14%) | 2mo | $105,000 | $91 | 69 |
| 1432 Forest Villa Dr | 0.17mi | 3/1.5 | 1,160 (-14%) | 4mo | $110,000 | $95 | 63 |
| 1143 Forest Villa Dr NW | 0.24mi | 3/1.5 | 1,214 (-10%) | 12mo | $117,600 | $97 | 61 |
| 1209 Willow Creek Ct NW | 0.12mi | 3/2.0 | 1,162 (-14%) | 14mo | $108,000 | $93 | 60 |
| 1168 Dogwood Ct NW | 0.15mi | 3/1.5 | 1,160 (-14%) | 12mo | $150,000 | $129 | 58 |
| 1110 Windgate Cir NW | 0.65mi | 2/2.5 (-1) | 1,200 (-11%) | 1mo | $98,000 | $82 | 44 |
| 1339 Lakeview Dr NW | 0.46mi | 2/2.5 (-1) | 1,200 (-11%) | 11mo | $141,000 | $118 | 44 |
| 1272 Lakeview Dr NW | 0.60mi | 2/2.5 (-1) | 1,200 (-11%) | 4mo | $173,000 | $144 | 44 |
| 1115 Mccords Cor Nw Dr NW | 0.64mi | 2/2.5 (-1) | 1,200 (-11%) | 9mo | $143,000 | $119 | 38 |
Match score weights: distance 35% · size 25% · config 20% · recency 20%. Top-matched comps best support the ARV.
Projected returns pro-forma
-3.0% appreciation · 0.39% rent growth · sell at horizon
- IRR
- -19.4%
- Equity multiple
- 0.34×
- Total profit
- $-31,425
- Equity at exit
- $25,333
- IRR
- -19.3%
- Equity multiple
- 0.10×
- Total profit
- $-42,847
- Equity at exit
- $14,690
Cash invested: $47,572 (down + closing). Projections, not guarantees.
Landlord ↔ Tenant lean methodology
- Overall (STATE)
- 90 Strongly Landlord-Friendly
- State Georgia
- 90 Strongly Landlord-Friendly · R+3
- County
- — inherits STATE
- City
- — inherits STATE
ZIP-level market 30012
- Rents YoY
- 0.4%
- Active inventory
- 281
- Price-to-rent
- 8.8×
Monthly cashflow live
- Estimated rent
- $1,602 high interval (Pro) →
- Mortgage (P&I)
- −$891
- Tax from tax record
- −$162 /mo · $1,941/yr
- Insurance
- −$71
- HOA
- −$140
- Vacancy / Maint / Mgmt
- −$336
- Net cashflow
- $2
Break-even live
Sensitivity live
| Price | -10% $98 | -5% $50 | +0% $2 | +5% $-46 | +10% $-94 |
|---|---|---|---|---|---|
| Rent | -10% $-125 | -5% $-61 | +0% $2 | +5% $65 | +10% $129 |
| Rate | -1.0pp $88 | -0.5pp $45 | base $2 | +0.5pp $-42 | +1.0pp $-87 |
UW: 25.0% down · 7.5% · 30yr · 1.5% tax · 5.0% vac · 8.0% maint · 8.0% mgmt
Financing live
Cash to close
- Down payment
- $42,475
- Closing costs
- $5,097
- Reserves months
- —
- Total cash needed
- —
Loan-product check · same deal, 3 products live
Conventional
25% down · 7.5% · 30yr
- Down + closing
- —
- Monthly P&I
- —
- Monthly cashflow
- —
- DSCR
- —
- Eligible?
- —
Personal DTI + credit; lowest rate.
DSCR
20% down · 8.5% · 30yr
- Down + closing
- —
- Monthly P&I
- —
- Monthly cashflow
- —
- DSCR
- —
- Eligible?
- —
No personal income docs; deal must DSCR.
Hard money
10% down · 12.0% · 12mo
- Down + closing
- —
- Monthly P&I
- —
- Monthly cashflow
- —
- DSCR
- —
- Eligible?
- —
Short-term bridge; refi at stabilization.
Rent comps 24 comps
| Address | Beds | Baths | Sqft | Rent | $/sqft | DOM | Units | Dist |
|---|---|---|---|---|---|---|---|---|
| 1459 Forest Villa Dr NW Conyers, GA | 3.0 | 1.5 | 1160 | $1,500 | $1.29 | 3d | 1 | 0.15mi |
| 1214 Pinedale Cir NW Conyers, GA | 3.0 | 2.5 | 1324 | $1,475 | $1.11 | 45d | 1 | 0.16mi |
| 1158 Pinedale Cir NW Conyers, GA | 2.0 | 1.0 | 1002 | $1,350 | $1.35 | 5d | 1 | 0.17mi |
| 1158 Pinedale Cir NW Conyers, GA | 2.0 | 1.0 | 1002 | $1,350 | $1.35 | 1d | 1 | 0.17mi |
| 1443 Forest Villa Dr NW Conyers, GA | 3.0 | 2.0 | 1264 | $1,499 | $1.19 | 45d | 1 | 0.18mi |
| 1240 Pinedale Cir NW Conyers, GA | 3.0 | 2.5 | 1324 | $1,900 | $1.44 | 26d | 1 | 0.21mi |
| 1653 Pinedale Cir NW Conyers, GA | 2.0 | 1.5 | 1160 | $1,350 | $1.16 | 45d | 1 | 0.23mi |
| 1427 Villa Pines Ct NW Conyers, GA | 2.0 | 1.5 | 1350 | $1,450 | $1.07 | 20d | 1 | 0.24mi |
| 1190 Millcrest Walk NW Conyers, GA | 2.0 | 1.0–2.0 | 1035 | $1,299 | $1.26 | 5d | 18 | 0.40mi |
| 1289 Knoll Ct NW Conyers, GA | 2.0 | 2.0 | 1200 | $1,245 | $1.04 | 45d | 1 | 0.59mi |
| 1107 Windgate Cir NW Conyers, GA | 2.0 | 2.5 | 1200 | $1,570 | $1.31 | 24d | 1 | 0.67mi |
| 1219 Lakeview Dr NW Conyers, GA | 2.0 | 1.0 | 900 | $1,000 | $1.11 | 45d | 1 | 0.72mi |
| 1322 S Hicks Cir NW Conyers, GA | 3.0 | 2.0 | 1250 | $2,000 | $1.60 | 7d | 1 | 0.76mi |
| 1015 Rosser St NW Unit 4A Conyers, GA | 2.0 | 1.0 | 1000 | $1,199 | $1.20 | 4d | 1 | 0.94mi |
| 2059 Appaloosa Way Conyers, GA | 3.0 | 3.0 | 1556 | $2,055 | $1.32 | 45d | 1 | 0.99mi |
| 2050 Appaloosa Way Conyers, GA | 3.0 | 3.0 | 1556 | $2,105 | $1.35 | 45d | 1 | 1.02mi |
| 1175 Milstead Ave NE Conyers, GA | 3.0 | 2.0 | 1406 | $1,541 | $1.10 | 7d | 1 | 1.03mi |
| 2032 Appaloosa Way Conyers, GA | 3.0 | 2.5 | 1561 | $1,955 | $1.25 | 6d | 1 | 1.03mi |
| 1011 Peek St NW Conyers, GA | 2.0 | 1.0 | 1609 | $1,400 | $0.87 | 20d | 1 | 1.06mi |
| 1759 Stag Dr NW Conyers, GA | 3.0 | 2.0 | 1215 | $1,811 | $1.49 | 24d | 1 | 1.15mi |
| 1075 Eastview Rd NE Unit A Conyers, GA | 2.0 | 1.0 | 1018 | $1,250 | $1.23 | 45d | 1 | 1.19mi |
| 1031 Barn Oak Ct NE Conyers, GA | 2.0 | 1.0 | 961 | $1,295 | $1.35 | 45d | 1 | 1.20mi |
| 1055 Pine St NE Conyers, GA | 2.0 | 2.0 | 1184 | $1,300 | $1.10 | 1d | 1 | 1.46mi |
| 1055 Pine St NE Conyers, GA | 2.0 | 2.0 | 1184 | $1,300 | $1.10 | 14d | 1 | 1.46mi |
HOA detail
- Monthly dues
- $140 · $1,680/yr
- Likely covers
- landscaping
Listing history 11 events
-
2026-06-21days on market $169,900 Active 18 DOM
-
2026-06-18days on market $169,900 Active 15 DOM
-
2026-06-17days on market $169,900 Active 14 DOM
-
2026-06-16days on market $169,900 Active 13 DOM
-
2026-06-15days on market $169,900 Active 12 DOM
-
2026-06-13days on market $169,900 Active 10 DOM
-
2026-06-09days on market $169,900 Active 6 DOM
-
2026-06-08days on market $169,900 Active 5 DOM
-
2026-06-07days on market $169,900 Active 4 DOM
-
2026-06-04remarks 695-char remark
-
2026-06-04$169,900 Active 1 DOM
ⓘ Source: listings_history table (triggers on properties + properties_extension) + one-shot
backfill from property_details.listing_events for pre-trigger history.
Tax reassessment forecast GA · Resets to sale price
- Current annual tax
- $1,941 · $162/mo
- Projected year-2 tax
- $1,941 · $162/mo
- Expected delta
- $0/yr ($0/mo · 0.0%)
ⓘ Screening estimate from a state-policy table — verify with the county assessor before closing.
Climate risk First Street
- Flood 1/10 Low FEMA zone X (unshaded) · 0% chance over 30 yrs
- Wildfire 4/10 Moderate
- Heat 6/10 Major 7 d/yr ≥105°F today · 18 d/yr by 30 yrs out
- Wind 5/10 Major 25% chance of damaging wind over 30 yrs
- Air quality 5/10 Major 6 unhealthy d/yr today · 8 by 30 yrs out
Nearby sold comps map
Loading sold comps map…
Walkable amenities ~0.75 mi
Loading nearby amenities…
Taxation est. · year 1
- Rental income
- $19,224
- − Mortgage interest
- −$9,517
- − Property taxes
- −$1,941
- − Insurance
- −$850
- − Repairs & maintenance
- −$1,538
- − Management
- −$1,538
- − HOA
- −$1,680
- − Depreciation
- −$4,943
- Taxable loss
- −$2,783
- Est. tax savings @ 24.0%
- +$668
- After-tax cash flow
- $692/yr
For passive investors: Depreciation is non-cash, so a rental often shows a tax loss while cash-flowing — sheltering income. Rental losses are passive: they offset passive income freely, and up to $25,000/yr can offset ordinary (W-2) income if you actively participate and your MAGI is under $100k (phasing out to $0 by $150k); unused losses carry forward. On sale, claimed depreciation is recaptured at up to 25%, and gains may owe capital-gains tax (a 1031 exchange can defer both). Figures are a year-1 estimate at your 24.0% rate — not tax advice; consult a CPA.
Schools (NCES district)
- District
- Rockdale County
- NCES district ID
- 1304410
- Math proficiency
- 14% ▼ -17.00%
- Reading proficiency
- 29% ▼ -11.00%
- Median HH income
- $53,325
- Composite
- 19.42/100
- National rank
- #8776
- State rank
- #136 of 174 in GA
Livability — Conyers
- Score
- 67/100
- State rank
- #167
- US rank
- #10533
Category grades
Schools grade is shown separately in the Schools card above.
Census & demographics
- Census place
- Conyers, GA
- County
- Rockdale County · 96,534 people
- City population
- 96,534
- Metro
- Atlanta-Sandy Springs-Alpharetta, GA
- Population (ZIP)
- 34,506
- Household income
- $66,153
- Rent vs Own
- Severe rent burden
- 986.0
Population outlook (Rockdale County) Hauer SSP2
- Today (2025)
- 99,145 people
- By 2030
- 104,558 · +5.5%
- By 2040
- 116,100 · +17.1%
- By 2050
- 127,827 · +28.9%
- By 2075
- 159,113 · +60.5%
- By 2100
- 181,178 · +82.7%
Race, ethnicity, and origin ACS 2023
- Neighborhood character
- Diverse neighborhood (Simpson 0.65)
- Race & ethnicity
- Black 49% White 27% Hispanic / Latino 18% Two or more races 8% Asian 1%
- Hispanic origin (detail)
- Mexican 15%
- Common ancestry
- Hispanic 1% Lithuanian 1% Italian 1%
- Foreign-born
- 14% · Canada, South Korea
- Languages at home
- 81% English-only · Spanish 16% French/Haitian/Cajun 2% Korean 1%
Political lean MEDSL · Rockdale
- 2024 margin
- Solid D (+47.5) · D 73.4% · R 25.9%
- 2008→2024 swing
- +37.9pp toward D · 2008: 9.6pp · 2024: 47.5pp
- All cycles
- 2024: D+47.5 2020: D+40.8 2016: D+25.9 2012: D+16.4 2008: D+9.6
Not yet ingested
- Civics
- —
Market trends
- HPI YoY
- ▼ -123.61%
- Current HPI
- 226.9588
- Rent YoY
- ▲ 0.39%
- Metro
- Atlanta-Sandy Springs-Alpharetta, GA
- State GDP YoY
- ▲ 2.66%
- F500 in state
- 28
Industry mix (Fortune 500 HQ in GA)
| Industry | F500 HQs | Revenue |
|---|---|---|
| Paper / Packaging | 2 | $29B |
|
||
| Retail | 1 | $160B |
|
||
| Transportation / Logistics | 1 | $91B |
|
||
| Airlines | 1 | $62B |
|
||
| Consumer Goods | 1 | $47B |
|
||
| Utilities | 1 | $25B |
|
||
Price history
+34.8% since first listed9 events — show timeline
- 2026-06-03 Listed $169,900 FMLS
- 2026-06-03 Listed $169,900 GAMLS
- 2022-05-10 Price Changed $1,450 RENT.
- 2019-05-05 Listing Removed — GAMLS
- 2018-11-04 Listed $95,000 GAMLS
- 2009-12-04 Sold (Public Records) $10,000 Public Records
- 2008-05-29 Sold (Public Records) $420,000 Public Records
- 2008-02-15 Sold (Public Records) $310,000 Public Records
- 2004-08-10 Sold (Public Records) $126,000 Public Records
Property tax history
+2.2%/yrLatest (2025): $1,941 · +4.4% YoY. Source: county tax records.
Cash-flow waterfall
monthlySold comps — $/sqft
last 12 mo · ≤1 miLoading sold comps…