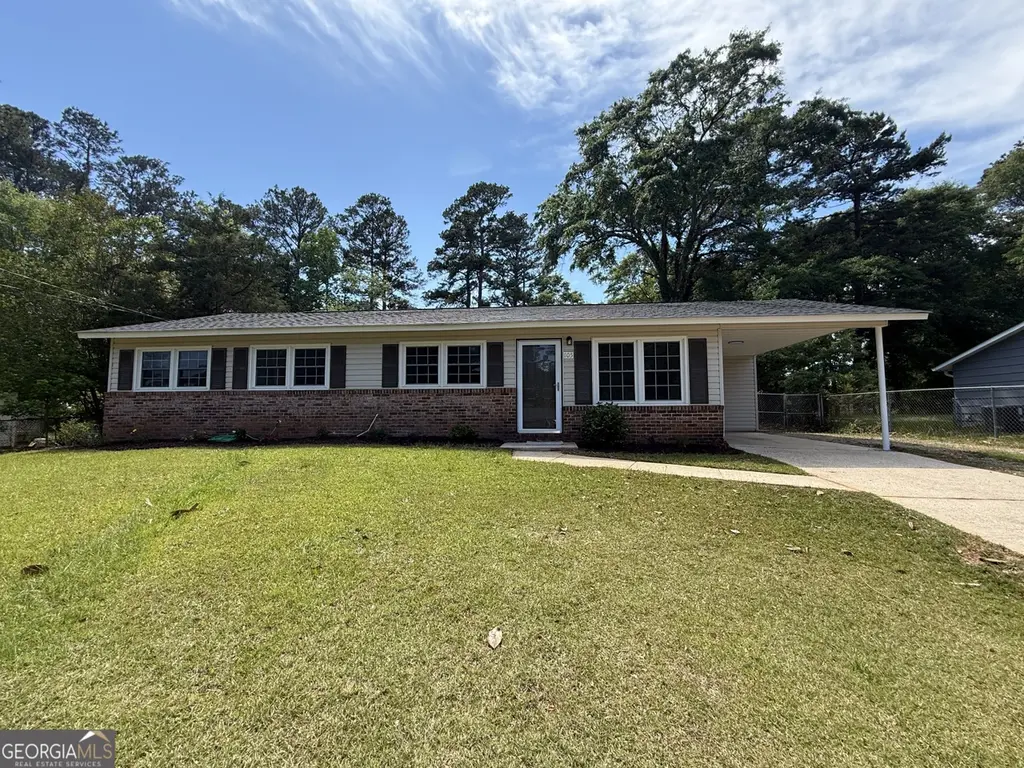
105 Sir Lancelot Ave · LaGrange, GA
Flood risk 1/10 · Minimal
- FEMA flood zone
- X (unshaded)
- Chance of flooding over 30 yrs
- 0.0%
- Est. flood insurance / yr
- $507 – $1,088
Fire risk 3/10 · Minor
- Est. fire insurance / yr
- $963 – $1,789
Heat risk 6/10 · Moderate
- Hot days now (above 105°F)
- 7 days/yr
- Hot days in 30 yrs
- 19 days/yr
Wind risk 6/10 · Moderate
- Chance of severe wind over 30 yrs
- 53.0%
Air-quality risk 4/10 · Minor
- Unhealthy air days now
- 4 days/yr
- Unhealthy air days in 30 yrs
- 5 days/yr
Risk factors via First Street. Map © Google.
Why this score? — see what drove the F grade
The composite is a weighted blend of 9 inputs, each scored 0–100. Each bar is that input's sub-score; the figure is the points it added to the 100-point composite (weight × sub-score).
- Cash flow +13.3/30.0
- DSCR +4.0/10.0
- Rent growth +3.7/5.0
- Livability +3.0/5.0
- 1% rule +2.9/10.0
- ARV discount +2.8/15.0
- Condition / age +2.5/5.0
- Schools +2.3/10.0
- Appreciation +0.0/10.0
$207,900
🖨 Deal sheet (PDF) 📄 Offer letter ✓ Due diligence
Listing remarks
Welcome home to this charming single-level gem in Camelot Estates! Offering 4 bedrooms and 1 uniquely designed Jack-and-Jill bath, this home is both functional and full of character-featuring dual vanities, two commodes, and a beautifully tiled stand-up shower for added convenience. Inside, you'll find 1,175 sqft of thoughtfully designed living space with fresh new carpet, durable laminate flooring, and a stylish tile bath. The kitchen shines with granite countertops, stainless steel appliances, a separate pantry, and a cozy breakfast area perfect for morning coffee. Step outside to enjoy a covered back patio complete with a storage room, overlooking an oversized, fenced backyard that offer
Key facts
- Separate pantry
- Dual vanities
- Jack-and-jill bath
Tags
Property features AI
Finance
- HOA & community: No homeowner association
Exterior
- Parking: Carport; Assigned parking; Attached parking; Off-street parking and parking pad; Guest parking; Side/rear entrance; Kitchen-level access to parking
- Security: Fenced yard
- Utilities: Public water; Public sewer; Electricity available; Cable available; High-speed internet available; Phone service available
- Home design: Single-family residential house; One level; Resale property; Located in Camelot Estate subdivision
- Construction: Built in 1971; Brick construction; Composition roof; Slab foundation
- Exterior features: Patio; Back yard with chain link fencing; Shed(s)
Interior
- Kitchen: Dishwasher; Microwave; Stainless steel appliances; Pantry; Solid surface countertops; Breakfast area
- Bedrooms: 4 bedrooms (all on the main level)
- Flooring: Carpet; Hardwood; Tile
- Bathrooms: 1 full bathroom
- Heating & cooling: Central heating; Central air conditioning; Ceiling fans
- Interior features: Double vanity in bathroom; Tile bath; Dining room and living room combined; Breakfast area, pantry, and solid surface counters in kitchen; Family room
- Laundry & utility: Laundry area in garage; Additional laundry/utility space
Neighborhood map
What this means for you Summary
Snapshot
- This is a 3-bed/1.5-bath single-family listed at $208k.
Deal economics
- At list price, monthly cash flow is $1 ($9/yr) — positive.
- The deal already cash-flows at list — no discount required.
- To meet the 1% rule (rent ≥ 1% of price), the offer needs to be $164k (21.1% below list).
- Recommended offer: $164k (21.1% below list) — sets the bar for 1% rule.
- Cap rate 6.3% vs local median 3.4% in LaGrange — top-decile yield for the area; either an underpriced asset or a hidden risk that comps aren't pricing in. Stress-test before assuming the spread holds.
Location & tenants
- Location reads 60/100 on livability (#393 in GA) — a middle-class / working-renter tenant base. Strengths: cost of living A+, housing A; Watch: crime F, amenities F, commute F.
- Troup County (rural): math 26% / reading 29% proficiency, ranked #109 of 174 in GA (top 63%) — low school quality limits family demand, transient renter base, plan for 1-2y turnover.
- Zoned schools: Callaway Elementary School (math 28% / reading 22%, grade F, #745 of 1,228 statewide, top 61%, 651 students, 72% FRL); Callaway Middle School (math 12% / reading 22%, grade F, #381 of 470 statewide, top 82%, 759 students, 94% FRL); Callaway High School (math 13% / reading 22%, grade F, #264 of 424 statewide, top 63%, 921 students, 94% FRL) — zoned schools average 87% FRL vs 58% district-wide (28 pts higher); higher-poverty schools than district average — tighter screening recommended.
- Market conditions: Rents rising fast (+5.0%/yr); 277 active listings in the ZIP; 8 comparable units currently listed for rent nearby; rentals lingering (median 46d on market — plan ~5-8 weeks vacancy on turnover, expect pricing pressure); 50% of comp listings sitting > 30 days — soft ceiling on asking rent; 474 units permitted in Troup County in 2024 (87 in 5+ unit buildings).
- This rent runs 40% of the median local income ($49k/yr) — at the standard rent-burdened threshold; future hikes will face affordability resistance.
Forward outlook
- Local home prices are declining (-3.0%/yr); year-one equity from $1k of loan paydown is wiped out by about $6k of value loss. Plan a longer hold.
- Troup County population projected at +15% by 2050 — long-run rental-demand tailwind backs the buy-and-hold thesis.
Negotiation context
- Only 5 days on market — expect competitive offers; lowballing is unlikely to land.
- 2 sale attempts; this cycle's ask is 12500% above the opening price — seller raised mid-cycle; expect resistance to lowballs.
Risks & watch-outs
- Climate carrying-cost: major wind risk, 53% chance of damaging wind over 30y; extreme-heat days projected 7→19/yr by 2055 (HVAC capex compounding) — expect insurance premiums to compound above CPI over the hold.
Questions for the listing agent
- Built in 1971 — when were the roof, HVAC, electrical panel, plumbing, and water heater last replaced?
- Is there a deadline driving the sale (1031 exchange, divorce, estate, relocation)? That informs how much negotiation room exists.
- Schools are D-rated, which usually means shorter tenancies and higher turnover. Who's the typical renter profile here, and what's been the actual vacancy rate?
- Crime grade is F in this area — have there been break-ins, vandalism, or insurance claims at this property in the last 3 years? What carrier currently insures it and at what premium?
- The area grade is low — what's the realistic commute time and amenity access for the typical tenant pool here? Any planned neighborhood developments (good or bad) we should know about?
- What's the average days-on-market for RENTAL listings here right now (not sales)? A rising rental-DOM trend means longer vacancies and softer asking-rent achievability than the comps imply.
- What's the recent tenant-quality profile in this submarket — average credit score on applications, eviction rate, late-payment / NSF rate, and stable-employment percentage? A property-management company in the area should have these aggregated.
- How much new for-sale + rental construction is in the pipeline within 1–3 miles? Heavy new supply typically softens prices + rents 12–24 months out; constrained supply supports both.
Investment metrics
- 1% rule
- 0.79% ✗
- Cap rate
- 6.30%
- Cash-on-cash
- 0.02%
- DSCR
- 1.00
- GRM
- 10.6
CMA / ARV
- ARV (median comp)
- $188,270
- List price
- $207,900
- Delta
- 10.43%
- Verdict
- OVERPRICED
- Comps
- 20 within 1.0 mi
Show comp detail 11 sales within ~0.75 mi
| Address | Dist | Beds/Ba | Sqft | Sold | Price | $/sf | Match |
|---|---|---|---|---|---|---|---|
| 105 Sir Lancelot Ave | 0.00mi | 4/1.0 (+1) | 1,175 (0%) | 1mo | $203,500 | $173 | 92 |
| 104 King Arthur Dr | 0.12mi | 3/2.0 | 1,188 (+1%) | 17mo | $184,950 | $156 | 76 |
| 106 King Arthur Dr | 0.11mi | 3/2.0 | 1,118 (-5%) | 21mo | $175,000 | $157 | 67 |
| 106 Lady Elaine Dr | 0.05mi | 3/2.0 | 1,312 (+12%) | 16mo | $149,900 | $114 | 62 |
| 219 Baileys Way | 0.54mi | 3/2.0 | 1,144 (-3%) | 9mo | $179,900 | $157 | 61 |
| 207 Baileys Way | 0.60mi | 3/2.0 | 1,088 (-7%) | 7mo | $185,000 | $170 | 52 |
| 500 Brookstone Dr | 0.42mi | 3/2.0 | 1,292 (+10%) | 14mo | $246,600 | $191 | 51 |
| 124 Woodridge Cir | 0.54mi | 3/2.0 | 1,335 (+14%) | 0mo | $235,000 | $176 | 50 |
| 605 Brookstone Dr | 0.51mi | 3/2.0 | 1,222 (+4%) | 24mo | $249,900 | $205 | 48 |
| 45 N Cary St | 0.73mi | 3/2.0 | 1,102 (-6%) | 12mo | $198,900 | $180 | 43 |
| 47 N Cary St | 0.72mi | 3/2.0 | 1,102 (-6%) | 14mo | $204,000 | $185 | 42 |
Match score weights: distance 35% · size 25% · config 20% · recency 20%. Top-matched comps best support the ARV.
Projected returns pro-forma
-3.0% appreciation · 4.95% rent growth · sell at horizon
- IRR
- -14.4%
- Equity multiple
- 0.48×
- Total profit
- $-30,421
- Equity at exit
- $30,999
- IRR
- -3.0%
- Equity multiple
- 0.78×
- Total profit
- $-12,665
- Equity at exit
- $17,975
Cash invested: $58,212 (down + closing). Projections, not guarantees.
Landlord ↔ Tenant lean methodology
- Overall (STATE)
- 90 Strongly Landlord-Friendly
- State Georgia
- 90 Strongly Landlord-Friendly · R+3
- County
- — inherits STATE
- City
- — inherits STATE
ZIP-level market 30241
- Home prices YoY
- -3.6%
- Rents YoY
- 5.0%
- Active inventory
- 277
- Price-to-rent
- 10.6×
Monthly cashflow live
- Estimated rent
- $1,641 high interval (Pro) →
- Mortgage (P&I)
- −$1,090
- Tax from tax record
- −$119 /mo · $1,425/yr
- Insurance
- −$87
- HOA
- −$0
- Vacancy / Maint / Mgmt
- −$345
- Net cashflow
- $1
Break-even live
Sensitivity live
| Price | -10% $118 | -5% $60 | +0% $1 | +5% $-58 | +10% $-117 |
|---|---|---|---|---|---|
| Rent | -10% $-129 | -5% $-64 | +0% $1 | +5% $66 | +10% $130 |
| Rate | -1.0pp $105 | -0.5pp $54 | base $1 | +0.5pp $-53 | +1.0pp $-108 |
UW: 25.0% down · 7.5% · 30yr · 1.5% tax · 5.0% vac · 8.0% maint · 8.0% mgmt
Financing live
Cash to close
- Down payment
- $51,975
- Closing costs
- $6,237
- Reserves months
- —
- Total cash needed
- —
Loan-product check · same deal, 3 products live
Conventional
25% down · 7.5% · 30yr
- Down + closing
- —
- Monthly P&I
- —
- Monthly cashflow
- —
- DSCR
- —
- Eligible?
- —
Personal DTI + credit; lowest rate.
DSCR
20% down · 8.5% · 30yr
- Down + closing
- —
- Monthly P&I
- —
- Monthly cashflow
- —
- DSCR
- —
- Eligible?
- —
No personal income docs; deal must DSCR.
Hard money
10% down · 12.0% · 12mo
- Down + closing
- —
- Monthly P&I
- —
- Monthly cashflow
- —
- DSCR
- —
- Eligible?
- —
Short-term bridge; refi at stabilization.
Rent comps 8 comps
| Address | Beds | Baths | Sqft | Rent | $/sqft | DOM | Units | Dist |
|---|---|---|---|---|---|---|---|---|
| 1235 Hogansville Rd LaGrange, GA | 3.0 | 2.0 | 1263 | $1,555 | $1.23 | 45d | 1 | 0.46mi |
| 150 Mill Creek Pkwy LaGrange, GA | 1.0–2.0 | 1.0–2.0 | 954 | $1,465 | $1.53 | 45d | 11 | 0.48mi |
| 151 S Davis Rd LaGrange, GA | 3.0 | 1.0–2.0 | 940 | $1,887 | $2.01 | 0d | 30 | 0.53mi |
| 140 N Davis Rd LaGrange, GA | 1.0–3.0 | 1.0–2.0 | 983 | $1,719 | $1.75 | 4d | 14 | 0.64mi |
| 102 Peachtree Ct Lagrange, GA | 2.0 | 1.0 | 1120 | $1,050 | $0.94 | 45d | 1 | 0.86mi |
| 1 Canopy Crest WAY LaGrange, GA | 2.0–4.0 | 2.5–3.0 | 1442 | $2,285 | $1.58 | 5d | 9 | 0.90mi |
| 55 Patillo Rd LaGrange, GA | 2.0 | 2.0 | 1250 | $1,050 | $0.84 | 45d | 1 | 1.37mi |
| 300 Commerce Ave LaGrange, GA | 1.0–3.0 | 1.0–2.0 | 1248 | $2,086 | $1.67 | 0d | 23 | 1.45mi |
Listing history 2 events
-
2026-05-11status Under Contract 942-char remark
-
2026-05-06$207,900 New 942-char remark
ⓘ Source: listings_history table (triggers on properties + properties_extension) + one-shot
backfill from property_details.listing_events for pre-trigger history.
Tax reassessment forecast GA · Resets to sale price
- Current annual tax
- $1,425 · $119/mo
- Projected year-2 tax
- $1,913 · $159/mo
- Expected delta
- +$488/yr (+$41/mo · 34.2%)
ⓘ Screening estimate from a state-policy table — verify with the county assessor before closing.
Climate risk First Street
- Flood 1/10 Low FEMA zone X (unshaded) · 0% chance over 30 yrs
- Wildfire 3/10 Moderate
- Heat 6/10 Major 7 d/yr ≥105°F today · 19 d/yr by 30 yrs out
- Wind 6/10 Major 53% chance of damaging wind over 30 yrs
- Air quality 4/10 Moderate 4 unhealthy d/yr today · 5 by 30 yrs out
Nearby sold comps map
Loading sold comps map…
Walkable amenities ~0.75 mi
Loading nearby amenities…
Taxation est. · year 1
- Rental income
- $19,692
- − Mortgage interest
- −$11,646
- − Property taxes
- −$1,425
- − Insurance
- −$1,040
- − Repairs & maintenance
- −$1,575
- − Management
- −$1,575
- − Depreciation
- −$6,048
- Taxable loss
- −$3,617
- Est. tax savings @ 24.0%
- +$868
- After-tax cash flow
- $877/yr
For passive investors: Depreciation is non-cash, so a rental often shows a tax loss while cash-flowing — sheltering income. Rental losses are passive: they offset passive income freely, and up to $25,000/yr can offset ordinary (W-2) income if you actively participate and your MAGI is under $100k (phasing out to $0 by $150k); unused losses carry forward. On sale, claimed depreciation is recaptured at up to 25%, and gains may owe capital-gains tax (a 1031 exchange can defer both). Figures are a year-1 estimate at your 24.0% rate — not tax advice; consult a CPA.
Schools (NCES district)
- District
- Troup County
- NCES district ID
- 1300001
- Math proficiency
- 26% ▼ -10.00%
- Reading proficiency
- 29% ▼ -4.00%
- Median HH income
- $41,354
- Composite
- 23.3/100
- National rank
- #7920
- State rank
- #109 of 174 in GA
Livability — LaGrange
- Score
- 60/100
- State rank
- #393
- US rank
- #19555
Category grades
Schools grade is shown separately in the Schools card above.
Census & demographics
- Census place
- LaGrange, GA
- County
- Troup County · 57,111 people
- City population
- 57,111
- Metro
- LaGrange, GA-AL
- Population (ZIP)
- 25,840
- Household income
- $49,053
- Rent vs Own
- Severe rent burden
- 1383.0
Population outlook (Troup County) Hauer SSP2
- Today (2025)
- 75,537 people
- By 2030
- 78,250 · +3.6%
- By 2040
- 83,184 · +10.1%
- By 2050
- 87,167 · +15.4%
- By 2075
- 95,643 · +26.6%
- By 2100
- 94,234 · +24.8%
Race, ethnicity, and origin ACS 2023
- Neighborhood character
- Diverse neighborhood (Simpson 0.58)
- Race & ethnicity
- Black 46% White 46% Hispanic / Latino 3% Asian 3% Two or more races 2%
- Common ancestry
- Lithuanian 1% Hispanic 1% Italian 1%
- Foreign-born
- 4% · South Korea, Canada
- Languages at home
- 93% English-only · Spanish 3% Korean 2% Other Indo-European 1%
Political lean MEDSL · Troup
- 2024 margin
- Strong R (+24.4) · D 37.6% · R 62.0%
- 2008→2024 swing
- -5.4pp toward R · 2008: -19.0pp · 2024: -24.4pp
- All cycles
- 2024: R+24.4 2020: R+21.9 2016: R+23.4 2012: R+17.8 2008: R+19.0
Not yet ingested
- Civics
- —
Market trends
- HPI YoY
- ▼ -10.51%
- Current HPI
- 277.9099
- Rent YoY
- ▲ 4.95%
- Metro
- LaGrange, GA-AL
- State GDP YoY
- ▲ 2.66%
- F500 in state
- 28
Industry mix (Fortune 500 HQ in GA)
| Industry | F500 HQs | Revenue |
|---|---|---|
| Paper / Packaging | 2 | $29B |
|
||
| Retail | 1 | $160B |
|
||
| Transportation / Logistics | 1 | $91B |
|
||
| Airlines | 1 | $62B |
|
||
| Consumer Goods | 1 | $47B |
|
||
| Utilities | 1 | $25B |
|
||
Price history
-99.2% since first listed7 events — show timeline
- 2026-06-03 Rental Removed $1,650 REDFIN
- 2026-06-01 Listed for Rent $1,650 REDFIN
- 2026-05-27 Sold (Public Records) $203,500 Public Records
- 2026-05-26 Listing Removed — GAMLS
- 2026-05-22 Sold (MLS) $203,500 GAMLS
- 2026-05-11 Pending — GAMLS
- 2026-05-06 Listed $207,900 GAMLS
Property tax history
+4.1%/yrLatest (2025): $1,425 · +50.1% YoY. Source: county tax records.
Cash-flow waterfall
monthlySold comps — $/sqft
last 12 mo · ≤1 miLoading sold comps…