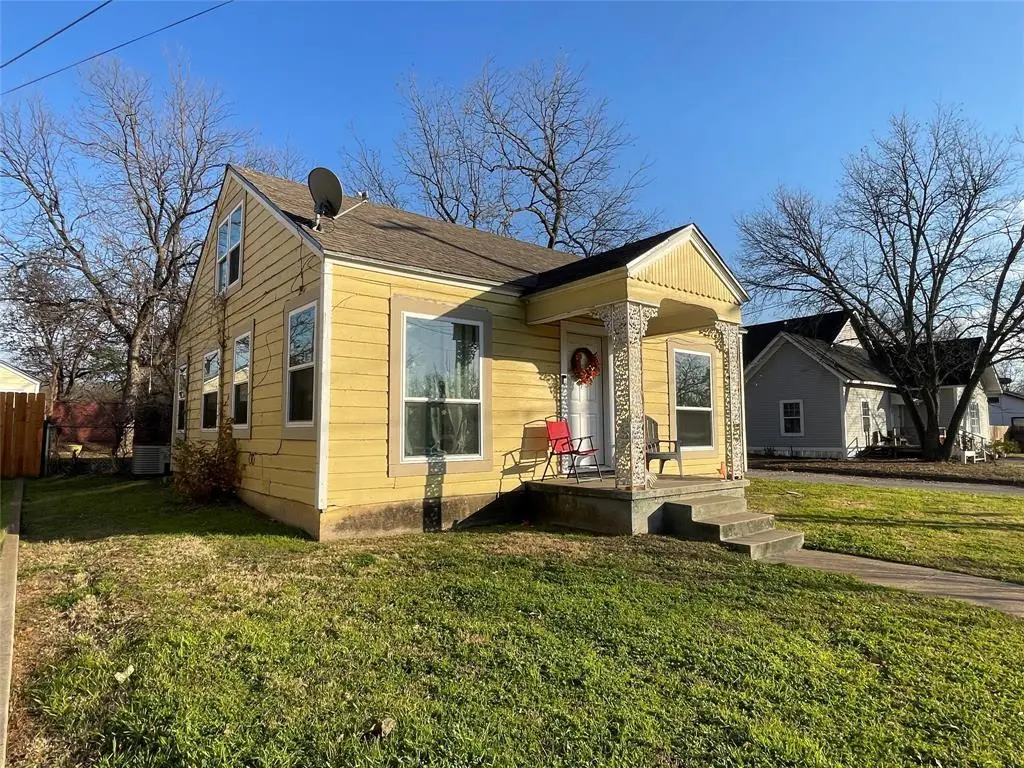
1702 NW 1st Ave · Mineral Wells, TX
Flood risk 1/10 · Minimal
- FEMA flood zone
- X (unshaded)
- Chance of flooding over 30 yrs
- 0.0%
- Est. flood insurance / yr
- $507 – $1,088
Fire risk 7/10 · Major
- Est. fire insurance / yr
- $1,222 – $2,270
Heat risk 7/10 · Major
- Hot days now (above 109°F)
- 7 days/yr
- Hot days in 30 yrs
- 22 days/yr
Wind risk 4/10 · Minor
- Chance of severe wind over 30 yrs
- 16.0%
Air-quality risk 2/10 · Minimal
- Unhealthy air days now
- 1 days/yr
- Unhealthy air days in 30 yrs
- 1 days/yr
Risk factors via First Street. Map © Google.
Why this score? — see what drove the D grade
The composite is a weighted blend of 9 inputs, each scored 0–100. Each bar is that input's sub-score; the figure is the points it added to the 100-point composite (weight × sub-score).
- Cash flow +15.0/30.0
- ARV discount +8.7/15.0
- DSCR +4.6/10.0
- 1% rule +3.9/10.0
- Livability +3.6/5.0
- Rent growth +2.5/5.0
- Schools +2.5/10.0
- Condition / age +2.5/5.0
- Appreciation +0.0/10.0
$164,900
🖨 Deal sheet (PDF) 📄 Offer letter ✓ Due diligence
Listing remarks MLS
Updated 1940s Mineral Wells Bungalow This charming bungalow perfectly balances vintage character with extensive modern upgrades. The home has been thoughtfully enhanced throughout, starting with all-new windows and a replaced front door that boost both curb appeal and energy efficiency. The kitchen shines with newer countertops, an added dishwasher, and expanded storage featuring upper cabinets over the stove and refrigerator. Fresh flooring flows seamlessly through the kitchen, laundry room, bathroom, and upstairs bedroom for a cohesive, updated look. The dedicated laundry room maximizes functionality with newer upper cabinets over the washer and dryer, plus a tall corner cabinet for additional storage. Upstairs access has been improved with completely redone stairs, and the upstairs bedroom closet now includes a convenient hanging bar. Bathroom updates include refreshed plumbing fixtures, improved wall finishing behind the toilet and tub & shower area, and a newer window that floods the space with natural light. The front bedroom features a properly rehung closet door for smooth operation. An excellent opportunity for first-time buyers or investors seeking a move-in-ready home with classic charm and modern conveniences.
Key facts
- Currently leased
- Investment property
- 5,009 sq ft lot
Tags
Neighborhood map
What this means for you Summary
Snapshot
- This is a 3-bed/1.0-bath single-family listed at $165k.
Deal economics
- At list price, monthly cash flow is $51 ($607/yr) — positive.
- The deal already cash-flows at list — no discount required.
- To meet the 1% rule (rent ≥ 1% of price), the offer needs to be $147k (11.0% below list).
- Recommended offer: $145k (12.0% below list) — sets the bar for market timing.
- Cap rate 6.7% vs local median 2.8% in Mineral Wells — top-decile yield for the area; either an underpriced asset or a hidden risk that comps aren't pricing in. Stress-test before assuming the spread holds.
Location & tenants
- Location reads 72/100 on livability (#278 in TX) — a middle-class / working-renter tenant base. Strengths: cost of living A+, housing A+, health & safety A+; Watch: crime D+, employment D, amenities F.
- Mineral Wells ISD (town): math 30% / reading 30% proficiency, ranked #636 of 826 in TX (top 77%) — families likely to look elsewhere, expect single-tenant / working-renter base with shorter leases.
- Zoned schools: Mineral Wells El (math 36% / reading 28%, grade F, #2,268 of 4,322 statewide, top 55%, 1,915 students, 79% FRL); Mineral Wells J H (math 26% / reading 31%, grade F, #1,122 of 1,662 statewide, top 69%, 498 students, 75% FRL); Mineral Wells H S (math 15% / reading 33%, grade F, #1,333 of 1,632 statewide, top 82%, 920 students, 74% FRL) — zoned schools average 76% FRL vs 58% district-wide (18 pts higher); higher-poverty schools than district average — tighter screening recommended.
- Market conditions: 279 active listings in the ZIP; 1 comparable units currently listed for rent nearby; 27 units permitted in Palo Pinto County in 2024 (0 in 5+ unit buildings).
Forward outlook
- Local home prices are declining (-3.0%/yr); year-one equity from $1k of loan paydown is wiped out by about $5k of value loss. Plan a longer hold.
- Palo Pinto County population projected to shrink 8% by 2050 — rents likely to lag national; underwrite the cash flow, not the appreciation.
Negotiation context
- It's been on market 188 days — a 12% lower offer ($145k) is reasonable based on typical stale-listing flexibility.
- 5 sale attempts since 15y ago with the ask held roughly flat each time — persistent listings suggest the price (not the market) is what's stuck; bring a comps-based counter.
Risks & watch-outs
- Watch-outs: built in 1940 — expect roof / HVAC / electrical / plumbing capex.
- Climate carrying-cost: major wildfire risk; extreme-heat days projected 7→22/yr by 2055 (HVAC capex compounding) — expect insurance premiums to compound above CPI over the hold.
Questions for the listing agent
- It's been on market 188 days. Have you received any prior offers? Is the seller open to a 12% concession, seller financing, or rate buy-down credit?
- Built in 1940 — when were the roof, HVAC, electrical panel, plumbing, and water heater last replaced?
- Why hasn't it sold? Are there any deal-killer items the seller is aware of (foundation, flood, title, zoning, code violations)?
- Is there a deadline driving the sale (1031 exchange, divorce, estate, relocation)? That informs how much negotiation room exists.
- Schools are F-rated, which usually means shorter tenancies and higher turnover. Who's the typical renter profile here, and what's been the actual vacancy rate?
- Crime grade is D in this area — have there been break-ins, vandalism, or insurance claims at this property in the last 3 years? What carrier currently insures it and at what premium?
- The area grade is low — what's the realistic commute time and amenity access for the typical tenant pool here? Any planned neighborhood developments (good or bad) we should know about?
- What's the average days-on-market for RENTAL listings here right now (not sales)? A rising rental-DOM trend means longer vacancies and softer asking-rent achievability than the comps imply.
- What's the recent tenant-quality profile in this submarket — average credit score on applications, eviction rate, late-payment / NSF rate, and stable-employment percentage? A property-management company in the area should have these aggregated.
- How much new for-sale + rental construction is in the pipeline within 1–3 miles? Heavy new supply typically softens prices + rents 12–24 months out; constrained supply supports both.
Investment metrics
- 1% rule
- 0.89% ✗
- Cap rate
- 6.66%
- Cash-on-cash
- 1.31%
- DSCR
- 1.06
- GRM
- 9.4
CMA / ARV
- ARV (median comp)
- $169,400
- List price
- $164,900
- Delta
- -2.66%
- Verdict
- FAIR
- Comps
- 20 within 1.0 mi
Show comp detail 10 sales within ~0.75 mi
| Address | Dist | Beds/Ba | Sqft | Sold | Price | $/sf | Match |
|---|---|---|---|---|---|---|---|
| 1205 5th Ave | 0.32mi | 3/2.0 | 1,270 (+1%) | 4mo | $172,000 | $135 | 76 |
| 1615 N Oak Ave | 0.03mi | 3/2.0 | 1,413 (+12%) | 4mo | $185,000 | $131 | 70 |
| 2007 NW 2nd Ave | 0.17mi | 3/1.0 | 1,386 (+10%) | 11mo | $164,000 | $118 | 66 |
| 316 NE 23rd St | 0.33mi | 3/2.0 | 1,306 (+4%) | 13mo | $225,000 | $172 | 63 |
| 617 NW 9th St | 0.47mi | 3/2.0 | 1,346 (+7%) | 2mo | $150,000 | $111 | 60 |
| 613 NE 6th Ave | 0.63mi | 3/1.0 | 1,306 (+4%) | 6mo | $114,900 | $88 | 59 |
| 916 5th Ave | 0.41mi | 2/1.0 (-1) | 1,191 (-5%) | 10mo | $119,990 | $101 | 59 |
| 2101 3rd Ave | 0.22mi | 3/2.0 | 1,428 (+14%) | 13mo | $199,000 | $139 | 52 |
| 400 NW 11th St NW | 0.25mi | 3/2.0 | 1,435 (+14%) | 13mo | $234,900 | $164 | 49 |
| 76 Olsen 1st | 0.56mi | 3/1.5 | 1,379 (+10%) | 14mo | $275,000 | $199 | 44 |
Match score weights: distance 35% · size 25% · config 20% · recency 20%. Top-matched comps best support the ARV.
Projected returns pro-forma
-3.0% appreciation · 3.0% rent growth · sell at horizon
- IRR
- -14.2%
- Equity multiple
- 0.49×
- Total profit
- $-23,497
- Equity at exit
- $24,587
- IRR
- -5.4%
- Equity multiple
- 0.65×
- Total profit
- $-16,300
- Equity at exit
- $14,258
Cash invested: $46,172 (down + closing). Projections, not guarantees.
Landlord ↔ Tenant lean methodology
- Overall (STATE)
- 87 Strongly Landlord-Friendly
- State Texas
- 87 Strongly Landlord-Friendly · R+5
- County
- — inherits STATE
- City
- — inherits STATE
ZIP-level market 76067
- Active inventory
- 279
- Price-to-rent
- 9.4×
Monthly cashflow live
- Estimated rent
- $1,468 medium interval (Pro) →
- Mortgage (P&I)
- −$865
- Tax from tax record
- −$175 /mo · $2,105/yr
- Insurance
- −$69
- HOA
- −$0
- Vacancy / Maint / Mgmt
- −$308
- Net cashflow
- $51
Break-even live
Sensitivity live
| Price | -10% $144 | -5% $97 | +0% $51 | +5% $4 | +10% $-43 |
|---|---|---|---|---|---|
| Rent | -10% $-65 | -5% $-7 | +0% $51 | +5% $109 | +10% $167 |
| Rate | -1.0pp $134 | -0.5pp $93 | base $51 | +0.5pp $8 | +1.0pp $-36 |
UW: 25.0% down · 7.5% · 30yr · 1.5% tax · 5.0% vac · 8.0% maint · 8.0% mgmt
Financing live
Cash to close
- Down payment
- $41,225
- Closing costs
- $4,947
- Reserves months
- —
- Total cash needed
- —
Loan-product check · same deal, 3 products live
Conventional
25% down · 7.5% · 30yr
- Down + closing
- —
- Monthly P&I
- —
- Monthly cashflow
- —
- DSCR
- —
- Eligible?
- —
Personal DTI + credit; lowest rate.
DSCR
20% down · 8.5% · 30yr
- Down + closing
- —
- Monthly P&I
- —
- Monthly cashflow
- —
- DSCR
- —
- Eligible?
- —
No personal income docs; deal must DSCR.
Hard money
10% down · 12.0% · 12mo
- Down + closing
- —
- Monthly P&I
- —
- Monthly cashflow
- —
- DSCR
- —
- Eligible?
- —
Short-term bridge; refi at stabilization.
Rent comps 1 comps
| Address | Beds | Baths | Sqft | Rent | $/sqft | DOM | Units | Dist |
|---|---|---|---|---|---|---|---|---|
| 513 SE 6th St Unit 6 Mineral Wells, TX | 2.0 | 1.0 | 1200 | $1,350 | $1.12 | 45d | 1 | 1.14mi |
Listing history 30 events
-
2026-06-22days on market $164,900 Active 188 DOM
-
2026-06-21days on market $164,900 Active 187 DOM
-
2026-06-19days on market $164,900 Active 185 DOM
-
2026-06-18days on market $164,900 Active 184 DOM
-
2026-06-17days on market $164,900 Active 183 DOM
-
2026-06-16days on market $164,900 Active 182 DOM
-
2026-06-15days on market $164,900 Active 181 DOM
-
2026-06-14days on market $164,900 Active 179 DOM
-
2026-06-12days on market $164,900 Active 178 DOM
-
2026-06-09days on market $164,900 Active 175 DOM
-
2026-06-08days on market $164,900 Active 174 DOM
-
2026-06-07days on market $164,900 Active 173 DOM
-
2026-06-07days on market $164,900 Active 172 DOM
-
2026-06-04days on market $164,900 Active 169 DOM
-
2026-06-02days on market $164,900 Active 168 DOM
-
2026-06-01days on market $164,900 Active 167 DOM
-
2026-05-31days on market $164,900 Active 166 DOM
-
2026-05-31days on market $164,900 Active 165 DOM
-
2025-12-15$164,900 Active 1250-char remark
Show marketing remark (1250 chars)
Updated 1940s Mineral Wells Bungalow This charming bungalow perfectly balances vintage character with extensive modern upgrades. The home has been thoughtfully enhanced throughout, starting with all-new windows and a replaced front door that boost both curb appeal and energy efficiency. The kitchen shines with newer countertops, an added dishwasher, and expanded storage featuring upper cabinets over the stove and refrigerator. Fresh flooring flows seamlessly through the kitchen, laundry room, bathroom, and upstairs bedroom for a cohesive, updated look. The dedicated laundry room maximizes functionality with newer upper cabinets over the washer and dryer, plus a tall corner cabinet for additional storage. Upstairs access has been improved with completely redone stairs, and the upstairs bedroom closet now includes a convenient hanging bar. Bathroom updates include refreshed plumbing fixtures, improved wall finishing behind the toilet and tub & shower area, and a newer window that floods the space with natural light. The front bedroom features a properly rehung closet door for smooth operation. An excellent opportunity for first-time buyers or investors seeking a move-in-ready home with classic charm and modern conveniences.
-
2025-08-19historical $1,095
-
2025-08-17historical $1,095
-
2025-08-12$1,095
-
2025-07-08$1,095
-
2023-10-27historical $995
-
2023-10-14$995
-
2011-07-01historical
-
2011-01-03$53,500 Active
-
2003-12-17soldstatus
-
2003-11-05soldstatus
-
2002-07-11soldstatus
ⓘ Source: listings_history table (triggers on properties + properties_extension) + one-shot
backfill from property_details.listing_events for pre-trigger history.
Tax reassessment forecast TX · Resets to sale price
- Current annual tax
- $2,105 · $175/mo
- Projected year-2 tax
- $3,018 · $251/mo
- Expected delta
- +$913/yr (+$76/mo · 43.4%)
ⓘ Screening estimate from a state-policy table — verify with the county assessor before closing.
Climate risk First Street
- Flood 1/10 Low FEMA zone X (unshaded) · 0% chance over 30 yrs
- Wildfire 7/10 Severe
- Heat 7/10 Severe 7 d/yr ≥109°F today · 22 d/yr by 30 yrs out
- Wind 4/10 Moderate 16% chance of damaging wind over 30 yrs
- Air quality 2/10 Low 1 unhealthy d/yr today · 1 by 30 yrs out
Nearby sold comps map
Loading sold comps map…
Walkable amenities ~0.75 mi
Loading nearby amenities…
Taxation est. · year 1
- Rental income
- $17,612
- − Mortgage interest
- −$9,237
- − Property taxes
- −$2,105
- − Insurance
- −$824
- − Repairs & maintenance
- −$1,409
- − Management
- −$1,409
- − Depreciation
- −$4,797
- Taxable loss
- −$2,170
- Est. tax savings @ 24.0%
- +$521
- After-tax cash flow
- $1,128/yr
For passive investors: Depreciation is non-cash, so a rental often shows a tax loss while cash-flowing — sheltering income. Rental losses are passive: they offset passive income freely, and up to $25,000/yr can offset ordinary (W-2) income if you actively participate and your MAGI is under $100k (phasing out to $0 by $150k); unused losses carry forward. On sale, claimed depreciation is recaptured at up to 25%, and gains may owe capital-gains tax (a 1031 exchange can defer both). Figures are a year-1 estimate at your 24.0% rate — not tax advice; consult a CPA.
Schools (NCES district)
- District
- Mineral Wells ISD
- NCES district ID
- 4830950
- Math proficiency
- 30% ▼ -10.00%
- Reading proficiency
- 30% ▼ -5.00%
- Median HH income
- $40,027
- Composite
- 25.26/100
- National rank
- #7500
- State rank
- #636 of 826 in TX
Livability — Mineral Wells
- Score
- 72/100
- State rank
- #278
- US rank
- #6474
Category grades
Schools grade is shown separately in the Schools card above.
Census & demographics
- Census place
- Mineral Wells, TX
- County
- Palo Pinto County · 21,080 people
- City population
- 21,080
- Metro
- Mineral Wells, TX
- Population (ZIP)
- 21,080
- Household income
- $62,190
- Rent vs Own
- Severe rent burden
- 745.0
Population outlook (Palo Pinto County) Hauer SSP2
- Today (2025)
- 27,500 people
- By 2030
- 27,079 · -1.5%
- By 2040
- 26,135 · -5.0%
- By 2050
- 25,215 · -8.3%
- By 2075
- 23,416 · -14.9%
- By 2100
- 20,300 · -26.2%
Race, ethnicity, and origin ACS 2023
- Neighborhood character
- Predominantly White (70%)
- Race & ethnicity
- White 70% Hispanic / Latino 22% Two or more races 9% Black 4% Asian 1%
- Hispanic origin (detail)
- Mexican 19%
- Common ancestry
- Lithuanian 4% Italian 1% Slovak 1%
- Foreign-born
- 6% · Canada
- Languages at home
- 86% English-only · Spanish 13% Other Indo-European 1%
Political lean MEDSL · Palo Pinto
- 2024 margin
- Solid R (+67.1) · D 16.1% · R 83.2%
- 2008→2024 swing
- -18.9pp toward R · 2008: -48.2pp · 2024: -67.1pp
- All cycles
- 2024: R+67.1 2020: R+64.1 2016: R+64.1 2012: R+59.8 2008: R+48.2
Not yet ingested
- Civics
- —
Market trends
- HPI YoY
- ▼ -134.09%
- Current HPI
- 240.3647
- Rent YoY
- —
- Metro
- Mineral Wells, TX
- State GDP YoY
- ▲ 3.95%
- F500 in state
- 110
Industry mix (Fortune 500 HQ in TX)
| Industry | F500 HQs | Revenue |
|---|---|---|
| Energy | 16 | $1,198B |
|
||
| Technology | 5 | $198B |
|
||
| Engineering / Construction | 4 | $72B |
|
||
| Energy Services | 3 | $60B |
|
||
| Utilities | 3 | $41B |
|
||
| Healthcare | 2 | $330B |
|
||
Price history
+208.2% since first listed12 events — show timeline
- 2025-12-15 Listed $164,900 NTREIS
- 2025-08-19 Rental Removed $1,095 RENTEC
- 2025-08-17 Rental Removed $1,095 NTREIS
- 2025-08-12 Listed for Rent $1,095 NTREIS
- 2025-07-08 Listed for Rent $1,095 RENTEC
- 2023-10-27 Rental Removed $995 RENTEC
- 2023-10-14 Listed for Rent $995 RENTEC
- 2011-07-01 Listing Removed — NTREIS
- 2011-01-03 Listed $53,500 NTREIS
- 2003-12-17 Sold (Public Records) — Public Records
- 2003-11-05 Sold (Public Records) — Public Records
- 2002-07-11 Sold (Public Records) — Public Records
Property tax history
+10.6%/yrLatest (2025): $2,105 · -1.4% YoY. Source: county tax records.
Cash-flow waterfall
monthlySold comps — $/sqft
last 12 mo · ≤1 miLoading sold comps…