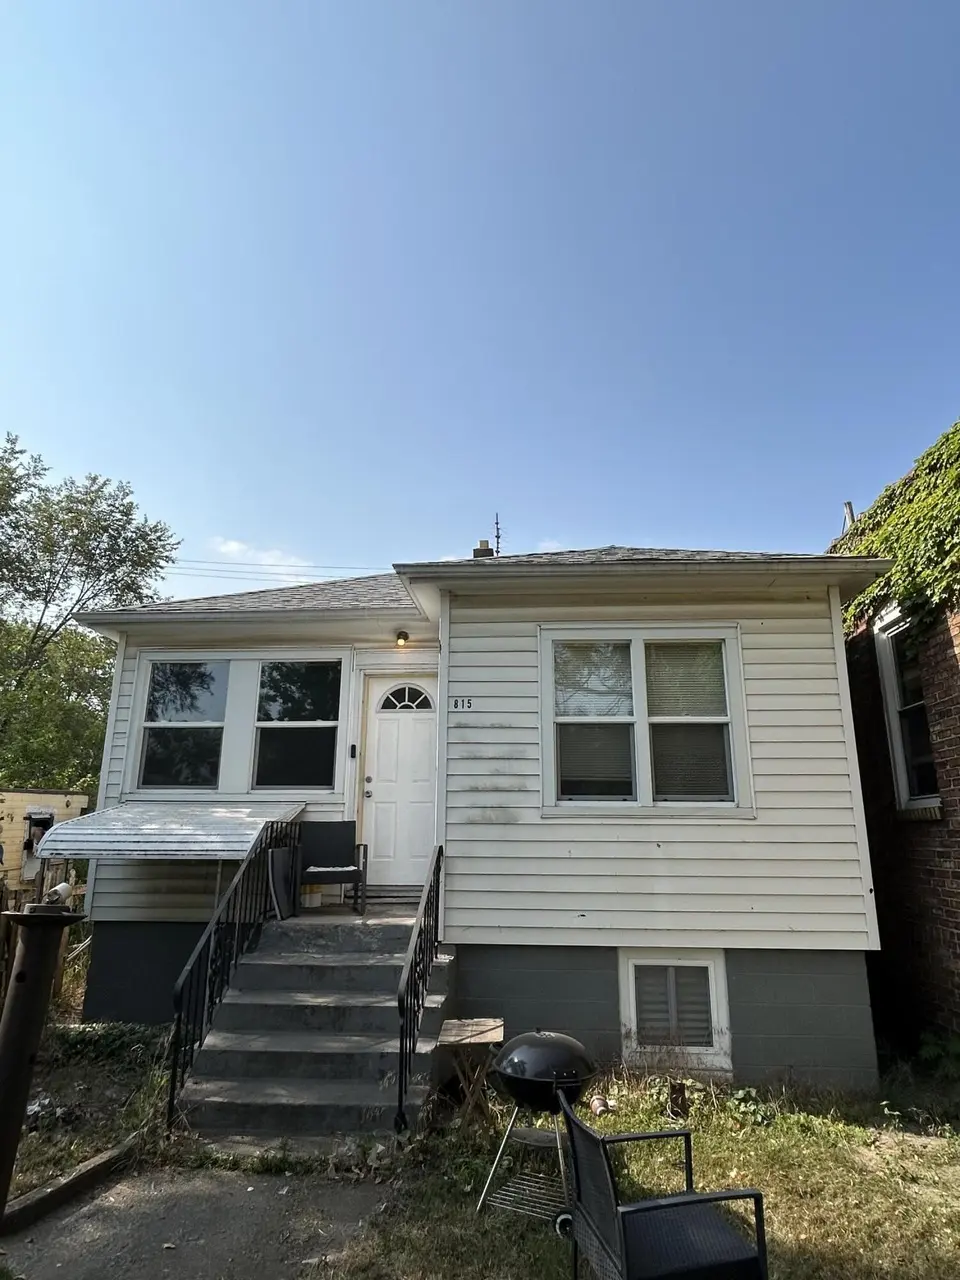
815 W 25th Ave · Gary, IN
Flood risk 4/10 · Minor
- FEMA flood zone
- X (unshaded)
- Chance of flooding over 30 yrs
- 0.2%
- Est. flood insurance / yr
- $473 – $860
Fire risk 1/10 · Minimal
- Est. fire insurance / yr
- $717 – $1,331
Heat risk 3/10 · Minor
- Hot days now (above 102°F)
- 7 days/yr
- Hot days in 30 yrs
- 15 days/yr
Wind risk 2/10 · Minimal
- Chance of severe wind over 30 yrs
- 0.0%
Air-quality risk 4/10 · Minor
- Unhealthy air days now
- 6 days/yr
- Unhealthy air days in 30 yrs
- 7 days/yr
Risk factors via First Street. Map © Google.
Why this score? — see what drove the B grade
The composite is a weighted blend of 9 inputs, each scored 0–100. Each bar is that input's sub-score; the figure is the points it added to the 100-point composite (weight × sub-score).
- Cash flow +30.0/30.0
- DSCR +10.0/10.0
- 1% rule +9.6/10.0
- ARV discount +7.5/15.0
- Appreciation +5.5/10.0
- Condition / age +3.8/5.0
- Livability +3.7/5.0
- Rent growth +2.5/5.0
- Schools +0.5/10.0
$90,500
🖨 Deal sheet 📄 Offer letter ✓ Due diligence
Listing remarks MLS
Stop Renting--Start Building Your Future! Own your first home and start building equity with this affordable 3-bedroom, 1-bath raised ranch--a perfect opportunity for first-time buyers or anyone ready to make the move from renting to owning. This home features a full basement and solid fundamentals, with major updates already completed--including a roof and windows just 3 years old--giving you peace of mind on the big-ticket items. Inside, you'll find a great layout with plenty of potential to make it your own over time. Currently tenant-occupied on a month-to-month basis, offering flexibility for a smoother transition at closing. Whether you're tired of rising rent or ready to invest in your future, this home offers a smart, affordable path to ownership. INVESTORS - Currently occupied by a reliable long-term tenant on a month-to-month lease at 1,000/month, this reflects a stable, below-market rent typical of long-term occupancy--providing an opportunity for future increases. At the current asking price, the property delivers an estimated 10.0 cap rate with 12,000 annual gross income and minimal vacancy risk. Property is located in a strong rental area, you may also want to explore local Section 8 Housing Choice Voucher Program payment standards, which could support higher rental income and improved returns, depending on qualification and tenant placement. Sold As-Is, this property offers both immediate cash flow and value-add potential through rent adjustments or light improvements. Whether you're building your portfolio or entering the market, this is a cash-flowing asset ready to perform from day one. Sold As-Is. Schedule your private showing today and take the first step toward owning your home!
Key facts
- Full basement
- Roof and windows
- Major updates
Tags
Neighborhood map
What this means for you Summary
Snapshot
- This is a 2-bed/1.0-bath single-family listed at $90k. Condition is rated good.
Deal economics
- At list price, monthly cash flow is $417 ($5k/yr) — positive.
- The deal already cash-flows at list — no discount required.
- Meets the 1% rule at list price ($1k rent vs $90k).
- Recommended offer: $88k (3.0% below list) — sets the bar for market timing.
- Cap rate 11.8% vs local median 9.1% in Gary — meaningfully above typical; check what's discounted (condition, days-on-market, listing class) to confirm the premium yield is real.
Location & tenants
- Location reads 73/100 on livability (#105 in IN) — a middle-class / working-renter tenant base. Strengths: commute A+, cost of living A+, housing A+; Watch: schools F, crime F, employment F.
- Gary Community School Corporation (urban): math 3% / reading 11% proficiency, ranked #299 of 301 in IN (top 99%) — low school quality limits family demand, transient renter base, plan for 1-2y turnover; 80% free/reduced lunch — lower-income household profile, screen leases tightly.
- Market conditions: 121 active listings in the ZIP; 8 comparable units currently listed for rent nearby; rentals leasing fast (median 1d on market — plan ~1-2 weeks tenant-placement turnaround); lower-income renter base — watch delinquency; 1,642 units permitted in Lake County in 2024 (14 in 5+ unit buildings).
- At $1,325/mo this rent would consume 56% of the median local household income ($29k/yr) (locally 392% of renters already pay >50% of income on rent) — very limited rent-growth headroom before tenants either downsize or default.
Forward outlook
- In year one you build about $2k of equity ($626 loan paydown + $887 appreciation (1.0% local appreciation)).
- Lake County population projected to shrink 7% by 2050 — rents likely to lag national; underwrite the cash flow, not the appreciation.
- At projected returns (1.0% appreciation + 3.0% rent growth), your $25k cash investment doubles in ~4 years — after that, you're playing with house money.
Negotiation context
- It's been on market 58 days — a 3% lower offer ($88k) is reasonable based on typical stale-listing flexibility.
- 7 sale attempts since 3y ago; this cycle's ask has dropped $34k (28%) from the opening price — seller is motivated, your offer sets the floor, not the list.
- Current owner paid $35k; list at $90k implies a 159% gain — meaningful room to come down on a strong offer.
Risks & watch-outs
- Watch-outs: built in 1945 — expect roof / HVAC / electrical / plumbing capex.
Questions for the listing agent
- It's been on market 58 days. Have you received any prior offers? Is the seller open to a 3% concession, seller financing, or rate buy-down credit?
- Built in 1945 — when were the roof, HVAC, electrical panel, plumbing, and water heater last replaced?
- Is there a deadline driving the sale (1031 exchange, divorce, estate, relocation)? That informs how much negotiation room exists.
- Schools are F-rated, which usually means shorter tenancies and higher turnover. Who's the typical renter profile here, and what's been the actual vacancy rate?
- Crime grade is F in this area — have there been break-ins, vandalism, or insurance claims at this property in the last 3 years? What carrier currently insures it and at what premium?
- What's the average days-on-market for RENTAL listings here right now (not sales)? A rising rental-DOM trend means longer vacancies and softer asking-rent achievability than the comps imply.
- What's the recent tenant-quality profile in this submarket — average credit score on applications, eviction rate, late-payment / NSF rate, and stable-employment percentage? A property-management company in the area should have these aggregated.
- How much new for-sale + rental construction is in the pipeline within 1–3 miles? Heavy new supply typically softens prices + rents 12–24 months out; constrained supply supports both.
Investment metrics
- 1% rule
- 1.46% ✓
- Cap rate
- 11.82%
- Cash-on-cash
- 19.73%
- DSCR
- 1.88
- GRM
- 5.7
CMA / ARV
- ARV (median comp)
- $28,043
- List price
- $90,500
- Delta
- 222.71%
- Verdict
- OVERPRICED
- Comps
- 20 within 1.0 mi
Show comp detail 12 sales within ~0.75 mi
| Address | Dist | Beds/Ba | Sqft | Sold | Price | $/sf | Match |
|---|---|---|---|---|---|---|---|
| 2341 Jefferson St | 0.42mi | 2/1.0 | 1,680 (+0%) | 8mo | $17,500 | $10 | 73 |
| 2701 Madison St | 0.39mi | 2/1.0 | 1,556 (-7%) | 7mo | $90,000 | $58 | 64 |
| 2309 Buchanan St | 0.38mi | 3/1.0 (+1) | 1,760 (+5%) | 10mo | $155,000 | $88 | 60 |
| 2320 Adams St | 0.46mi | 2/1.5 | 1,580 (-6%) | 18mo | $25,000 | $16 | 52 |
| 2788-94 Madison St | 0.44mi | 2/2.0 | 1,578 (-6%) | 20mo | $50,000 | $32 | 49 |
| 2561 W Adams St | 0.43mi | 3/2.0 (+1) | 1,820 (+9%) | 11mo | $44,000 | $24 | 47 |
| 2370 Buchanan St | 0.36mi | 3/1.0 (+1) | 1,464 (-12%) | 13mo | $120,000 | $82 | 47 |
| 2284 Pennsylvania St | 0.75mi | 2/1.5 | 1,720 (+3%) | 22mo | $14,900 | $9 | 40 |
| 2137 Hayes St | 0.71mi | 3/1.5 (+1) | 1,590 (-5%) | 20mo | $103,000 | $65 | 35 |
| 488 W 22nd Pl | 0.39mi | 3/2.0 (+1) | 1,464 (-12%) | 23mo | $129,900 | $89 | 33 |
| 926 Charles Hawkins Dr | 0.66mi | 1/1.0 (-1) | 1,450 (-13%) | 12mo | $105,000 | $72 | 32 |
| 644 W 19th Pl | 0.74mi | 3/2.0 (+1) | 1,477 (-12%) | 18mo | $200,000 | $135 | 23 |
Match score weights: distance 35% · size 25% · config 20% · recency 20%. Top-matched comps best support the ARV.
Projected returns pro-forma
0.98% appreciation · 3.0% rent growth · sell at horizon
- IRR
- 21.8%
- Equity multiple
- 2.11×
- Total profit
- $28,159
- Equity at exit
- $30,799
- IRR
- 24.8%
- Equity multiple
- 3.99×
- Total profit
- $75,665
- Equity at exit
- $40,855
Cash invested: $25,340 (down + closing). Projections, not guarantees.
Landlord ↔ Tenant lean methodology
- Overall (STATE)
- 90 Strongly Landlord-Friendly
- State Indiana
- 90 Strongly Landlord-Friendly · R+11
- County
- — inherits STATE
- City
- — inherits STATE
ZIP-level market 46407
- Home prices YoY
- 0.4%
- Active inventory
- 121
- Price-to-rent
- 5.7×
Monthly cashflow live
- Estimated rent
- $1,325 high interval (Pro) →
- Mortgage (P&I)
- −$475
- Tax from tax record
- −$118 /mo · $1,415/yr
- Insurance
- −$38
- HOA
- −$0
- Vacancy / Maint / Mgmt
- −$278
- Net cashflow
- $417
Break-even live
UW: 25.0% down · 7.5% · 30yr · 1.5% tax · 5.0% vac · 8.0% maint · 8.0% mgmt
Financing live
Cash to close
- Down payment
- $22,625
- Closing costs
- $2,715
- Reserves months
- —
- Total cash needed
- —
Loan-product check · same deal, 3 products live
Conventional
25% down · 7.5% · 30yr
- Down + closing
- —
- Monthly P&I
- —
- Monthly cashflow
- —
- DSCR
- —
- Eligible?
- —
Personal DTI + credit; lowest rate.
DSCR
20% down · 8.5% · 30yr
- Down + closing
- —
- Monthly P&I
- —
- Monthly cashflow
- —
- DSCR
- —
- Eligible?
- —
No personal income docs; deal must DSCR.
Hard money
10% down · 12.0% · 12mo
- Down + closing
- —
- Monthly P&I
- —
- Monthly cashflow
- —
- DSCR
- —
- Eligible?
- —
Short-term bridge; refi at stabilization.
Rent comps 8 comps
| Address | Beds | Baths | Sqft | Rent | $/sqft | DOM | Units | Dist |
|---|---|---|---|---|---|---|---|---|
| 1572 Polk St Gary, IN | 3.0 | 1.0 | 1500 | $1,250 | $0.83 | 1d | 1 | 0.94mi |
| 2425 Prospect St Gary, IN | 3.0 | 1.0 | 1051 | $1,400 | $1.33 | 1d | 1 | 0.97mi |
| 2306 Vermont St Gary, IN | 3.0 | 1.5 | 1200 | $1,300 | $1.08 | 1d | 1 | 1.16mi |
| 3449 Buchanan St Gary, IN | 3.0 | 1.0 | 1301 | $1,395 | $1.07 | 43d | 1 | 1.20mi |
| 3395 Pennsylvania St Gary, IN | 3.0 | 1.0 | 1300 | $1,495 | $1.15 | 1d | 1 | 1.34mi |
| 2157 Marshall Pl Gary, IN | 3.0 | 1.5 | 1650 | $1,295 | $0.78 | 43d | 1 | 1.35mi |
| 1329 Delaware St Gary, IN | 2.0 | 1.0 | 1100 | $1,100 | $1.00 | 43d | 1 | 1.37mi |
| 3612 Van Buren St Gary, IN | 3.0 | 1.0 | 1534 | $1,600 | $1.04 | 1d | 1 | 1.40mi |
Listing history 34 events
-
2026-06-18days on market $90,500 Active 58 DOM
-
2026-06-17days on market $90,500 Active 57 DOM
-
2026-06-16days on market $90,500 Active 56 DOM
-
2026-06-15days on market $90,500 Active 55 DOM
-
2026-06-13days on market $90,500 Active 53 DOM
-
2026-06-13pricedays on market $90,500 Active 52 DOM
-
2026-06-09days on market $94,790 Active 49 DOM
-
2026-06-08days on market $94,790 Active 48 DOM
-
2026-06-07days on market $94,790 Active 47 DOM
-
2026-06-04days on market $94,790 Active 44 DOM
-
2026-06-03days on market $94,790 Active 43 DOM
-
2026-06-02days on market $94,790 Active 42 DOM
-
2026-06-01days on market $94,790 Active 41 DOM
-
2026-05-31days on market $94,790 Active 40 DOM
-
2026-05-05price $110,000 1729-char remark
Show marketing remark (1729 chars)
Stop Renting--Start Building Your Future! Own your first home and start building equity with this affordable 3-bedroom, 1-bath raised ranch--a perfect opportunity for first-time buyers or anyone ready to make the move from renting to owning. This home features a full basement and solid fundamentals, with major updates already completed--including a roof and windows just 3 years old--giving you peace of mind on the big-ticket items. Inside, you'll find a great layout with plenty of potential to make it your own over time. Currently tenant-occupied on a month-to-month basis, offering flexibility for a smoother transition at closing. Whether you're tired of rising rent or ready to invest in your future, this home offers a smart, affordable path to ownership. INVESTORS - Currently occupied by a reliable long-term tenant on a month-to-month lease at 1,000/month, this reflects a stable, below-market rent typical of long-term occupancy--providing an opportunity for future increases. At the current asking price, the property delivers an estimated 10.0 cap rate with 12,000 annual gross income and minimal vacancy risk. Property is located in a strong rental area, you may also want to explore local Section 8 Housing Choice Voucher Program payment standards, which could support higher rental income and improved returns, depending on qualification and tenant placement. Sold As-Is, this property offers both immediate cash flow and value-add potential through rent adjustments or light improvements. Whether you're building your portfolio or entering the market, this is a cash-flowing asset ready to perform from day one. Sold As-Is. Schedule your private showing today and take the first step toward owning your home!
-
2026-04-21$125,000 Active 1729-char remark
Show marketing remark (1729 chars)
Stop Renting--Start Building Your Future! Own your first home and start building equity with this affordable 3-bedroom, 1-bath raised ranch--a perfect opportunity for first-time buyers or anyone ready to make the move from renting to owning. This home features a full basement and solid fundamentals, with major updates already completed--including a roof and windows just 3 years old--giving you peace of mind on the big-ticket items. Inside, you'll find a great layout with plenty of potential to make it your own over time. Currently tenant-occupied on a month-to-month basis, offering flexibility for a smoother transition at closing. Whether you're tired of rising rent or ready to invest in your future, this home offers a smart, affordable path to ownership. INVESTORS - Currently occupied by a reliable long-term tenant on a month-to-month lease at 1,000/month, this reflects a stable, below-market rent typical of long-term occupancy--providing an opportunity for future increases. At the current asking price, the property delivers an estimated 10.0 cap rate with 12,000 annual gross income and minimal vacancy risk. Property is located in a strong rental area, you may also want to explore local Section 8 Housing Choice Voucher Program payment standards, which could support higher rental income and improved returns, depending on qualification and tenant placement. Sold As-Is, this property offers both immediate cash flow and value-add potential through rent adjustments or light improvements. Whether you're building your portfolio or entering the market, this is a cash-flowing asset ready to perform from day one. Sold As-Is. Schedule your private showing today and take the first step toward owning your home!
-
2026-01-16historical
-
2026-01-16historical
-
2025-12-17price $89,000
-
2025-12-17price $89,000
-
2025-07-29price $94,000
-
2025-07-29price $94,000
-
2025-07-16$97,500 Active
-
2025-07-16$97,500 Active
-
2023-09-27soldstatus $35,000 Closed
-
2023-09-25status Pending
-
2023-09-21historical Active Under Contract
-
2023-08-27status Active
-
2023-08-24historical Active Under Contract
-
2023-07-22status Active
-
2023-07-17historical
-
2023-07-16historical Active Under Contract
-
2023-07-14$525,000 Active
-
2023-07-14$40,000 Active
ⓘ Source: listings_history table (triggers on properties + properties_extension) + one-shot
backfill from property_details.listing_events for pre-trigger history.
Tax reassessment forecast IN · Partial reset (capped growth)
- Current annual tax
- $1,415 · $118/mo
- Projected year-2 tax
- $1,415 · $118/mo
- Expected delta
- $0/yr ($0/mo · -0.0%)
ⓘ Screening estimate from a state-policy table — verify with the county assessor before closing.
Climate risk First Street
- Flood 4/10 Moderate FEMA zone X (unshaded) · 20% chance over 30 yrs
- Wildfire 1/10 Low
- Heat 3/10 Moderate 7 d/yr ≥102°F today · 15 d/yr by 30 yrs out
- Wind 2/10 Low 0% chance of damaging wind over 30 yrs
- Air quality 4/10 Moderate 6 unhealthy d/yr today · 7 by 30 yrs out
Nearby sold comps map
Loading sold comps map…
Walkable amenities ~0.75 mi
Loading nearby amenities…
Taxation est. · year 1
- Rental income
- $15,901
- − Mortgage interest
- −$5,069
- − Property taxes
- −$1,415
- − Insurance
- −$452
- − Repairs & maintenance
- −$1,272
- − Management
- −$1,272
- − Depreciation
- −$2,633
- Taxable income
- $3,787
- Est. tax owed @ 24.0%
- −$909
- After-tax cash flow
- $4,090/yr
For passive investors: Depreciation is non-cash, so a rental often shows a tax loss while cash-flowing — sheltering income. Rental losses are passive: they offset passive income freely, and up to $25,000/yr can offset ordinary (W-2) income if you actively participate and your MAGI is under $100k (phasing out to $0 by $150k); unused losses carry forward. On sale, claimed depreciation is recaptured at up to 25%, and gains may owe capital-gains tax (a 1031 exchange can defer both). Figures are a year-1 estimate at your 24.0% rate — not tax advice; consult a CPA.
Condition & rehab AI · 4 photos
This 3-bedroom, 1-bath raised ranch is in good condition with recent major updates including a roof and windows. It's currently tenant-occupied and ready for a new owner to make it their own.
Value-add opportunities
- Both Painting exterior siding — Enhances curb appeal and value
- Both Landscaping front yard — Improves curb appeal and enhances property value
- Both Interior touch-up painting — Enhances interior appearance and value
Renovation cost estimate screening
Value-add ROI direction
- Both Painting exterior siding — Enhances curb appeal and value ↑
- Both Landscaping front yard — Improves curb appeal and enhances property value ↑
- Both Interior touch-up painting — Enhances interior appearance and value ↑
ⓘ Cost ranges are severity-bucket heuristics (US national rule-of-thumb). Get contractor quotes + a written scope before underwriting a rehab budget.
Schools (NCES district)
- District
- Gary Community School Corporation
- NCES district ID
- 1803870
- Math proficiency
- 3% ▼ -10.00%
- Reading proficiency
- 11% ▼ -6.00%
- Median HH income
- $27,739
- Composite
- 4.98/100
- National rank
- #10039
- State rank
- #299 of 301 in IN
Livability — Gary
- Score
- 73/100
- State rank
- #105
- US rank
- #5592
Category grades
Schools grade is shown separately in the Schools card above.
Census & demographics
- Census place
- Gary, IN
- County
- Lake County · 422,878 people
- City population
- 63,701
- Metro
- Chicago-Naperville-Elgin, IL-IN-WI
- Population (ZIP)
- 8,577
- Household income
- $28,526
- Rent vs Own
- Severe rent burden
- 392.0
Population outlook (Lake County) Hauer SSP2
- Today (2025)
- 484,026 people
- By 2030
- 478,091 · -1.2%
- By 2040
- 462,974 · -4.3%
- By 2050
- 449,894 · -7.1%
- By 2075
- 436,169 · -9.9%
- By 2100
- 426,607 · -11.9%
Race, ethnicity, and origin ACS 2023
- Neighborhood character
- Predominantly Black (91%)
- Race & ethnicity
- Black 91% Hispanic / Latino 3% White 2% Two or more races 1%
- Common ancestry
- Romanian 1%
- Foreign-born
- 1% · Canada
- Languages at home
- 97% English-only · Spanish 1% Russian/Polish/Slavic 1% French/Haitian/Cajun 1%
Political lean MEDSL · Lake
- 2024 margin
- Lean D (+5.6) · D 52.1% · R 46.5% · Other 1.5%
- 2008→2024 swing
- -28.6pp toward R · 2008: 34.3pp · 2024: 5.6pp
- All cycles
- 2024: D+5.6 2020: D+15.1 2016: D+20.6 2012: D+31.0 2008: D+34.3
Not yet ingested
- Civics
- —
Market trends
- HPI YoY
- ▲ 0.98%
- Current HPI
- 253.2856
- Rent YoY
- —
- Metro
- Chicago-Naperville-Elgin, IL-IN-WI
- State GDP YoY
- ▲ 2.90%
- F500 in state
- 18
Industry mix (Fortune 500 HQ in IN)
| Industry | F500 HQs | Revenue |
|---|---|---|
| Industrial Machinery | 2 | $37B |
|
||
| Healthcare | 1 | $177B |
|
||
| Pharmaceuticals | 1 | $45B |
|
||
| Metals / Steel | 1 | $18B |
|
||
| Agriculture | 1 | $17B |
|
||
| Packaging | 1 | $12B |
|
||
Price history
-79.0% since first listed20 events — show timeline
- 2026-05-05 Price Changed $110,000 NIRA MLS as Distributed by MLS Grid
- 2026-04-21 Listed $125,000 NIRA MLS as Distributed by MLS Grid
- 2026-01-16 Listing Removed — NIRA MLS as Distributed by MLS Grid
- 2026-01-16 Listing Removed — NIRA MLS as Distributed by MLS Grid
- 2025-12-17 Price Changed $89,000 NIRA MLS as Distributed by MLS Grid
- 2025-12-17 Price Changed $89,000 NIRA MLS as Distributed by MLS Grid
- 2025-07-29 Price Changed $94,000 NIRA MLS as Distributed by MLS Grid
- 2025-07-29 Price Changed $94,000 NIRA MLS as Distributed by MLS Grid
- 2025-07-16 Listed $97,500 NIRA MLS as Distributed by MLS Grid
- 2025-07-16 Listed $97,500 NIRA MLS as Distributed by MLS Grid
- 2023-09-27 Sold (MLS) $35,000 NIRA MLS as Distributed by MLS Grid
- 2023-09-25 Pending — NIRA MLS as Distributed by MLS Grid
- 2023-09-21 Contingent — NIRA MLS as Distributed by MLS Grid
- 2023-08-27 Relisted — NIRA MLS as Distributed by MLS Grid
- 2023-08-24 Contingent — NIRA MLS as Distributed by MLS Grid
- 2023-07-22 Relisted — NIRA MLS as Distributed by MLS Grid
- 2023-07-17 Listing Removed — NIRA MLS as Distributed by MLS Grid
- 2023-07-16 Contingent — NIRA MLS as Distributed by MLS Grid
- 2023-07-14 Listed $40,000 NIRA MLS as Distributed by MLS Grid
- 2023-07-14 Listed $525,000 NIRA MLS as Distributed by MLS Grid
Cash-flow waterfall
monthlySold comps — $/sqft
last 12 mo · ≤1 miLoading sold comps…