73208 Highland Springs Dr · Palm Desert, CA
Flood risk 1/10 · Minimal
- FEMA flood zone
- X (unshaded)
- Chance of flooding over 30 yrs
- 0.0%
- Est. flood insurance / yr
- $507 – $1,088
Fire risk 1/10 · Minimal
- Est. fire insurance / yr
- $659 – $1,223
Heat risk 9/10 · Severe
- Hot days now (above 114°F)
- 6 days/yr
- Hot days in 30 yrs
- 17 days/yr
Wind risk 1/10 · Minimal
- Chance of severe wind over 30 yrs
- —
Air-quality risk 4/10 · Minor
- Unhealthy air days now
- 5 days/yr
- Unhealthy air days in 30 yrs
- 7 days/yr
Risk factors via First Street. Map © Google.
Why this score? — see what drove the D- grade
The composite is a weighted blend of 9 inputs, each scored 0–100. Each bar is that input's sub-score; the figure is the points it added to the 100-point composite (weight × sub-score).
- Cash flow +14.9/30.0
- DSCR +4.6/10.0
- 1% rule +4.5/10.0
- Schools +3.8/10.0
- Rent growth +2.9/5.0
- Livability +2.6/5.0
- Condition / age +2.5/5.0
- ARV discount +0.0/15.0
- Appreciation +0.0/10.0
$379,000
🖨 Deal sheet (PDF) 📄 Offer letter ✓ Due diligence
Listing remarks
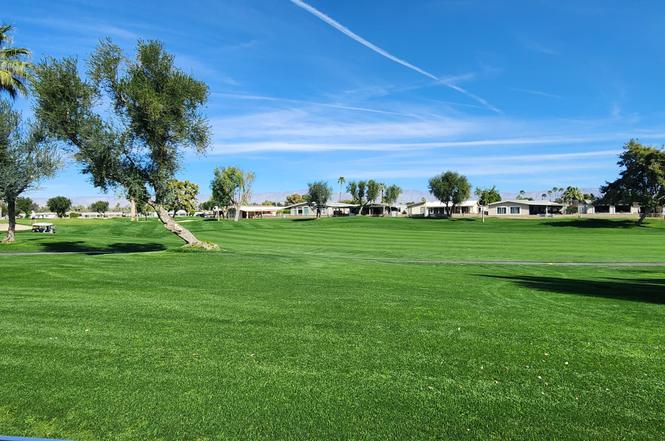
This affordable Golf Course property offers Fairway and Mountain views and is ready for immediate occupancy. The spacious living and dining areas flow into an updated kitchen equipped with quartz countertops, ample cabinetry, and modern appliances. The primary bedroom features a generous walk-in closet and direct access to a 2nd patio area, providing an ideal setting to appreciate mountain views while enjoying your morning coffee. The en-suite bathroom is appointed with a dual sink vanity, soaking tub, and walk-in shower. The second bedroom has an adjoining bathroom to ensure privacy for visiting guests. Palm Desert Greens Country Club, situated in the heart of the desert, is regarded as on
Key facts
- 4,356 sq ft lot
- Garage
- Built 1977
Property features AI
Finance
- Other: Located in a senior park/community; Mobile/manufactured home will remain
- Financial info: Sale terms: Conventional, Cash to New Loan, or Cash; Possession at close of escrow; Short-term rentals not allowed; No lease consideration
- HOA & community: Monthly HOA fee of $400; HOA covers building & grounds, trash, sewer, cable TV, clubhouse; Community amenities include: golf course, tennis courts, pickleball courts, fitness center, clubhouse, recreation room, billiard/banquet/card rooms, barbecue, sauna, playground, picnic area, hiking trails, greenbelt/park, lake/pond, guest parking, RV parking, basketball court, bocce ball court, management and grounds maintenance
Exterior
- Parking: Total of 4 parking spaces; 2 covered spaces; 2 carport spaces; Assigned parking; Tandem parking; Driveway; Golf cart garage; Covered parking
- Security: Gated community
- Utilities: Water provided by a water district (Coachella Valley Water Dist); Sewer connected and paid; PUD membership
- Home design: Detached property; Traditional style; One level
- Construction: Pier jacks foundation; Built in 1977 (manufactured home date)
- Exterior features: Located on a golf course; Panoramic and mountain views; Landscaped grounds; Underground utilities; Partial fencing; Rain gutters; Patio with awning(s), covered area and concrete slab; Street lights nearby
Interior
- Kitchen: Refrigerator; Dishwasher
- Bedrooms: Master suite
- Flooring: Mixed flooring
- Bathrooms: 2 full bathrooms; Dual-entry (Jack & Jill) bath; Shower stall; Shower and tub; Linen closet; Fiberglass shower
- Heating & cooling: Natural gas heating; Forced air heating; Central air conditioning
- Interior features: Blinds on windows; Turnkey furnished
- Laundry & utility: Washer; Dryer; Separate laundry room / laundry area
Neighborhood map
What this means for you Summary
Snapshot
- This is a 3-bed/2.0-bath manufactured listed at $379k.
Deal economics
- At list price, monthly cash flow is $112 ($1k/yr) — positive.
- The deal already cash-flows at list — no discount required.
- To meet the 1% rule (rent ≥ 1% of price), the offer needs to be $361k (4.8% below list).
- Recommended offer: $356k (6.0% below list) — sets the bar for market timing.
- Cap rate 6.6% vs local median 3.4% in Palm Desert — top-decile yield for the area; either an underpriced asset or a hidden risk that comps aren't pricing in. Stress-test before assuming the spread holds.
Location & tenants
- Location reads 51/100 on livability (#1,050 in CA) — a working-class tenant base; expect higher turnover. Strengths: employment B+, housing B; Watch: crime D, amenities F, commute F.
- Desert Sands Unified (suburban): math 31% / reading 56% proficiency, ranked #199 of 517 in CA (top 38%) — families likely to look elsewhere, expect single-tenant / working-renter base with shorter leases.
- Zoned schools: James Earl Carter Elementary (516 students, 53% FRL); Colonel Mitchell Paige Middle (math 10% / reading 10%, grade F, #474 of 498 statewide, top 99%, 436 students, 74% FRL); Palm Desert High (math 42% / reading 67%, grade C-, #256 of 1,170 statewide, top 24%, 2,050 students, 57% FRL).
- Market conditions: Rents rising (+1.6%/yr); 551 active listings in the ZIP; 40 comparable units currently listed for rent nearby; rentals lingering (median 46d on market — plan ~5-8 weeks vacancy on turnover, expect pricing pressure); 62% of comp listings sitting > 30 days — soft ceiling on asking rent; 9,195 units permitted in Riverside County in 2024 (1,512 in 5+ unit buildings).
- At $3,608/mo this rent would consume 62% of the median local household income ($70k/yr) (locally 1734% of renters already pay >50% of income on rent) — very limited rent-growth headroom before tenants either downsize or default.
Forward outlook
- Local home prices are declining (-3.0%/yr); year-one equity from $3k of loan paydown is wiped out by about $11k of value loss. Plan a longer hold.
- Riverside County population projected at +22% by 2050 — long-run rental-demand tailwind backs the buy-and-hold thesis.
Negotiation context
- It's been on market 63 days — a 6% lower offer ($356k) is reasonable based on typical stale-listing flexibility.
- 4 sale attempts since 20y ago; this cycle's ask has dropped $20k (5%) from the opening price — seller is motivated, your offer sets the floor, not the list.
- Current owner paid $100k; list at $379k implies a 279% gain — meaningful room to come down on a strong offer.
Risks & watch-outs
- Climate carrying-cost: extreme-heat days projected 6→17/yr by 2055 (HVAC capex compounding) — expect insurance premiums to compound above CPI over the hold.
Questions for the listing agent
- It's been on market 63 days. Have you received any prior offers? Is the seller open to a 6% concession, seller financing, or rate buy-down credit?
- Built in 1977 — when were the roof, HVAC, electrical panel, plumbing, and water heater last replaced?
- What does the HOA fee cover, when was the last increase, and are there any pending special assessments or reserve-fund shortfalls?
- Why hasn't it sold? Are there any deal-killer items the seller is aware of (foundation, flood, title, zoning, code violations)?
- Is there a deadline driving the sale (1031 exchange, divorce, estate, relocation)? That informs how much negotiation room exists.
- Schools are A-rated — typically a magnet for longer-tenancy family renters. What's the average tenant stay here, and is there a school-zone premium baked into asking?
- Crime grade is D in this area — have there been break-ins, vandalism, or insurance claims at this property in the last 3 years? What carrier currently insures it and at what premium?
- The area grade is low — what's the realistic commute time and amenity access for the typical tenant pool here? Any planned neighborhood developments (good or bad) we should know about?
- What's the average days-on-market for RENTAL listings here right now (not sales)? A rising rental-DOM trend means longer vacancies and softer asking-rent achievability than the comps imply.
- What's the recent tenant-quality profile in this submarket — average credit score on applications, eviction rate, late-payment / NSF rate, and stable-employment percentage? A property-management company in the area should have these aggregated.
- How much new for-sale + rental construction is in the pipeline within 1–3 miles? Heavy new supply typically softens prices + rents 12–24 months out; constrained supply supports both.
Investment metrics
- 1% rule
- 0.95% ✗
- Cap rate
- 6.65%
- Cash-on-cash
- 1.26%
- DSCR
- 1.06
- GRM
- 8.8
CMA / ARV
- ARV (on-the-fly)
- $257,040
- Comps found
- 12
Show comp detail 12 sales within ~0.75 mi
| Address | Dist | Beds/Ba | Sqft | Sold | Price | $/sf | Match |
|---|---|---|---|---|---|---|---|
| 38235 Poppet Canyon Dr | 0.12mi | 2/2.0 (-1) | 1,680 (0%) | 0mo | $355,000 | $211 | 89 |
| 73045 Buck Springs Dr | 0.21mi | 2/2.0 (-1) | 1,680 (0%) | 2mo | $468,000 | $279 | 84 |
| 38668 Fawn Springs Dr | 0.21mi | 3/2.5 | 1,600 (-5%) | 0mo | $410,000 | $256 | 80 |
| 73297 Highland Springs Dr #2 | 0.08mi | 2/2.0 (-1) | 1,800 (+7%) | 0mo | $275,000 | $153 | 79 |
| 73330 Desert Greens Dr N | 0.27mi | 2/2.0 (-1) | 1,740 (+4%) | 1mo | $229,080 | $132 | 76 |
| 73450 Country Club Dr #87 | 0.41mi | 3/2.0 | 1,636 (-3%) | 2mo | $222,500 | $136 | 75 |
| 73450 Country Club Dr Unit Sp. 91 | 0.41mi | 2/2.0 (-1) | 1,788 (+6%) | 0mo | $255,000 | $143 | 65 |
| 73171 Cabazon Peak Dr | 0.12mi | 2/2.0 (-1) | 1,440 (-14%) | 1mo | $230,000 | $160 | 65 |
| 73651 Adobe Dr | 0.25mi | 2/2.0 (-1) | 1,488 (-11%) | 1mo | $199,000 | $134 | 64 |
| 38251 Desert Greens Dr E | 0.48mi | 2/2.0 (-1) | 1,780 (+6%) | 1mo | $253,000 | $142 | 62 |
| 39183 Warm Springs Dr | 0.45mi | 2/2.0 (-1) | 1,440 (-14%) | 0mo | $200,000 | $139 | 50 |
| 73701 Half Way Dr | 0.47mi | 2/2.5 (-1) | 1,890 (+12%) | 2mo | $400,000 | $212 | 48 |
Match score weights: distance 35% · size 25% · config 20% · recency 20%. Top-matched comps best support the ARV.
Projected returns pro-forma
-3.0% appreciation · 1.6% rent growth · sell at horizon
- IRR
- -15.9%
- Equity multiple
- 0.44×
- Total profit
- $-59,183
- Equity at exit
- $56,510
- IRR
- -10.2%
- Equity multiple
- 0.42×
- Total profit
- $-61,851
- Equity at exit
- $32,769
Cash invested: $106,120 (down + closing). Projections, not guarantees.
Landlord ↔ Tenant lean methodology
- Overall (STATE)
- 18 Strongly Tenant-Friendly
- State California
- 18 Strongly Tenant-Friendly · D+13
- County
- — inherits STATE
- City
- — inherits STATE
ZIP-level market 92260
- Rents YoY
- 1.6%
- Active inventory
- 551
- Price-to-rent
- 8.8×
Monthly cashflow live
- Estimated rent
- $3,608 high interval (Pro) →
- Mortgage (P&I)
- −$1,988
- Tax from tax record
- −$193 /mo · $2,320/yr
- Insurance
- −$158
- HOA
- −$400
- Vacancy / Maint / Mgmt
- −$758
- Net cashflow
- $112
Break-even live
Sensitivity live
| Price | -10% $326 | -5% $219 | +0% $112 | +5% $4 | +10% $-103 |
|---|---|---|---|---|---|
| Rent | -10% $-173 | -5% $-31 | +0% $112 | +5% $254 | +10% $397 |
| Rate | -1.0pp $303 | -0.5pp $208 | base $112 | +0.5pp $14 | +1.0pp $-86 |
UW: 25.0% down · 7.5% · 30yr · 1.5% tax · 5.0% vac · 8.0% maint · 8.0% mgmt
Financing live
Cash to close
- Down payment
- $94,750
- Closing costs
- $11,370
- Reserves months
- —
- Total cash needed
- —
Loan-product check · same deal, 3 products live
Conventional
25% down · 7.5% · 30yr
- Down + closing
- —
- Monthly P&I
- —
- Monthly cashflow
- —
- DSCR
- —
- Eligible?
- —
Personal DTI + credit; lowest rate.
DSCR
20% down · 8.5% · 30yr
- Down + closing
- —
- Monthly P&I
- —
- Monthly cashflow
- —
- DSCR
- —
- Eligible?
- —
No personal income docs; deal must DSCR.
Hard money
10% down · 12.0% · 12mo
- Down + closing
- —
- Monthly P&I
- —
- Monthly cashflow
- —
- DSCR
- —
- Eligible?
- —
Short-term bridge; refi at stabilization.
Rent comps 40 comps
| Address | Beds | Baths | Sqft | Rent | $/sqft | DOM | Units | Dist |
|---|---|---|---|---|---|---|---|---|
| 38520 Poppet Canyon Dr Palm Desert, CA | 2.0 | 2.0 | 1392 | $3,700 | $2.66 | 45d | 1 | 0.13mi |
| 73075 Buck Springs Dr Palm Desert, CA | 2.0 | 2.0 | 1440 | $1,950 | $1.35 | 45d | 1 | 0.20mi |
| 38250 Azalea Dr Palm Desert, CA | 2.0 | 2.0 | 1806 | $5,500 | $3.05 | 45d | 1 | 0.26mi |
| 73639 Cabazon Peak Dr Palm Desert, CA | 2.0 | 2.0 | 1717 | $2,400 | $1.40 | 45d | 1 | 0.27mi |
| 73450 Country Club Dr #120 Palm Desert, CA | 2.0 | 2.0 | 1856 | $2,995 | $1.61 | 13d | 1 | 0.38mi |
| 4162 Via Mattina Palm Desert, CA | 2.0 | 2.0 | 1867 | $2,950 | $1.58 | 14d | 1 | 0.51mi |
| 170 Via Tramonto Palm Desert, CA | 3.0 | 2.0 | 1910 | $4,000 | $2.09 | 45d | 1 | 0.56mi |
| 170 Via Tramonto Palm Desert, CA | 3.0 | 2.0 | 1910 | $3,900 | $2.04 | 12d | 1 | 0.56mi |
| 3253 Via Giorna Palm Desert, CA | 2.0 | 2.0 | 1961 | $4,500 | $2.29 | 26d | 1 | 0.57mi |
| 248 Strada Fortuna Palm Desert, CA | 2.0 | 2.0 | 1400 | $2,500 | $1.79 | 45d | 1 | 0.58mi |
| 37762 Drexell Dr Palm Desert, CA | 4.0 | 2.0 | 1724 | $4,495 | $2.61 | 26d | 1 | 0.61mi |
| 73843 Line Canyon Ln Palm Desert, CA | 2.0 | 2.0 | 1570 | $2,100 | $1.34 | 13d | 1 | 0.63mi |
| 37677 Emerson Dr Palm Desert, CA | 3.0 | 2.0 | 1896 | $3,600 | $1.90 | 45d | 1 | 0.69mi |
| 37760 Driscoll St Palm Desert, CA | 4.0 | 2.0 | 1896 | $5,200 | $2.74 | 45d | 1 | 0.72mi |
| 37772 Hollister Dr Palm Desert, CA | 3.0 | 2.0 | 1271 | $3,200 | $2.52 | 45d | 1 | 0.76mi |
| 40064 Silktree Ct Palm Desert, CA | 3.0 | 2.0 | 1712 | $3,200 | $1.87 | 26d | 1 | 0.79mi |
| 1701 Retreat Cir Palm Desert, CA | 3.0 | 2.5 | 2034 | $5,300 | $2.61 | 45d | 1 | 0.84mi |
| 2701 Via Calderia Palm Desert, CA | 2.0 | 2.0 | 1559 | $2,850 | $1.83 | 26d | 1 | 0.86mi |
| 40255 Sagewood Dr Palm Desert, CA | 3.0 | 2.0 | 1712 | $3,300 | $1.93 | 20d | 1 | 0.90mi |
| 105 Kavenish Dr Rancho Mirage, CA | 3.0 | 3.0 | 1724 | $4,200 | $2.44 | 45d | 1 | 0.90mi |
| 1803 Via San Martino Palm Desert, CA | 2.0 | 2.0 | 1559 | $3,900 | $2.50 | 45d | 1 | 0.93mi |
| 302 Retreat Cir Palm Desert, CA | 3.0 | 3.0 | 2184 | $6,000 | $2.75 | 45d | 1 | 0.95mi |
| 73983 Munn Cir Palm Desert, CA | 3.0 | 2.0 | 2064 | $3,400 | $1.65 | 45d | 1 | 0.95mi |
| 93 Kavenish Dr Rancho Mirage, CA | 3.0 | 3.0 | 2136 | $6,800 | $3.18 | 5d | 1 | 0.96mi |
| 40605 Ventana Ct Palm Desert, CA | 3.0 | 2.5 | 2093 | $4,500 | $2.15 | 20d | 1 | 0.97mi |
| 502 Retreat Cir Palm Desert, CA | 3.0 | 3.0 | 2188 | $5,200 | $2.38 | 45d | 1 | 0.98mi |
| 40556 Clover Ln Palm Desert, CA | 3.0 | 2.5 | 1880 | $4,200 | $2.23 | 45d | 1 | 1.00mi |
| 74079 Kingston Ct W Palm Desert, CA | 4.0 | 3.0 | 1937 | $9,980 | $5.15 | 45d | 1 | 1.00mi |
| 40560 Glenwood Ln Palm Desert, CA | 3.0 | 3.0 | 2052 | $6,500 | $3.17 | 45d | 1 | 1.00mi |
| 41517 Armanac Ct Palm Desert, CA | 3.0 | 2.0 | 1537 | $3,400 | $2.21 | 5d | 1 | 1.02mi |
| 72460 Rodeo Way Rancho Mirage, CA | 2.0 | 2.0 | 1851 | $2,500 | $1.35 | 7d | 1 | 1.05mi |
| 73774 Mojave Desert Dr Palm Desert, CA | 3.0 | 2.0 | 2235 | $4,950 | $2.21 | 45d | 1 | 1.05mi |
| 72385 Beverly Way Rancho Mirage, CA | 2.0 | 2.0 | 1851 | $2,500 | $1.35 | 20d | 1 | 1.06mi |
| 73750 Calle Bisque Palm Desert, CA | 3.0 | 2.0 | 1537 | $6,500 | $4.23 | 45d | 1 | 1.07mi |
| 40445 Portola Ave Palm Desert, CA | 1.0–2.0 | 1.0–2.0 | 975 | $3,215 | $3.30 | 1d | 16 | 1.10mi |
| 73759 Julie Ln Palm Desert, CA | 2.0 | 2.0 | 1366 | $3,249 | $2.38 | 45d | 1 | 1.10mi |
| 8 Las Cruces Ln Palm Desert, CA | 2.0 | 2.0 | 1705 | $5,000 | $2.93 | 45d | 1 | 1.13mi |
| 142 Lake Shore Dr Rancho Mirage, CA | 3.0 | 3.0 | 1888 | $4,850 | $2.57 | 45d | 1 | 1.16mi |
| 74300 Country Club Dr Apt 5001 Palm Desert, CA | 2.0 | 2.0 | 1099 | $7,120 | $6.48 | 45d | 1 | 1.17mi |
| 74300 Country Club Dr Unit 366 Palm Desert, CA | 2.0 | 2.0 | 1140 | $7,170 | $6.29 | 45d | 1 | 1.17mi |
HOA detail
- Monthly dues
- $400 · $4,800/yr
Listing history 15 events
-
2026-05-04status Pending
-
2026-04-29historical Active Under Contract
-
2026-04-23status Active
-
2026-04-23price $379,000
-
2026-04-10historical
-
2026-03-19status Active
-
2026-02-28historical Active Under Contract
-
2026-02-16$399,000 Active
-
2026-02-11historical $399,000
-
2006-05-01soldstatus $100,000
-
2006-02-14historical
-
2006-01-23$314,750
-
1989-06-20soldstatus $60,000
-
1988-09-23soldstatus $60,000
-
1982-05-01soldstatus $50,000
ⓘ Source: listings_history table (triggers on properties + properties_extension) + one-shot
backfill from property_details.listing_events for pre-trigger history.
Tax reassessment forecast CA · Resets to sale price
- Current annual tax
- $2,320 · $193/mo
- Projected year-2 tax
- $2,880 · $240/mo
- Expected delta
- +$560/yr (+$47/mo · 24.1%)
ⓘ Screening estimate from a state-policy table — verify with the county assessor before closing.
Climate risk First Street
- Flood 1/10 Low FEMA zone X (unshaded) · 0% chance over 30 yrs
- Wildfire 1/10 Low
- Heat 9/10 Extreme 6 d/yr ≥114°F today · 17 d/yr by 30 yrs out
- Wind 1/10 Low
- Air quality 4/10 Moderate 5 unhealthy d/yr today · 7 by 30 yrs out
Nearby sold comps map
Loading sold comps map…
Walkable amenities ~0.75 mi
Loading nearby amenities…
Taxation est. · year 1
- Rental income
- $43,299
- − Mortgage interest
- −$21,230
- − Property taxes
- −$2,320
- − Insurance
- −$1,895
- − Repairs & maintenance
- −$3,464
- − Management
- −$3,464
- − HOA
- −$4,800
- − Depreciation
- −$11,025
- Taxable loss
- −$4,899
- Est. tax savings @ 24.0%
- +$1,176
- After-tax cash flow
- $2,517/yr
For passive investors: Depreciation is non-cash, so a rental often shows a tax loss while cash-flowing — sheltering income. Rental losses are passive: they offset passive income freely, and up to $25,000/yr can offset ordinary (W-2) income if you actively participate and your MAGI is under $100k (phasing out to $0 by $150k); unused losses carry forward. On sale, claimed depreciation is recaptured at up to 25%, and gains may owe capital-gains tax (a 1031 exchange can defer both). Figures are a year-1 estimate at your 24.0% rate — not tax advice; consult a CPA.
Schools (NCES district)
- District
- Desert Sands Unified
- NCES district ID
- 0611110
- Math proficiency
- 31% ▼ -4.00%
- Reading proficiency
- 56% ▲ 7.00%
- Median HH income
- $54,957
- Composite
- 37.77/100
- National rank
- #4346
- State rank
- #199 of 517 in CA
Livability — Palm Desert
- Score
- 51/100
- State rank
- #1050
- US rank
- #25164
Category grades
Schools grade is shown separately in the Schools card above.
Census & demographics
- Census place
- Palm Desert, CA
- County
- Riverside County · 2,287,001 people
- City population
- 58,615
- Metro
- Riverside-San Bernardino-Ontario, CA
- Population (ZIP)
- 30,523
- Household income
- $70,091
- Rent vs Own
- Severe rent burden
- 1734.0
Population outlook (Riverside County) Hauer SSP2
- Today (2025)
- 2,664,475 people
- By 2030
- 2,802,692 · +5.2%
- By 2040
- 3,050,904 · +14.5%
- By 2050
- 3,256,783 · +22.2%
- By 2075
- 3,655,058 · +37.2%
- By 2100
- 3,766,594 · +41.4%
Race, ethnicity, and origin ACS 2023
- Neighborhood character
- Majority White (61%)
- Race & ethnicity
- White 61% Hispanic / Latino 31% Two or more races 20% Asian 4% Black 2%
- Hispanic origin (detail)
- Mexican 25%
- Common ancestry
- Italian 4% Lithuanian 3% Slovak 2%
- Foreign-born
- 18% · Canada, South Korea, Vietnam
- Languages at home
- 73% English-only · Spanish 22% French/Haitian/Cajun 1% Other Indo-European 1%
Political lean MEDSL · Riverside
- 2024 margin
- Toss-up / Even · D 48.0% · R 49.3% · Other 2.6%
- 2008→2024 swing
- -3.6pp toward R · 2008: 2.3pp · 2024: -1.3pp
- All cycles
- 2024: R+1.3 2020: D+8.0 2016: D+4.3 2012: R+0.4 2008: D+2.3
Not yet ingested
- Civics
- —
Market trends
- HPI YoY
- ▼ -364.94%
- Current HPI
- 294.9425
- Rent YoY
- ▲ 1.60%
- Metro
- Riverside-San Bernardino-Ontario, CA
- State GDP YoY
- ▲ 3.21%
- F500 in state
- 116
Industry mix (Fortune 500 HQ in CA)
| Industry | F500 HQs | Revenue |
|---|---|---|
| Technology | 27 | $1,492B |
|
||
| Financial Services | 3 | $174B |
|
||
| Retail | 3 | $44B |
|
||
| Insurance | 3 | $26B |
|
||
| Media / Entertainment | 2 | $115B |
|
||
| Pharmaceuticals / Biotech | 2 | $62B |
|
||
Price history
+658.0% since first listed15 events — show timeline
- 2026-05-04 Pending — GPSMLS
- 2026-04-29 Contingent — GPSMLS
- 2026-04-23 Relisted — GPSMLS
- 2026-04-23 Price Changed $379,000 GPSMLS
- 2026-04-10 Listing Removed — GPSMLS
- 2026-03-19 Relisted — GPSMLS
- 2026-02-28 Contingent — GPSMLS
- 2026-02-16 Listed $399,000 GPSMLS
- 2026-02-11 Coming Soon $399,000 GPSMLS
- 2006-05-01 Sold (Public Records) $100,000 Public Records
- 2006-02-14 Listing Removed — GPSMLS
- 2006-01-23 Listed $314,750 GPSMLS
- 1989-06-20 Sold (Public Records) $60,000 Public Records
- 1988-09-23 Sold (Public Records) $60,000 Public Records
- 1982-05-01 Sold (Public Records) $50,000 Public Records
Property tax history
+2.1%/yrLatest (2025): $2,320 · +3.0% YoY. Source: county tax records.
Cash-flow waterfall
monthlySold comps — $/sqft
last 12 mo · ≤1 miLoading sold comps…