 Multi-family
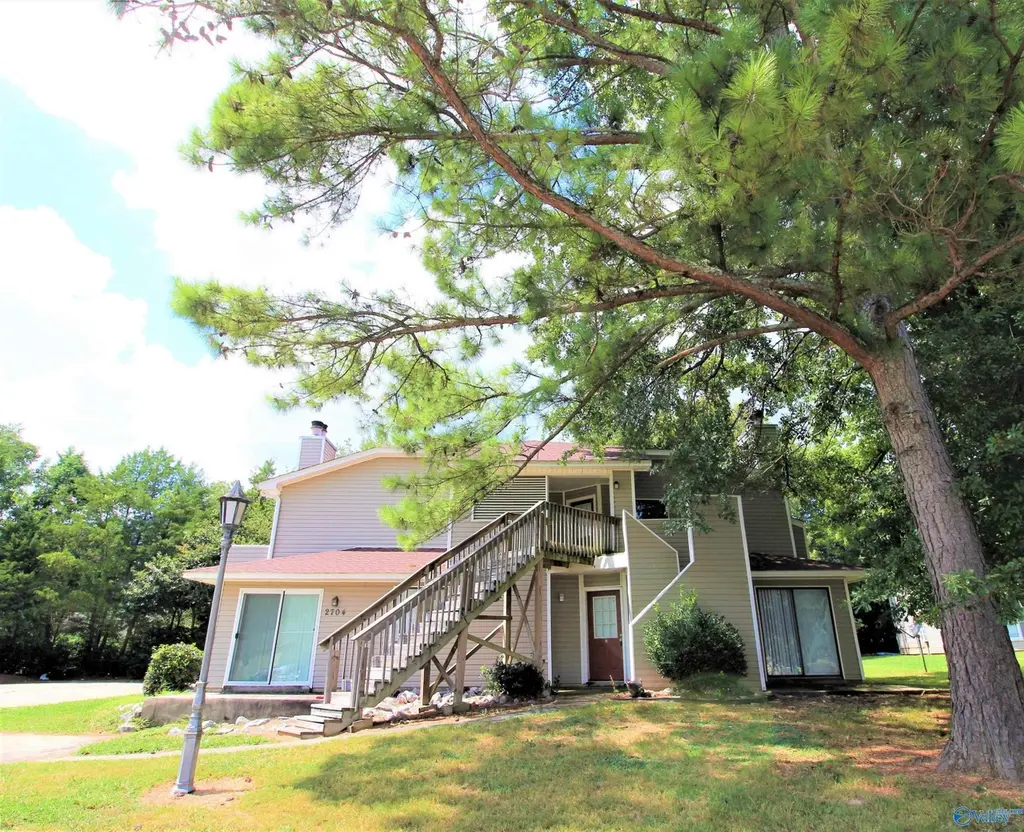
2704 Lantern Walk SE · Huntsville, AL
Flood risk 1/10 · Minimal
- FEMA flood zone
- X (unshaded)
- Chance of flooding over 30 yrs
- 0.0%
- Est. flood insurance / yr
- $507 – $1,088
Fire risk 3/10 · Minor
- Est. fire insurance / yr
- $916 – $1,700
Heat risk 6/10 · Moderate
- Hot days now (above 104°F)
- 7 days/yr
- Hot days in 30 yrs
- 21 days/yr
Wind risk 4/10 · Minor
- Chance of severe wind over 30 yrs
- 18.0%
Air-quality risk 2/10 · Minimal
- Unhealthy air days now
- 1 days/yr
- Unhealthy air days in 30 yrs
- 2 days/yr
Risk factors via First Street. Map © Google.
Why this score? — see what drove the C+ grade
The composite is a weighted blend of 9 inputs, each scored 0–100. Each bar is that input's sub-score; the figure is the points it added to the 100-point composite (weight × sub-score).
- Cash flow +28.4/30.0
- DSCR +10.0/10.0
- 1% rule +7.0/10.0
- ARV discount +4.8/15.0
- Livability +4.1/5.0
- Rent growth +3.4/5.0
- Schools +2.9/10.0
- Condition / age +2.5/5.0
- Appreciation +0.0/10.0
$625,000
🖨 Deal sheet 📄 Offer letter ✓ Due diligence
Multi-family units
County records classify this as Multi-Family (5+ Unit). Listing-text estimate: 1 unit. estimate disagrees with records
5+ unit building — per-unit beds/baths from public records are typically unavailable; the breakdown below (if shown) is an estimate from the listing text.
Listing remarks MLS
NEW PRICE!!! GREAT INVESTMENT OPPORTUNITY IN SOUTH HUNTSVILLE. 8 UNITS- CONSISTING OF 4- 1 BEDROOM 1 BATH APARTMENTS AND 4 STUDIO APARTMENTS. TENANTS PAY ALL UTILITIES EXCEPT WASTE REMOVAL WHICH IS PAID BY THE OWNER. **MUST CALL LISTING AGENT FOR APPOINTMENT. DO NOT DISTURB TENANTS. EXTRA LARGE LOT
Key facts
- 8 parking spots
- Built 1984
- Listed 28 days
Property features AI
Finance
- Other: Property listed as residential income (multi-family)
- HOA & community: Located in the Sugar Mill subdivision
Exterior
- Parking: Parking lot with 8 spaces
- Utilities: Public water; Public sewer; No gas service
- Home design: Residential income property (multi-family); Built in 1984
- Exterior features: No significant view; Lot dimensions: 212 x 79 x 281 x 168
Interior
- Heating & cooling: Central heating; Central air conditioning
- Interior features: Central heating and central air conditioning
Neighborhood map
What this means for you Summary
Snapshot
- This is a ?-bed/8.0-bath multifamily listed at $625k.
Deal economics
- At list price, monthly cash flow is $2k ($24k/yr) — positive.
- The deal already cash-flows at list — no discount required.
- Meets the 1% rule at list price ($8k rent vs $625k).
- Recommended offer: $616k (1.5% below list) — sets the bar for market timing.
- Cap rate 10.2% vs local median 3.8% in Huntsville — top-decile yield for the area; either an underpriced asset or a hidden risk that comps aren't pricing in. Stress-test before assuming the spread holds.
Location & tenants
- Location reads 82/100 on livability (#3 in AL, #1,082 nationally) — a professional / high-income tenant draw. Strengths: commute A+, cost of living A+, housing A+; Watch: crime F.
- Huntsville City (urban): math 21% / reading 46% proficiency, ranked #48 of 129 in AL (top 37%) — families likely to look elsewhere, expect single-tenant / working-renter base with shorter leases.
- Zoned schools: Challenger Elementary School (math 30% / reading 53%, grade F, #232 of 627 statewide, top 37%, 503 students, 43% FRL); Challenger Middle School (math 19% / reading 55%, grade F, #73 of 257 statewide, top 29%, 438 students, 44% FRL); Virgil Grissom High School (math 34% / reading 40%, grade F, #39 of 305 statewide, top 13%, 1,974 students, 43% FRL) — zoned schools at 43% FRL track the district average.
- Market conditions: Rents rising (+3.7%/yr); 280 active listings in the ZIP; solid renter incomes; 4,709 units permitted in Madison County in 2024 (1,186 in 5+ unit buildings).
- At $7,531/mo this rent would consume 90% of the median local household income ($101k/yr) (locally 411% of renters already pay >50% of income on rent) — very limited rent-growth headroom before tenants either downsize or default.
Forward outlook
- Local home prices are declining (-3.0%/yr); year-one equity from $4k of loan paydown is wiped out by about $19k of value loss. Plan a longer hold.
- Madison County population projected at +18% by 2050 — long-run rental-demand tailwind backs the buy-and-hold thesis.
- At projected returns (-3.0% appreciation + 3.7% rent growth), your $175k cash investment doubles in ~8 years — after that, you're playing with house money.
Negotiation context
- It's been on market 28 days — a 2% lower offer ($616k) is reasonable based on typical stale-listing flexibility.
- 3 sale attempts since 14y ago with the ask held roughly flat each time — persistent listings suggest the price (not the market) is what's stuck; bring a comps-based counter.
- Current owner paid $334k; list at $625k implies a 87% gain — meaningful room to come down on a strong offer.
Risks & watch-outs
- Climate carrying-cost: extreme-heat days projected 7→21/yr by 2055 (HVAC capex compounding) — expect insurance premiums to compound above CPI over the hold.
Questions for the listing agent
- Is there a deadline driving the sale (1031 exchange, divorce, estate, relocation)? That informs how much negotiation room exists.
- Crime grade is F in this area — have there been break-ins, vandalism, or insurance claims at this property in the last 3 years? What carrier currently insures it and at what premium?
- What's the average days-on-market for RENTAL listings here right now (not sales)? A rising rental-DOM trend means longer vacancies and softer asking-rent achievability than the comps imply.
- What's the recent tenant-quality profile in this submarket — average credit score on applications, eviction rate, late-payment / NSF rate, and stable-employment percentage? A property-management company in the area should have these aggregated.
- How much new apartment / multifamily construction is in the pipeline within 1–3 miles? Heavy new supply (>2% of stock underway) typically softens rents 12–24 months out; light construction supports rent growth.
Investment metrics
- 1% rule
- 1.20% ✓
- Cap rate
- 10.16%
- Cash-on-cash
- 13.80%
- DSCR
- 1.61
- GRM
- 6.9
CMA / ARV
- ARV (on-the-fly)
- $589,940
- Comps found
- 1
Show comp detail 1 sale within ~0.75 mi
| Address | Dist | Beds/Ba | Sqft | Sold | Price | $/sf | Match |
|---|---|---|---|---|---|---|---|
| 2613 Wynterhall Rd | 0.37mi | 8/10.0 | 4,400 (-3%) | 2mo | $570,000 | $130 | 68 |
Match score weights: distance 35% · size 25% · config 20% · recency 20%. Top-matched comps best support the ARV.
Projected returns pro-forma
-3.0% appreciation · 3.72% rent growth · sell at horizon
- IRR
- 4.7%
- Equity multiple
- 1.18×
- Total profit
- $32,296
- Equity at exit
- $93,190
- IRR
- 14.8%
- Equity multiple
- 2.23×
- Total profit
- $215,586
- Equity at exit
- $54,039
Cash invested: $175,000 (down + closing). Projections, not guarantees.
Landlord ↔ Tenant lean methodology
- Overall (STATE)
- 90 Strongly Landlord-Friendly
- State Alabama
- 90 Strongly Landlord-Friendly · R+15
- County
- — inherits STATE
- City
- — inherits STATE
ZIP-level market 35803
- Home prices YoY
- -22.9%
- Rents YoY
- 3.7%
- Active inventory
- 280
- Price-to-rent
- 55.3×
Monthly cashflow live
- Estimated rent
- $7,531 medium interval (Pro) →
- Mortgage (P&I)
- −$3,278
- Tax from tax record
- −$399 /mo · $4,784/yr
- Insurance
- −$260
- HOA
- −$0
- Vacancy / Maint / Mgmt
- −$1,582
- Net cashflow
- $2,013
Break-even live
8-unit breakdown (identical units grouped — click to expand)
| Units | Beds | Baths | Est. rent |
|---|---|---|---|
| 8× units | 1 | 1 | $7,528 |
| #1 | 1 | 1 | $941 |
| #2 | 1 | 1 | $941 |
| #3 | 1 | 1 | $941 |
| #4 | 1 | 1 | $941 |
| #5 | 1 | 1 | $941 |
| #6 | 1 | 1 | $941 |
| #7 | 1 | 1 | $941 |
| #8 | 1 | 1 | $941 |
| Total (8 units) | $7,531 | ||
UW: 25.0% down · 7.5% · 30yr · 1.5% tax · 5.0% vac · 8.0% maint · 8.0% mgmt
Financing live
Cash to close
- Down payment
- $156,250
- Closing costs
- $18,750
- Reserves months
- —
- Total cash needed
- —
Loan-product check · same deal, 3 products live
Conventional
25% down · 7.5% · 30yr
- Down + closing
- —
- Monthly P&I
- —
- Monthly cashflow
- —
- DSCR
- —
- Eligible?
- —
Personal DTI + credit; lowest rate.
DSCR
20% down · 8.5% · 30yr
- Down + closing
- —
- Monthly P&I
- —
- Monthly cashflow
- —
- DSCR
- —
- Eligible?
- —
No personal income docs; deal must DSCR.
Hard money
10% down · 12.0% · 12mo
- Down + closing
- —
- Monthly P&I
- —
- Monthly cashflow
- —
- DSCR
- —
- Eligible?
- —
Short-term bridge; refi at stabilization.
Listing history 21 events
-
2026-06-18days on market $625,000 Active 28 DOM
-
2026-06-17days on market $625,000 Active 27 DOM
-
2026-06-16days on market $625,000 Active 26 DOM
-
2026-06-15days on market $625,000 Active 25 DOM
-
2026-06-14days on market $625,000 Active 23 DOM
-
2026-06-10days on market $625,000 Active 20 DOM
-
2026-06-09days on market $625,000 Active 19 DOM
-
2026-06-08days on market $625,000 Active 18 DOM
-
2026-06-07days on market $625,000 Active 17 DOM
-
2026-06-03days on market $625,000 Active 13 DOM
-
2026-06-02days on market $625,000 Active 12 DOM
-
2026-06-01days on market $625,000 Active 11 DOM
-
2026-05-31days on market $625,000 Active 10 DOM
-
2026-05-30days on market $625,000 Active 9 DOM
-
2026-05-21$625,000 Active
-
2023-07-14status Pending
-
2023-06-29$629,000 Active
-
2018-04-27soldstatus $334,500
-
2013-12-10soldstatus $159,000 299-char remark
Show marketing remark (299 chars)
NEW PRICE!!! GREAT INVESTMENT OPPORTUNITY IN SOUTH HUNTSVILLE. 8 UNITS- CONSISTING OF 4- 1 BEDROOM 1 BATH APARTMENTS AND 4 STUDIO APARTMENTS. TENANTS PAY ALL UTILITIES EXCEPT WASTE REMOVAL WHICH IS PAID BY THE OWNER. **MUST CALL LISTING AGENT FOR APPOINTMENT. DO NOT DISTURB TENANTS. EXTRA LARGE LOT
-
2013-12-10soldstatus $159,000
Show marketing remark (299 chars)
NEW PRICE!!! GREAT INVESTMENT OPPORTUNITY IN SOUTH HUNTSVILLE. 8 UNITS- CONSISTING OF 4- 1 BEDROOM 1 BATH APARTMENTS AND 4 STUDIO APARTMENTS. TENANTS PAY ALL UTILITIES EXCEPT WASTE REMOVAL WHICH IS PAID BY THE OWNER. **MUST CALL LISTING AGENT FOR APPOINTMENT. DO NOT DISTURB TENANTS. EXTRA LARGE LOT
-
2012-09-12$179,900 299-char remark
Show marketing remark (299 chars)
NEW PRICE!!! GREAT INVESTMENT OPPORTUNITY IN SOUTH HUNTSVILLE. 8 UNITS- CONSISTING OF 4- 1 BEDROOM 1 BATH APARTMENTS AND 4 STUDIO APARTMENTS. TENANTS PAY ALL UTILITIES EXCEPT WASTE REMOVAL WHICH IS PAID BY THE OWNER. **MUST CALL LISTING AGENT FOR APPOINTMENT. DO NOT DISTURB TENANTS. EXTRA LARGE LOT
ⓘ Source: listings_history table (triggers on properties + properties_extension) + one-shot
backfill from property_details.listing_events for pre-trigger history.
Tax reassessment forecast AL · Resets to sale price
- Current annual tax
- $4,784 · $399/mo
- Projected year-2 tax
- $4,784 · $399/mo
- Expected delta
- $0/yr ($0/mo · 0.0%)
ⓘ Screening estimate from a state-policy table — verify with the county assessor before closing.
Climate risk First Street
- Flood 1/10 Low FEMA zone X (unshaded) · 0% chance over 30 yrs
- Wildfire 3/10 Moderate
- Heat 6/10 Major 7 d/yr ≥104°F today · 21 d/yr by 30 yrs out
- Wind 4/10 Moderate 18% chance of damaging wind over 30 yrs
- Air quality 2/10 Low 1 unhealthy d/yr today · 2 by 30 yrs out
Nearby sold comps map
Loading sold comps map…
Walkable amenities ~0.75 mi
Loading nearby amenities…
Taxation est. · year 1
- Rental income
- $90,372
- − Mortgage interest
- −$35,010
- − Property taxes
- −$4,784
- − Insurance
- −$3,125
- − Repairs & maintenance
- −$7,230
- − Management
- −$7,230
- − Depreciation
- −$18,182
- Taxable income
- $14,812
- Est. tax owed @ 24.0%
- −$3,555
- After-tax cash flow
- $20,599/yr
For passive investors: Depreciation is non-cash, so a rental often shows a tax loss while cash-flowing — sheltering income. Rental losses are passive: they offset passive income freely, and up to $25,000/yr can offset ordinary (W-2) income if you actively participate and your MAGI is under $100k (phasing out to $0 by $150k); unused losses carry forward. On sale, claimed depreciation is recaptured at up to 25%, and gains may owe capital-gains tax (a 1031 exchange can defer both). Figures are a year-1 estimate at your 24.0% rate — not tax advice; consult a CPA.
Schools (NCES district)
- District
- Huntsville City
- NCES district ID
- 0101800
- Math proficiency
- 21% ▼ -23.00%
- Reading proficiency
- 46% ▬ 0.00%
- Median HH income
- $48,264
- Composite
- 28.84/100
- National rank
- #6647
- State rank
- #48 of 129 in AL
Livability — Huntsville
- Score
- 82/100
- State rank
- #3
- US rank
- #1082
Category grades
Schools grade is shown separately in the Schools card above.
Census & demographics
- Census place
- Huntsville, AL
- County
- Madison County · 380,832 people
- City population
- 220,435
- Metro
- Huntsville, AL
- Population (ZIP)
- 29,197
- Household income
- $100,846
- Rent vs Own
- Severe rent burden
- 411.0
Population outlook (Madison County) Hauer SSP2
- Today (2025)
- 392,086 people
- By 2030
- 409,788 · +4.5%
- By 2040
- 440,557 · +12.4%
- By 2050
- 460,990 · +17.6%
- By 2075
- 502,872 · +28.3%
- By 2100
- 513,623 · +31.0%
Race, ethnicity, and origin ACS 2023
- Neighborhood character
- Predominantly White (82%)
- Race & ethnicity
- White 82% Hispanic / Latino 7% Two or more races 7% Black 4% Asian 3%
- Hispanic origin (detail)
- Mexican 4% Puerto Rican 1%
- Common ancestry
- Slovak 3% Italian 2% Lithuanian 2%
- Foreign-born
- 6% · Canada, China, South Korea
- Languages at home
- 92% English-only · Spanish 3% Chinese 2% German/W. Germanic 1%
Political lean MEDSL · Madison
- 2024 margin
- Lean R (+9.0) · D 44.7% · R 53.7% · Other 1.6%
- 2008→2024 swing
- +6.0pp toward D · 2008: -14.9pp · 2024: -9.0pp
- All cycles
- 2024: R+9.0 2020: R+8.0 2016: R+16.8 2012: R+18.7 2008: R+14.9
Not yet ingested
- Civics
- —
Market trends
- HPI YoY
- ▼ -110.53%
- Current HPI
- 372.1842
- Rent YoY
- ▲ 3.72%
- Metro
- Huntsville, AL
- State GDP YoY
- ▲ 2.94%
- F500 in state
- 4
Industry mix (Fortune 500 HQ in AL)
| Industry | F500 HQs | Revenue |
|---|---|---|
| Financial Services | 1 | $8B |
|
||
| Healthcare | 1 | $5B |
|
||
Price history
+247.4% since first listed7 events — show timeline
- 2026-05-21 Listed $625,000 VMLS
- 2023-07-14 Pending — VMLS
- 2023-06-29 Listed $629,000 VMLS
- 2018-04-27 Sold (Public Records) $334,500 Public Records
- 2013-12-10 Sold (Public Records) $159,000 Public Records
- 2013-12-10 Sold (MLS) $159,000 VMLS
- 2012-09-12 Listed $179,900 VMLS
Property tax history
+9.3%/yrLatest (2024): $4,784 · +4.6% YoY. Source: county tax records.
Cash-flow waterfall
monthlySold comps — $/sqft
last 12 mo · ≤1 miLoading sold comps…