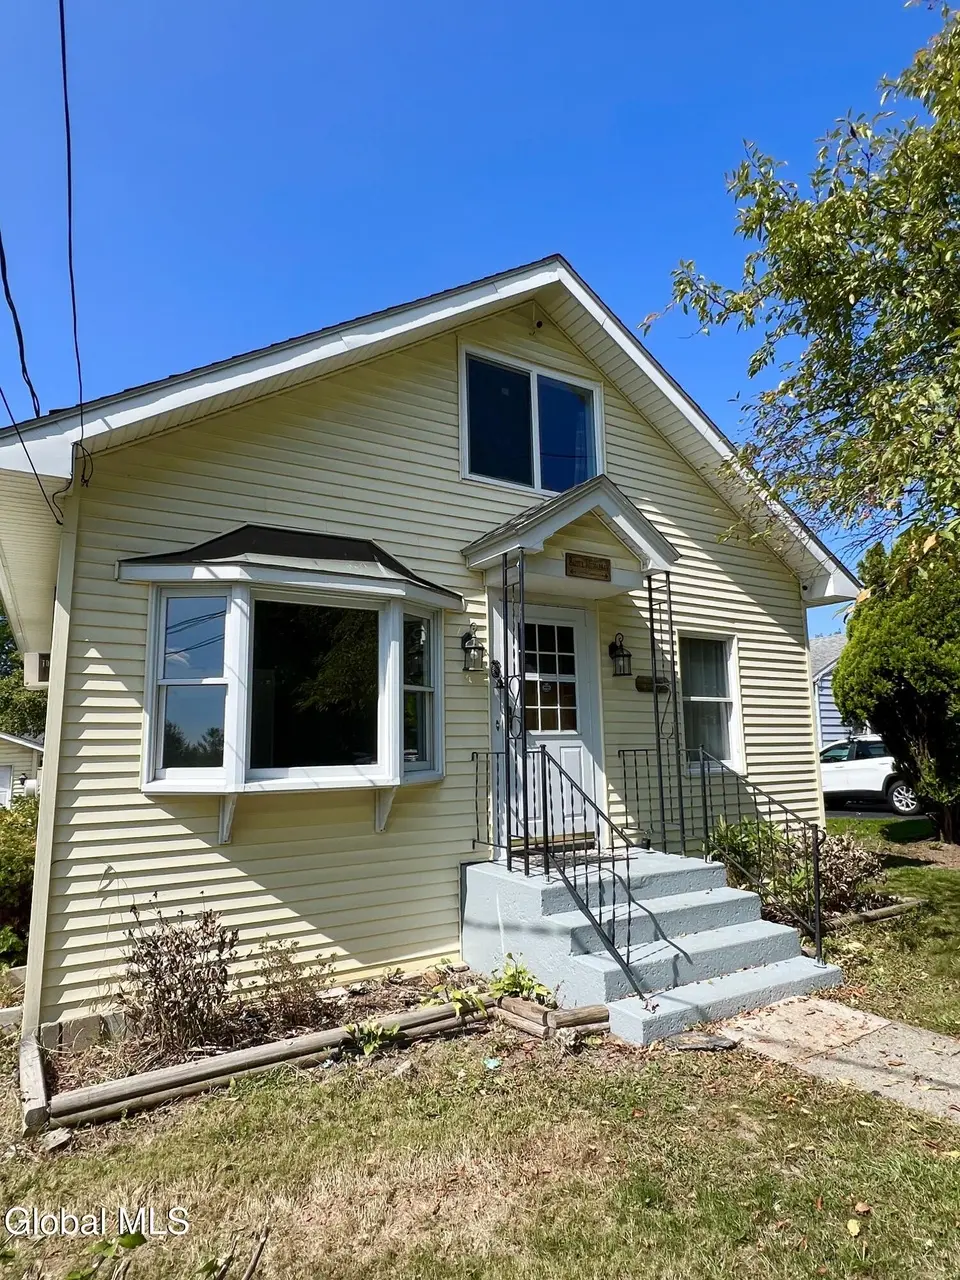
125 Joslen Blvd · Lorenz Park, NY
Flood risk 1/10 · Minimal
- FEMA flood zone
- —
- Chance of flooding over 30 yrs
- 0.0%
- Est. flood insurance / yr
- —
Fire risk 4/10 · Minor
- Est. fire insurance / yr
- $691 – $1,283
Heat risk 4/10 · Minor
- Hot days now (above 98°F)
- 7 days/yr
- Hot days in 30 yrs
- 16 days/yr
Wind risk 3/10 · Minor
- Chance of severe wind over 30 yrs
- 8.0%
Air-quality risk 2/10 · Minimal
- Unhealthy air days now
- 0 days/yr
- Unhealthy air days in 30 yrs
- 1 days/yr
Risk factors via First Street. Map © Google.
Why this score? — see what drove the B grade
The composite is a weighted blend of 9 inputs, each scored 0–100. Each bar is that input's sub-score; the figure is the points it added to the 100-point composite (weight × sub-score).
- Cash flow +22.2/30.0
- ARV discount +15.0/15.0
- Appreciation +10.0/10.0
- DSCR +7.1/10.0
- 1% rule +5.8/10.0
- Rent growth +5.0/5.0
- Schools +3.6/10.0
- Livability +3.5/5.0
- Condition / age +2.5/5.0
$299,000
🖨 Deal sheet 📄 Offer letter ✓ Due diligence
Listing remarks MLS
**Priced to sell** Imagine coming home to a space that just feels right, bright, welcoming, and perfectly suited between Hudson and Greenport shopping center. This corner lot, 3 bedroom, 2.5 bath home offers a great opportunity for both homeowners and investors. With its spacious layout and inviting living areas, the home provides comfortable everyday living while also presenting excellent potential to be utilized as a short-term rental. The finished basement can be used as additional living space or can be rented to help off-set the mortgage. This property offers both charm and versatility. Schedule your appointment today
Key facts
- Finished basement
- Corner lot
- 9,583 sq ft lot
Tags
Neighborhood map
What this means for you Summary
Snapshot
- This is a 3-bed/1.0-bath single-family listed at $299k.
Deal economics
- At list price, monthly cash flow is $485 ($6k/yr) — positive.
- The deal already cash-flows at list — no discount required.
- Meets the 1% rule at list price ($3k rent vs $299k).
- Recommended offer: $272k (9.0% below list) — sets the bar for market timing.
Location & tenants
- Location reads 69/100 on livability (#498 in NY) — a middle-class / working-renter tenant base. Strengths: housing A+, crime A, health & safety A; Watch: employment C-, schools F, amenities F.
- Hudson City School District (town): math 38% / reading 47% proficiency, ranked #494 of 590 in NY (top 84%) — families likely to look elsewhere, expect single-tenant / working-renter base with shorter leases.
- Market conditions: Rents rising fast (+10.9%/yr); 161 active listings in the ZIP; 13 comparable units currently listed for rent nearby; rentals lingering (median 44d on market — plan ~5-8 weeks vacancy on turnover, expect pricing pressure); 54% of comp listings sitting > 30 days — soft ceiling on asking rent; 136 units permitted in Columbia County in 2024 (0 in 5+ unit buildings).
- At $3,218/mo this rent would consume 53% of the median local household income ($73k/yr) (locally 1083% of renters already pay >50% of income on rent) — very limited rent-growth headroom before tenants either downsize or default.
Forward outlook
- In year one you build about $32k of equity ($2k loan paydown + $30k appreciation (10.0% local appreciation)).
- Columbia County population projected at -22% by 2050 — secular population decline; favor cash flow + early exit over multi-decade hold.
- At projected returns (10.0% appreciation + 8.0% rent growth), your $84k cash investment doubles in ~3 years — after that, you're playing with house money.
- By year 2, paydown + projected appreciation supports a ~$51k cash-out refi (75% LTV) — recoverable capital for the next deal without selling this one.
Negotiation context
- It's been on market 93 days — a 9% lower offer ($272k) is reasonable based on typical stale-listing flexibility.
- 3 sale attempts since 8y ago; this cycle's ask has dropped $60k (17%) from the opening price — seller is motivated, your offer sets the floor, not the list.
- Current owner paid $135k; list at $299k implies a 121% gain — meaningful room to come down on a strong offer.
Risks & watch-outs
- Watch-outs: built in 1933 — expect roof / HVAC / electrical / plumbing capex.
Questions for the listing agent
- It's been on market 93 days. Have you received any prior offers? Is the seller open to a 9% concession, seller financing, or rate buy-down credit?
- Built in 1933 — when were the roof, HVAC, electrical panel, plumbing, and water heater last replaced?
- Why hasn't it sold? Are there any deal-killer items the seller is aware of (foundation, flood, title, zoning, code violations)?
- Is there a deadline driving the sale (1031 exchange, divorce, estate, relocation)? That informs how much negotiation room exists.
- Schools are F-rated, which usually means shorter tenancies and higher turnover. Who's the typical renter profile here, and what's been the actual vacancy rate?
- What's the average days-on-market for RENTAL listings here right now (not sales)? A rising rental-DOM trend means longer vacancies and softer asking-rent achievability than the comps imply.
- What's the recent tenant-quality profile in this submarket — average credit score on applications, eviction rate, late-payment / NSF rate, and stable-employment percentage? A property-management company in the area should have these aggregated.
- How much new for-sale + rental construction is in the pipeline within 1–3 miles? Heavy new supply typically softens prices + rents 12–24 months out; constrained supply supports both.
Investment metrics
- 1% rule
- 1.08% ✓
- Cap rate
- 8.24%
- Cash-on-cash
- 6.94%
- DSCR
- 1.31
- GRM
- 7.7
CMA / ARV
- ARV (median comp)
- $407,141
- List price
- $299,000
- Delta
- -26.56%
- Verdict
- UNDERPRICED
- Comps
- 20 within 1.0 mi
Show comp detail 12 sales within ~0.75 mi
| Address | Dist | Beds/Ba | Sqft | Sold | Price | $/sf | Match |
|---|---|---|---|---|---|---|---|
| 276 Lincoln Blvd Blvd | 0.48mi | 3/1.0 | 1,410 (-2%) | 6mo | $310,000 | $220 | 68 |
| 9 E Marie St | 0.73mi | 3/1.0 | 1,421 (-2%) | 5mo | $342,000 | $241 | 59 |
| 10 Riverview Avenue Blvd | 0.42mi | 3/1.0 | 1,324 (-8%) | 10mo | $290,000 | $219 | 59 |
| 16 Oakwood Blvd | 0.36mi | 4/1.5 (+1) | 1,570 (+9%) | 8mo | $350,000 | $223 | 55 |
| 7 Charles St | 0.33mi | 3/1.0 | 1,248 (-14%) | 9mo | $195,000 | $156 | 54 |
| 311 Maryanne Ave | 0.69mi | 3/2.0 | 1,416 (-2%) | 9mo | $360,000 | $254 | 53 |
| 277 Anthony Ave | 0.53mi | 3/1.5 | 1,547 (+7%) | 12mo | $350,000 | $226 | 52 |
| 12 Fabiano Blvd | 0.21mi | 4/1.5 (+1) | 1,660 (+15%) | 10mo | $315,000 | $190 | 50 |
| 84 Harry Howard Ave | 0.69mi | 3/1.5 | 1,500 (+4%) | 11mo | $325,000 | $217 | 50 |
| 321 Lincoln Blvd | 0.69mi | 3/2.0 | 1,372 (-5%) | 6mo | $275,000 | $200 | 50 |
| 33 Parkwood Blvd | 0.45mi | 4/— (+1) | 1,287 (-11%) | 16mo | $337,900 | $263 | 42 |
| 305 Maryanne Ave | 0.65mi | 3/2.5 | 1,568 (+8%) | 20mo | $365,000 | $233 | 33 |
Match score weights: distance 35% · size 25% · config 20% · recency 20%. Top-matched comps best support the ARV.
Projected returns pro-forma
10.0% appreciation · 8.0% rent growth · sell at horizon
- IRR
- 31.4%
- Equity multiple
- 3.52×
- Total profit
- $210,753
- Equity at exit
- $269,363
- IRR
- 28.8%
- Equity multiple
- 8.63×
- Total profit
- $638,586
- Equity at exit
- $580,891
Cash invested: $83,720 (down + closing). Projections, not guarantees.
Landlord ↔ Tenant lean methodology
- Overall (STATE)
- 15 Strongly Tenant-Friendly
- State New York
- 15 Strongly Tenant-Friendly · D+10
- County
- — inherits STATE
- City
- — inherits STATE
ZIP-level market 12534
- Home prices YoY
- 5.6%
- Rents YoY
- 10.9%
- Active inventory
- 161
- Price-to-rent
- 7.7×
Monthly cashflow live
- Estimated rent
- $3,218 high interval (Pro) →
- Mortgage (P&I)
- −$1,568
- Tax from tax record
- −$365 /mo · $4,384/yr
- Insurance
- −$125
- HOA
- −$0
- Vacancy / Maint / Mgmt
- −$676
- Net cashflow
- $485
Break-even live
UW: 25.0% down · 7.5% · 30yr · 1.5% tax · 5.0% vac · 8.0% maint · 8.0% mgmt
Financing live
Cash to close
- Down payment
- $74,750
- Closing costs
- $8,970
- Reserves months
- —
- Total cash needed
- —
Loan-product check · same deal, 3 products live
Conventional
25% down · 7.5% · 30yr
- Down + closing
- —
- Monthly P&I
- —
- Monthly cashflow
- —
- DSCR
- —
- Eligible?
- —
Personal DTI + credit; lowest rate.
DSCR
20% down · 8.5% · 30yr
- Down + closing
- —
- Monthly P&I
- —
- Monthly cashflow
- —
- DSCR
- —
- Eligible?
- —
No personal income docs; deal must DSCR.
Hard money
10% down · 12.0% · 12mo
- Down + closing
- —
- Monthly P&I
- —
- Monthly cashflow
- —
- DSCR
- —
- Eligible?
- —
Short-term bridge; refi at stabilization.
Rent comps 13 comps
| Address | Beds | Baths | Sqft | Rent | $/sqft | DOM | Units | Dist |
|---|---|---|---|---|---|---|---|---|
| 72-74 Green St Unit 72a Hudson, NY | 2.0 | 1.5 | 911 | $3,000 | $3.29 | 43d | 1 | 0.81mi |
| 76 N 7th St Hudson, NY | 1.0–3.0 | 1.0–2.0 | 837 | $3,600 | $4.30 | 14d | 47 | 0.91mi |
| 823-825 Columbia St Unit 3 Hudson, NY | 3.0 | 1.0 | 1100 | $2,400 | $2.18 | 43d | 1 | 0.96mi |
| 437 State St Hudson, NY | 3.0 | 3.0 | 1800 | $8,000 | $4.44 | 43d | 1 | 1.03mi |
| 442 Columbia St Hudson, NY | 2.0 | 1.0 | 1100 | $1,850 | $1.68 | 43d | 1 | 1.06mi |
| 438 Warren St Hudson, NY | 2.0 | 1.5 | 1181 | $2,850 | $2.41 | 43d | 1 | 1.12mi |
| 227 Warren St Unit 3 Hudson, NY | 3.0 | 1.0 | 1400 | $2,600 | $1.86 | 23d | 1 | 1.29mi |
| 208 Warren St Unit 3 Hudson, NY | 2.0 | 1.0 | 1000 | $2,567 | $2.57 | 14d | 1 | 1.30mi |
| 208 Warren St Unit 6 Hudson, NY | 2.0 | 1.0 | 1000 | $2,850 | $2.85 | 43d | 1 | 1.30mi |
| 208 Warren St Unit 2 Hudson, NY | 2.0 | 1.0 | 1000 | $3,150 | $3.15 | 43d | 1 | 1.30mi |
| 210 Allen St Hudson, NY | 2.0 | 1.0 | 1400 | $2,900 | $2.07 | 23d | 1 | 1.39mi |
| 30 Union St Unit 2 Hudson, NY | 2.0 | 1.0 | 900 | $2,500 | $2.78 | 23d | 1 | 1.42mi |
| 540 Joslen Blvd Hudson, NY | 1.0–2.0 | 1.0–2.0 | 733 | $2,250 | $3.07 | 21d | 1 | 1.47mi |
Listing history 23 events
-
2026-06-18days on market $299,000 Active 93 DOM
-
2026-06-17days on market $299,000 Active 92 DOM
-
2026-06-16days on market $299,000 Active 91 DOM
-
2026-06-15days on market $299,000 Active 90 DOM
-
2026-06-14days on market $299,000 Active 88 DOM
-
2026-06-12days on market $299,000 Active 87 DOM
-
2026-06-09pricedays on market $299,000 Active 84 DOM
-
2026-06-08days on market $334,000 Active 83 DOM
-
2026-06-07days on market $334,000 Active 82 DOM
-
2026-06-04days on market $334,000 Active 78 DOM
-
2026-06-02days on market $334,000 Active 77 DOM
-
2026-06-01days on market $334,000 Active 76 DOM
-
2026-05-31days on market $334,000 Active 75 DOM
-
2026-05-31days on market $334,000 Active 74 DOM
-
2026-04-16price $334,000 633-char remark
Show marketing remark (633 chars)
**Priced to sell** Imagine coming home to a space that just feels right, bright, welcoming, and perfectly suited between Hudson and Greenport shopping center. This corner lot, 3 bedroom, 2.5 bath home offers a great opportunity for both homeowners and investors. With its spacious layout and inviting living areas, the home provides comfortable everyday living while also presenting excellent potential to be utilized as a short-term rental. The finished basement can be used as additional living space or can be rented to help off-set the mortgage. This property offers both charm and versatility. Schedule your appointment today
-
2026-03-15$359,000 Active 633-char remark
Show marketing remark (633 chars)
**Priced to sell** Imagine coming home to a space that just feels right, bright, welcoming, and perfectly suited between Hudson and Greenport shopping center. This corner lot, 3 bedroom, 2.5 bath home offers a great opportunity for both homeowners and investors. With its spacious layout and inviting living areas, the home provides comfortable everyday living while also presenting excellent potential to be utilized as a short-term rental. The finished basement can be used as additional living space or can be rented to help off-set the mortgage. This property offers both charm and versatility. Schedule your appointment today
-
2026-01-01historical
-
2025-11-04price $379,000
-
2025-09-24price $389,000
-
2025-09-08$399,000 Active
-
2019-12-09soldstatus $135,000
-
2019-12-05soldstatus $135,000
-
2018-09-27$142,500
ⓘ Source: listings_history table (triggers on properties + properties_extension) + one-shot
backfill from property_details.listing_events for pre-trigger history.
Tax reassessment forecast NY · Partial reset (capped growth)
- Current annual tax
- $4,384 · $365/mo
- Projected year-2 tax
- $4,719 · $393/mo
- Expected delta
- +$335/yr (+$28/mo · 7.6%)
ⓘ Screening estimate from a state-policy table — verify with the county assessor before closing.
Climate risk First Street
- Flood 1/10 Low 0% chance over 30 yrs
- Wildfire 4/10 Moderate
- Heat 4/10 Moderate 7 d/yr ≥98°F today · 16 d/yr by 30 yrs out
- Wind 3/10 Moderate 8% chance of damaging wind over 30 yrs
- Air quality 2/10 Low 0 unhealthy d/yr today · 1 by 30 yrs out
Nearby sold comps map
Loading sold comps map…
Walkable amenities ~0.75 mi
Loading nearby amenities…
Taxation est. · year 1
- Rental income
- $38,619
- − Mortgage interest
- −$16,749
- − Property taxes
- −$4,384
- − Insurance
- −$1,495
- − Repairs & maintenance
- −$3,090
- − Management
- −$3,090
- − Depreciation
- −$8,698
- Taxable income
- $1,114
- Est. tax owed @ 24.0%
- −$267
- After-tax cash flow
- $5,547/yr
For passive investors: Depreciation is non-cash, so a rental often shows a tax loss while cash-flowing — sheltering income. Rental losses are passive: they offset passive income freely, and up to $25,000/yr can offset ordinary (W-2) income if you actively participate and your MAGI is under $100k (phasing out to $0 by $150k); unused losses carry forward. On sale, claimed depreciation is recaptured at up to 25%, and gains may owe capital-gains tax (a 1031 exchange can defer both). Figures are a year-1 estimate at your 24.0% rate — not tax advice; consult a CPA.
Schools (NCES district)
- District
- Hudson City School District
- NCES district ID
- 3614940
- Math proficiency
- 38% ▲ 4.00%
- Reading proficiency
- 47% ▲ 7.00%
- Median HH income
- $44,663
- Composite
- 36.03/100
- National rank
- #4779
- State rank
- #494 of 590 in NY
Livability — Lorenz Park
- Score
- 69/100
- State rank
- #498
- US rank
- #8738
Category grades
Schools grade is shown separately in the Schools card above.
Census & demographics
- Census place
- Lorenz Park, NY
- County
- Columbia County · 17,176 people
- Metro
- Hudson, NY
- Population (ZIP)
- 17,176
- Household income
- $72,741
- Rent vs Own
- Severe rent burden
- 1083.0
Population outlook (Columbia County) Hauer SSP2
- Today (2025)
- 58,662 people
- By 2030
- 56,557 · -3.6%
- By 2040
- 51,324 · -12.5%
- By 2050
- 45,790 · -21.9%
- By 2075
- 35,232 · -39.9%
- By 2100
- 25,846 · -55.9%
Race, ethnicity, and origin ACS 2023
- Neighborhood character
- Predominantly White (74%)
- Race & ethnicity
- White 74% Two or more races 7% Black 7% Hispanic / Latino 7% Asian 6%
- Hispanic origin (detail)
- Mexican 2% Puerto Rican 1%
- Common ancestry
- Lithuanian 4% Romanian 4% Iranian 3%
- Foreign-born
- 10% · Canada, China
- Languages at home
- 88% English-only · Spanish 5% Other Indo-European 3% Chinese 1%
Political lean MEDSL · Columbia
- 2024 margin
- D (+14.7) · D 57.4% · R 42.6%
- 2008→2024 swing
- +1.3pp toward D · 2008: 13.4pp · 2024: 14.7pp
- All cycles
- 2024: D+14.7 2020: D+16.7 2016: D+1.4 2012: D+11.7 2008: D+13.4
Not yet ingested
- Civics
- —
Market trends
- HPI YoY
- ▲ 25.98%
- Current HPI
- 490.0412
- Rent YoY
- ▲ 10.88%
- Metro
- Hudson, NY
- State GDP YoY
- ▲ 2.60%
- F500 in state
- 92
Industry mix (Fortune 500 HQ in NY)
| Industry | F500 HQs | Revenue |
|---|---|---|
| Financial Services | 10 | $950B |
|
||
| Consumer Goods | 9 | $162B |
|
||
| Insurance | 4 | $225B |
|
||
| Telecommunications | 2 | $144B |
|
||
| Pharmaceuticals | 2 | $112B |
|
||
| Media / Entertainment | 2 | $69B |
|
||
Price history
+134.4% since first listed9 events — show timeline
- 2026-04-16 Price Changed $334,000 Global MLS
- 2026-03-15 Listed $359,000 Global MLS
- 2026-01-01 Listing Removed — Global MLS
- 2025-11-04 Price Changed $379,000 Global MLS
- 2025-09-24 Price Changed $389,000 Global MLS
- 2025-09-08 Listed $399,000 Global MLS
- 2019-12-09 Sold (Public Records) $135,000 Public Records
- 2019-12-05 Sold (MLS) $135,000 HVCRMLS
- 2018-09-27 Listed $142,500 HVCRMLS
Property tax history
+12.6%/yrLatest (2025): $4,384 · +11.4% YoY. Source: county tax records.
Cash-flow waterfall
monthlySold comps — $/sqft
last 12 mo · ≤1 miLoading sold comps…