 Triplex
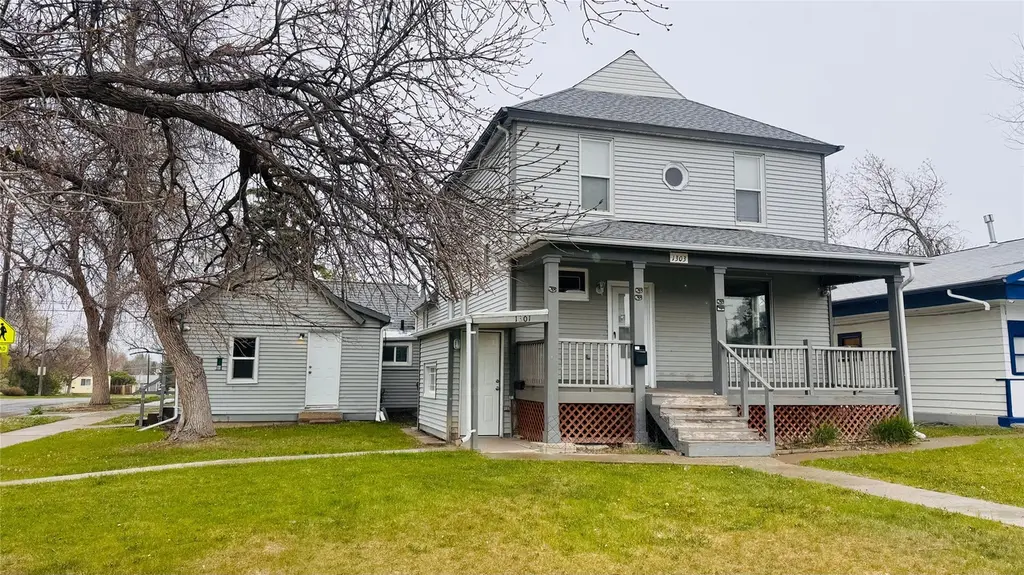
1301/1303 6th Ave S · Great Falls, MT
Flood risk 1/10 · Minimal
- FEMA flood zone
- X (unshaded)
- Chance of flooding over 30 yrs
- 0.0%
- Est. flood insurance / yr
- $507 – $1,088
Fire risk 1/10 · Minimal
- Est. fire insurance / yr
- $918 – $1,706
Heat risk 2/10 · Minimal
- Hot days now (above 92°F)
- 7 days/yr
- Hot days in 30 yrs
- 15 days/yr
Wind risk 1/10 · Minimal
- Chance of severe wind over 30 yrs
- —
Air-quality risk 5/10 · Moderate
- Unhealthy air days now
- 8 days/yr
- Unhealthy air days in 30 yrs
- 9 days/yr
Risk factors via First Street. Map © Google.
Why this score? — see what drove the C- grade
The composite is a weighted blend of 9 inputs, each scored 0–100. Each bar is that input's sub-score; the figure is the points it added to the 100-point composite (weight × sub-score).
- Cash flow +24.0/30.0
- DSCR +7.7/10.0
- 1% rule +6.2/10.0
- Livability +3.9/5.0
- Rent growth +3.4/5.0
- Schools +2.8/10.0
- Condition / age +2.2/5.0
- ARV discount +0.0/15.0
- Appreciation +0.0/10.0
$448,000
🖨 Deal sheet 📄 Offer letter ✓ Due diligence
Multi-family units
County records classify this as Multi-Family (2-4 Unit). Listing-text estimate: 3 units. confirmed
Key facts
- Remodeled
- Up down duplex
- Close to downtown
Tags
Property features AI
Finance
- Financial info: Property type: Residential income (Triplex); Unit 1301 (lower): projected rent $950 when completed; Unit 1303: projected rent (actual rent listed for one unit at $2,000); 524 House unit: actual rent $1,100; Three rental units total
Exterior
- Parking: On-street parking
- Security: Smoke detector(s)
- Utilities: Public water; Public sewer; Electricity connected; Natural gas connected / available; Cable available
- Home design: Triplex residential income property; Private entrances; One- and two-level layout
- Construction: Vinyl siding; Composition roof; Foundation: slab and stone; Built/updated and remodeled condition
- Exterior features: Patio; Level lot; Asphalt road frontage on a city street; Publicly maintained road
Interior
- Kitchen: Dishwasher; Range; Refrigerator
- Bedrooms: Lower unit: 2 bedrooms; Unit 1303: 5 bedrooms; 524 House unit: 1 bedroom
- Bathrooms: Lower unit: 1 bathroom; Unit 1303: 2 bathrooms; 524 House unit: 1 bathroom
- Interior features: Updated/remodeled condition; Dishwasher; Range; Refrigerator; Smoke detector(s)
- Laundry & utility: Washer hookup in multiple locations
Neighborhood map
What this means for you Summary
Snapshot
- This is a 3 × 3-bed/?-bath units multifamily listed at $448k. Condition is rated fair.
Deal economics
- At list price, monthly cash flow is $878 ($11k/yr) — positive. Per door: $293/mo.
- The deal already cash-flows at list — no discount required.
- Meets the 1% rule at list price ($5k rent vs $448k).
- Recommended offer: $435k (3.0% below list) — sets the bar for market timing.
- Cap rate 8.6% vs local median 3.5% in Great Falls — top-decile yield for the area; either an underpriced asset or a hidden risk that comps aren't pricing in. Stress-test before assuming the spread holds.
Location & tenants
- Location reads 78/100 on livability (#19 in MT, #2,473 nationally) — a middle-class / working-renter tenant base. Strengths: amenities A+, cost of living A+, housing A+; Watch: schools C-, employment C-, crime F.
- Great Falls H S (urban): math 27% / reading 39% proficiency, ranked #79 of 116 in MT (top 68%) — families likely to look elsewhere, expect single-tenant / working-renter base with shorter leases.
- Market conditions: Rents rising (+3.6%/yr); 111 active listings in the ZIP; 223 units permitted in Cascade County in 2024 (37 in 5+ unit buildings).
- At $5,031/mo this rent would consume 102% of the median local household income ($59k/yr) (locally 1123% of renters already pay >50% of income on rent) — very limited rent-growth headroom before tenants either downsize or default.
Forward outlook
- Local home prices are declining (-3.0%/yr); year-one equity from $3k of loan paydown is wiped out by about $13k of value loss. Plan a longer hold.
- Cascade County population projected to shrink 5% by 2050 — rents likely to lag national; underwrite the cash flow, not the appreciation.
Negotiation context
- It's been on market 45 days — a 3% lower offer ($435k) is reasonable based on typical stale-listing flexibility.
Risks & watch-outs
- Watch-outs: built in 1900 — expect roof / HVAC / electrical / plumbing capex.
Questions for the listing agent
- It's been on market 45 days. Have you received any prior offers? Is the seller open to a 3% concession, seller financing, or rate buy-down credit?
- Can we see the unit-by-unit rent roll, current vacancy, and any below-market leases? What's the average tenancy length?
- What capital expenditures (roof, boiler, parking lot, exteriors) have been made in the last 5 years, and what's planned in the next 2?
- Have any recent inspections been done? Can we get a copy of the seller's disclosures and any deferred-maintenance estimates?
- Built in 1900 — when were the roof, HVAC, electrical panel, plumbing, and water heater last replaced?
- Is there a deadline driving the sale (1031 exchange, divorce, estate, relocation)? That informs how much negotiation room exists.
- Crime grade is F in this area — have there been break-ins, vandalism, or insurance claims at this property in the last 3 years? What carrier currently insures it and at what premium?
- What's the average days-on-market for RENTAL listings here right now (not sales)? A rising rental-DOM trend means longer vacancies and softer asking-rent achievability than the comps imply.
- What's the recent tenant-quality profile in this submarket — average credit score on applications, eviction rate, late-payment / NSF rate, and stable-employment percentage? A property-management company in the area should have these aggregated.
- How much new apartment / multifamily construction is in the pipeline within 1–3 miles? Heavy new supply (>2% of stock underway) typically softens rents 12–24 months out; light construction supports rent growth.
Investment metrics
- 1% rule
- 1.12% ✓
- Cap rate
- 8.65%
- Cash-on-cash
- 8.40%
- DSCR
- 1.37
- GRM
- 7.4
CMA / ARV
- ARV (on-the-fly)
- $352,374
- Comps found
- 1
Show comp detail 1 sale within ~0.75 mi
| Address | Dist | Beds/Ba | Sqft | Sold | Price | $/sf | Match |
|---|---|---|---|---|---|---|---|
| 1011 6th Ave S Unit 1009-1011 | 0.23mi | 8/5.0 (-1) | 3,302 (+7%) | 22mo | $375,000 | $114 | 50 |
Match score weights: distance 35% · size 25% · config 20% · recency 20%. Top-matched comps best support the ARV.
Projected returns pro-forma
-3.0% appreciation · 3.64% rent growth · sell at horizon
- IRR
- -2.8%
- Equity multiple
- 0.89×
- Total profit
- $-13,309
- Equity at exit
- $66,798
- IRR
- 7.6%
- Equity multiple
- 1.59×
- Total profit
- $74,317
- Equity at exit
- $38,735
Cash invested: $125,440 (down + closing). Projections, not guarantees.
Landlord ↔ Tenant lean methodology
- Overall (STATE)
- 82 Strongly Landlord-Friendly
- State Montana
- 82 Strongly Landlord-Friendly · R+11
- County
- — inherits STATE
- City
- — inherits STATE
ZIP-level market 59405
- Rents YoY
- 3.6%
- Active inventory
- 111
- Price-to-rent
- 22.3×
Monthly cashflow live
- Estimated rent
- $5,031 medium interval (Pro) →
- Mortgage (P&I)
- −$2,349
- Tax est. 1.5%
- −$560 /mo · $6,720/yr
- Insurance
- −$187
- HOA
- −$0
- Vacancy / Maint / Mgmt
- −$1,057
- Net cashflow
- $878
Break-even live
3-unit breakdown (identical units grouped — click to expand)
| Units | Beds | Baths | Est. rent |
|---|---|---|---|
| 3× units | 3 | — | $5,031 |
| #1 | 3 | — | $1,677 |
| #2 | 3 | — | $1,677 |
| #3 | 3 | — | $1,677 |
| Total (3 units) | $5,031 | ||
UW: 25.0% down · 7.5% · 30yr · 1.5% tax · 5.0% vac · 8.0% maint · 8.0% mgmt
Financing live
Cash to close
- Down payment
- $112,000
- Closing costs
- $13,440
- Reserves months
- —
- Total cash needed
- —
Loan-product check · same deal, 3 products live
Conventional
25% down · 7.5% · 30yr
- Down + closing
- —
- Monthly P&I
- —
- Monthly cashflow
- —
- DSCR
- —
- Eligible?
- —
Personal DTI + credit; lowest rate.
DSCR
20% down · 8.5% · 30yr
- Down + closing
- —
- Monthly P&I
- —
- Monthly cashflow
- —
- DSCR
- —
- Eligible?
- —
No personal income docs; deal must DSCR.
Hard money
10% down · 12.0% · 12mo
- Down + closing
- —
- Monthly P&I
- —
- Monthly cashflow
- —
- DSCR
- —
- Eligible?
- —
Short-term bridge; refi at stabilization.
Listing history 19 events
-
2026-06-19days on market $448,000 Active 45 DOM
-
2026-06-18days on market $448,000 Active 44 DOM
-
2026-06-17days on market $448,000 Active 43 DOM
-
2026-06-16days on market $448,000 Active 42 DOM
-
2026-06-15days on market $448,000 Active 41 DOM
-
2026-06-14days on market $448,000 Active 39 DOM
-
2026-06-13days on market $448,000 Active 38 DOM
-
2026-06-10days on market $448,000 Active 36 DOM
-
2026-06-09days on market $448,000 Active 35 DOM
-
2026-06-08days on market $448,000 Active 34 DOM
-
2026-06-07days on market $448,000 Active 33 DOM
-
2026-06-05days on market $448,000 Active 30 DOM
-
2026-06-03days on market $448,000 Active 29 DOM
-
2026-06-03price $448,000 Active 28 DOM
-
2026-06-02days on market $460,000 Active 28 DOM
-
2026-06-01days on market $460,000 Active 27 DOM
-
2026-05-31days on market $460,000 Active 26 DOM
-
2026-05-30days on market $460,000 Active 25 DOM
-
2026-05-05$460,000 Active
ⓘ Source: listings_history table (triggers on properties + properties_extension) + one-shot
backfill from property_details.listing_events for pre-trigger history.
Climate risk First Street
- Flood 1/10 Low FEMA zone X (unshaded) · 0% chance over 30 yrs
- Wildfire 1/10 Low
- Heat 2/10 Low 7 d/yr ≥92°F today · 15 d/yr by 30 yrs out
- Wind 1/10 Low
- Air quality 5/10 Major 8 unhealthy d/yr today · 9 by 30 yrs out
Nearby sold comps map
Loading sold comps map…
Walkable amenities ~0.75 mi
Loading nearby amenities…
Taxation est. · year 1
- Rental income
- $60,372
- − Mortgage interest
- −$25,095
- − Property taxes
- −$6,720
- − Insurance
- −$2,240
- − Repairs & maintenance
- −$4,830
- − Management
- −$4,830
- − Depreciation
- −$13,033
- Taxable income
- $3,625
- Est. tax owed @ 24.0%
- −$870
- After-tax cash flow
- $9,672/yr
For passive investors: Depreciation is non-cash, so a rental often shows a tax loss while cash-flowing — sheltering income. Rental losses are passive: they offset passive income freely, and up to $25,000/yr can offset ordinary (W-2) income if you actively participate and your MAGI is under $100k (phasing out to $0 by $150k); unused losses carry forward. On sale, claimed depreciation is recaptured at up to 25%, and gains may owe capital-gains tax (a 1031 exchange can defer both). Figures are a year-1 estimate at your 24.0% rate — not tax advice; consult a CPA.
Condition & rehab AI · 13 photos
The property requires moderate renovations to its kitchen, bathrooms, and flooring, as well as some maintenance to the exterior and landscaping. These updates will significantly increase its resale and rental value.
Repairs flagged
- Major Kitchen appliances — Older and outdated
- Major Bathroom fixtures — Older and outdated
- Major Flooring — Older and outdated
- Minor Paint — Faded
Value-add opportunities
- Resale New kitchen appliances — Modern appliances will attract more buyers
- Resale New bathroom fixtures — Modern fixtures will attract more buyers
- Resale New flooring — New flooring will make the home more appealing
- Resale Painting — Fresh paint will make the home more appealing
- Both Landscaping — Well-maintained landscaping will improve curb appeal and attract more tenants
Renovation cost estimate screening
| Repair item | Severity | Est. cost |
|---|---|---|
| Kitchen appliances · Older and outdated | Major | $15,000–50,000 |
| Bathroom fixtures · Older and outdated | Major | $15,000–50,000 |
| Flooring · Older and outdated | Major | $15,000–50,000 |
| Paint · Faded | Minor | $500–3,000 |
| Total estimated repair cost · 4 items | $45,500–153,000 |
Value-add ROI direction
- Resale New kitchen appliances — Modern appliances will attract more buyers ↑
- Resale New bathroom fixtures — Modern fixtures will attract more buyers ↑
- Resale New flooring — New flooring will make the home more appealing ↑
- Resale Painting — Fresh paint will make the home more appealing ↑
- Both Landscaping — Well-maintained landscaping will improve curb appeal and attract more tenants ↑
ⓘ Cost ranges are severity-bucket heuristics (US national rule-of-thumb). Get contractor quotes + a written scope before underwriting a rehab budget.
Schools (NCES district)
- District
- Great Falls H S
- NCES district ID
- 3013050
- Math proficiency
- 27% ▼ -6.00%
- Reading proficiency
- 39% ▼ -3.00%
- Median HH income
- $43,586
- Composite
- 28.03/100
- National rank
- #6846
- State rank
- #79 of 116 in MT
Livability — Great Falls
- Score
- 78/100
- State rank
- #19
- US rank
- #2473
Category grades
Schools grade is shown separately in the Schools card above.
Census & demographics
- Census place
- Great Falls, MT
- County
- Cascade County · 75,427 people
- City population
- 75,427
- Metro
- Great Falls, MT
- Population (ZIP)
- 33,350
- Household income
- $59,449
- Rent vs Own
- Severe rent burden
- 1123.0
Population outlook (Cascade County) Hauer SSP2
- Today (2025)
- 81,936 people
- By 2030
- 81,376 · -0.7%
- By 2040
- 79,435 · -3.1%
- By 2050
- 77,906 · -4.9%
- By 2075
- 78,595 · -4.1%
- By 2100
- 79,997 · -2.4%
Race, ethnicity, and origin ACS 2023
- Neighborhood character
- Predominantly White (79%)
- Race & ethnicity
- White 79% Two or more races 10% Hispanic / Latino 6% Native American 4% Black 2% Asian 2%
- Hispanic origin (detail)
- Mexican 4%
- Common ancestry
- Portuguese 8% Italian 3% Romanian 2%
- Foreign-born
- 2%
- Languages at home
- 95% English-only · Spanish 2% German/W. Germanic 1%
Political lean MEDSL · Cascade
- 2024 margin
- Strong R (+22.3) · D 37.3% · R 59.6% · Other 3.0%
- 2008→2024 swing
- -24.6pp toward R · 2008: 2.3pp · 2024: -22.3pp
- All cycles
- 2024: R+22.3 2020: R+19.7 2016: R+21.6 2012: R+9.1 2008: D+2.3
Not yet ingested
- Civics
- —
Market trends
- HPI YoY
- ▼ -121.87%
- Current HPI
- 213.0016
- Rent YoY
- ▲ 3.64%
- Metro
- Great Falls, MT
- State GDP YoY
- ▲ 3.41%
- F500 in state
- 2
Industry mix (Fortune 500 HQ in MT)
| Industry | F500 HQs | Revenue |
|---|---|---|
| Technology / Analytics | 1 | $2B |
|
||
Price history
1 event — show timeline
- 2026-05-05 Listed $460,000 MRMLS
Cash-flow waterfall
monthlySold comps — $/sqft
last 12 mo · ≤1 miLoading sold comps…