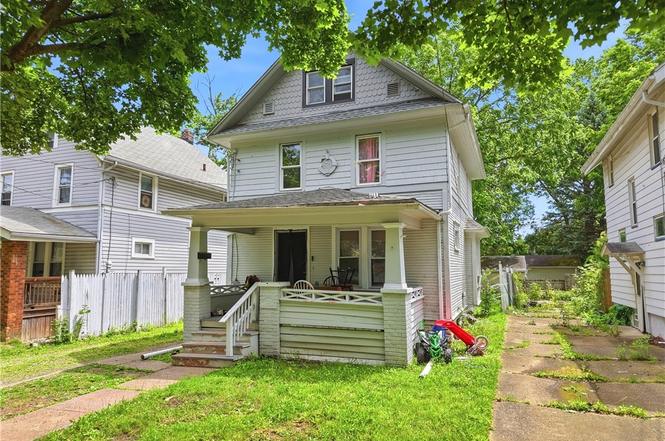
317 Black St · Akron, OH
Flood risk 1/10 · Minimal
- FEMA flood zone
- X (unshaded)
- Chance of flooding over 30 yrs
- 0.0%
- Est. flood insurance / yr
- $473 – $860
Fire risk 1/10 · Minimal
- Est. fire insurance / yr
- $713 – $1,323
Heat risk 3/10 · Minor
- Hot days now (above 97°F)
- 7 days/yr
- Hot days in 30 yrs
- 17 days/yr
Wind risk 1/10 · Minimal
- Chance of severe wind over 30 yrs
- —
Air-quality risk 3/10 · Minor
- Unhealthy air days now
- 2 days/yr
- Unhealthy air days in 30 yrs
- 4 days/yr
Risk factors via First Street. Map © Google.
Why this score? — see what drove the C grade
The composite is a weighted blend of 9 inputs, each scored 0–100. Each bar is that input's sub-score; the figure is the points it added to the 100-point composite (weight × sub-score).
- Cash flow +27.7/30.0
- DSCR +9.8/10.0
- 1% rule +7.1/10.0
- Rent growth +4.4/5.0
- Livability +4.0/5.0
- Condition / age +2.5/5.0
- Schools +2.1/10.0
- ARV discount +0.0/15.0
- Appreciation +0.0/10.0
$105,000
🖨 Deal sheet 📄 Offer letter ✓ Due diligence
Listing remarks
Income-Producing Investment Property with Established Tenant – Turnkey Opportunity in Akron! Attention investors and savvy buyers! This income-producing rental property offers immediate cash flow with a tenant already in place for approximately 18 months. Whether you're looking to expand your investment portfolio or purchase your first rental property, this move-in-ready home offers strong income potential and a convenient Akron location. The home features 3 bedrooms, 1 full bath, and additional living space in the attic, providing flexibility for a home office, bonus room, recreation area, or storage. Recent improvements include luxury vinyl tile (LVT) flooring, new carpet, new wi
Key facts
- New carpet
- Established tenant
- Updated interior
Tags
Property features AI
Finance
- Financial info: Annual tax amount reported (amount excluded by instructions)
Exterior
- Parking: Gravel parking
- Utilities: Public water; Public sewer
- Home design: 3-story building; Aluminum siding exterior; Asphalt roof
- Construction: Built year source: public records
- Exterior features: Lot approximately 0.0802 acres
Interior
- Bedrooms: Total of 7 rooms (bedroom count not specified)
- Bathrooms: 1 full bathroom
- Heating & cooling: Gas heating; Ceiling fans for cooling
- Interior features: Full basement
Neighborhood map
What this means for you Summary
Snapshot
- This is a 4-bed/1.0-bath single-family listed at $105k.
Deal economics
- At list price, monthly cash flow is $318 ($4k/yr) — positive.
- The deal already cash-flows at list — no discount required.
- Meets the 1% rule at list price ($1k rent vs $105k).
- Cap rate 9.9% vs local median 6.6% in Akron — top-decile yield for the area; either an underpriced asset or a hidden risk that comps aren't pricing in. Stress-test before assuming the spread holds.
Location & tenants
- Location reads 81/100 on livability (#104 in OH, #1,591 nationally) — a professional / high-income tenant draw. Strengths: amenities A+, commute A+, cost of living A+; Watch: crime F, employment F.
- Akron City (urban): math 22% / reading 30% proficiency, ranked #602 of 656 in OH (top 92%) — low school quality limits family demand, transient renter base, plan for 1-2y turnover; 66% free/reduced lunch — lower-income household profile, screen leases tightly.
- Market conditions: Rents rising fast (+7.6%/yr); 69 active listings in the ZIP; 40 comparable units currently listed for rent nearby; rentals at typical pace (median 23d on market — plan ~3-4 weeks tenant-placement turnaround); 45% of comp listings sitting > 30 days — soft ceiling on asking rent; lower-income renter base — watch delinquency; 1,114 units permitted in Summit County in 2024 (397 in 5+ unit buildings).
- This rent runs 36% of the median local income ($42k/yr) — at the standard rent-burdened threshold; future hikes will face affordability resistance.
Forward outlook
- Local home prices are declining (-3.0%/yr); year-one equity from $726 of loan paydown is wiped out by about $3k of value loss. Plan a longer hold.
- Summit County population projected to shrink 6% by 2050 — rents likely to lag national; underwrite the cash flow, not the appreciation.
- At projected returns (-3.0% appreciation + 7.6% rent growth), your $29k cash investment doubles in ~7 years — after that, you're playing with house money.
Negotiation context
- Only 1 days on market — expect competitive offers; lowballing is unlikely to land.
- 20 sale attempts since 29y ago with the ask held roughly flat each time — persistent listings suggest the price (not the market) is what's stuck; bring a comps-based counter.
Risks & watch-outs
- Watch-outs: built in 1919 — expect roof / HVAC / electrical / plumbing capex.
Questions for the listing agent
- Built in 1919 — when were the roof, HVAC, electrical panel, plumbing, and water heater last replaced?
- Is there a deadline driving the sale (1031 exchange, divorce, estate, relocation)? That informs how much negotiation room exists.
- Crime grade is F in this area — have there been break-ins, vandalism, or insurance claims at this property in the last 3 years? What carrier currently insures it and at what premium?
- What's the average days-on-market for RENTAL listings here right now (not sales)? A rising rental-DOM trend means longer vacancies and softer asking-rent achievability than the comps imply.
- What's the recent tenant-quality profile in this submarket — average credit score on applications, eviction rate, late-payment / NSF rate, and stable-employment percentage? A property-management company in the area should have these aggregated.
- How much new for-sale + rental construction is in the pipeline within 1–3 miles? Heavy new supply typically softens prices + rents 12–24 months out; constrained supply supports both.
Investment metrics
- 1% rule
- 1.21% ✓
- Cap rate
- 9.93%
- Cash-on-cash
- 12.98%
- DSCR
- 1.58
- GRM
- 6.9
CMA / ARV
- ARV (on-the-fly)
- $83,616
- Comps found
- 12
Show comp detail 12 sales within ~0.75 mi
| Address | Dist | Beds/Ba | Sqft | Sold | Price | $/sf | Match |
|---|---|---|---|---|---|---|---|
| 374 Gibbs Pl | 0.22mi | 3/1.0 (-1) | 1,350 (+8%) | 8mo | $80,000 | $59 | 65 |
| 495 Elbon Ave | 0.61mi | 3/1.0 (-1) | 1,267 (+2%) | 4mo | $75,000 | $59 | 60 |
| 70 Wise St | 0.54mi | 3/1.0 (-1) | 1,197 (-4%) | 5mo | $80,000 | $67 | 59 |
| 591 Hedden Ave | 0.68mi | 3/1.0 (-1) | 1,224 (-2%) | 2mo | $63,500 | $52 | 58 |
| 508 Crouse St | 0.48mi | 4/2.0 | 1,370 (+10%) | 2mo | $62,500 | $46 | 56 |
| 863 Bank St | 0.69mi | 3/1.0 (-1) | 1,226 (-2%) | 5mo | $82,000 | $67 | 56 |
| 828 Crouse St | 0.13mi | 3/2.0 (-1) | 1,072 (-14%) | 8mo | $92,000 | $86 | 55 |
| 538 Hammel St | 0.58mi | 3/1.0 (-1) | 1,298 (+4%) | 8mo | $123,000 | $95 | 54 |
| 906 E Buchtel Ave | 0.59mi | 3/1.0 (-1) | 1,372 (+10%) | 2mo | $22,000 | $16 | 49 |
| 522 Winans Ave | 0.75mi | 3/1.0 (-1) | 1,373 (+10%) | 5mo | $95,000 | $69 | 40 |
| 642 Gridley Ave | 0.70mi | 4/2.0 | 1,399 (+12%) | 5mo | $45,000 | $32 | 39 |
| 1172 5th Ave | 0.73mi | 4/2.5 | 1,428 (+14%) | 1mo | $233,000 | $163 | 35 |
Match score weights: distance 35% · size 25% · config 20% · recency 20%. Top-matched comps best support the ARV.
Projected returns pro-forma
-3.0% appreciation · 7.63% rent growth · sell at horizon
- IRR
- 7.8%
- Equity multiple
- 1.32×
- Total profit
- $9,418
- Equity at exit
- $15,656
- IRR
- 20.6%
- Equity multiple
- 3.11×
- Total profit
- $62,161
- Equity at exit
- $9,078
Cash invested: $29,400 (down + closing). Projections, not guarantees.
Landlord ↔ Tenant lean methodology
- Overall (STATE)
- 73 Landlord-Friendly
- State Ohio
- 73 Landlord-Friendly · R+6
- County
- — inherits STATE
- City
- — inherits STATE
ZIP-level market 44306
- Rents YoY
- 7.6%
- Active inventory
- 69
- Price-to-rent
- 6.9×
Monthly cashflow live
- Estimated rent
- $1,267 high interval (Pro) →
- Mortgage (P&I)
- −$551
- Tax from tax record
- −$88 /mo · $1,061/yr
- Insurance
- −$44
- HOA
- −$0
- Vacancy / Maint / Mgmt
- −$266
- Net cashflow
- $318
Break-even live
UW: 25.0% down · 7.5% · 30yr · 1.5% tax · 5.0% vac · 8.0% maint · 8.0% mgmt
Financing live
Cash to close
- Down payment
- $26,250
- Closing costs
- $3,150
- Reserves months
- —
- Total cash needed
- —
Loan-product check · same deal, 3 products live
Conventional
25% down · 7.5% · 30yr
- Down + closing
- —
- Monthly P&I
- —
- Monthly cashflow
- —
- DSCR
- —
- Eligible?
- —
Personal DTI + credit; lowest rate.
DSCR
20% down · 8.5% · 30yr
- Down + closing
- —
- Monthly P&I
- —
- Monthly cashflow
- —
- DSCR
- —
- Eligible?
- —
No personal income docs; deal must DSCR.
Hard money
10% down · 12.0% · 12mo
- Down + closing
- —
- Monthly P&I
- —
- Monthly cashflow
- —
- DSCR
- —
- Eligible?
- —
Short-term bridge; refi at stabilization.
Rent comps 40 comps
| Address | Beds | Baths | Sqft | Rent | $/sqft | DOM | Units | Dist |
|---|---|---|---|---|---|---|---|---|
| 987 Boone St Akron, OH | 3.0 | 1.0 | 1248 | $1,100 | $0.88 | 23d | 1 | 0.13mi |
| 344 Lease St Akron, OH | 3.0 | 1.0 | 1000 | $1,199 | $1.20 | 43d | 1 | 0.28mi |
| 878 Clark St Akron, OH | 3.0 | 2.0 | 1029 | $1,440 | $1.40 | 43d | 1 | 0.32mi |
| 1071 Ackley St Akron, OH | 4.0 | 2.0 | 1164 | $1,175 | $1.01 | 43d | 1 | 0.33mi |
| 166 Chittenden St Akron, OH | 3.0 | 1.0 | 1020 | $985 | $0.97 | 43d | 1 | 0.47mi |
| 846 Lee Dr Akron, OH | 4.0 | 1.0 | 1433 | $1,325 | $0.92 | 14d | 1 | 0.49mi |
| 846 Lee Dr Akron, OH | 4.0 | 1.5 | 1433 | $1,325 | $0.92 | 23d | 1 | 0.49mi |
| 77 Kent Ct Akron, OH | 4.0 | 1.0 | 1300 | $1,200 | $0.92 | 43d | 1 | 0.49mi |
| 1125 2nd Ave Akron, OH | 3.0 | 1.0 | 1373 | $1,100 | $0.80 | 23d | 1 | 0.53mi |
| 490 Gage St Akron, OH | 4.0 | 1.0 | 1326 | $1,053 | $0.79 | 43d | 1 | 0.58mi |
| 461 Spicer St Akron, OH | 3.0 | 2.0 | 1000 | $995 | $0.99 | 43d | 1 | 0.61mi |
| 420 Power St Akron, OH | 3.0 | 1.0 | 900 | $800 | $0.89 | 23d | 1 | 0.68mi |
| 418 Power St Akron, OH | 3.0 | 1.0 | 1000 | $999 | $1.00 | 23d | 1 | 0.69mi |
| 548 Spicer St Akron, OH | 4.0 | 2.0 | 1487 | $1,100 | $0.74 | 23d | 1 | 0.71mi |
| 1182 5th Ave Akron, OH | 3.0 | 1.0 | 1248 | $1,250 | $1.00 | 14d | 1 | 0.75mi |
| 621 Hudson Ave Akron, OH | 3.0 | 1.0 | 780 | $1,100 | $1.41 | 14d | 1 | 0.79mi |
| 356 Rankin St Akron, OH | 4.0 | 1.5 | 1186 | $1,197 | $1.01 | 23d | 1 | 0.81mi |
| 488 Alexander St Akron, OH | 4.0 | 2.0 | 1311 | $1,350 | $1.03 | 23d | 1 | 0.82mi |
| 208 Denver St Akron, OH | 3.0 | 1.0 | 1248 | $895 | $0.72 | 43d | 1 | 0.84mi |
| 287 Wheeler St Akron, OH | 3.0 | 1.0 | 1100 | $1,350 | $1.23 | 23d | 1 | 0.85mi |
| 990 Baird St Akron, OH | 3.0 | 1.0 | 1140 | $1,250 | $1.10 | 43d | 1 | 0.86mi |
| 421 Allyn St Unit 2 Akron, OH | 3.0 | 1.0 | 743 | $850 | $1.14 | 43d | 1 | 0.90mi |
| 208 Barder Ave Akron, OH | 3.0 | 1.0 | 924 | $1,050 | $1.14 | 43d | 1 | 0.91mi |
| 689 Kling St Akron, OH | 3.0 | 1.0 | 780 | $1,075 | $1.38 | 21d | 1 | 0.92mi |
| 437 Sumner St Apt A Akron, OH | 3.0 | 1.5 | 750 | $1,200 | $1.60 | 23d | 1 | 0.96mi |
| 1113 Smithfarm Ave Akron, OH | 3.0 | 2.0 | 1296 | $1,600 | $1.23 | 23d | 1 | 0.96mi |
| 406 Sumner St Akron, OH | 2.0–4.0 | 1.0–2.0 | 836 | $1,295 | $1.55 | 14d | 3 | 0.99mi |
| 374 E Voris St Akron, OH | 3.0 | 1.0 | 876 | $1,150 | $1.31 | 23d | 1 | 0.99mi |
| 796 Brown St Akron, OH | 4.0 | 2.0 | 1200 | $900 | $0.75 | 43d | 1 | 1.00mi |
| 566 Sumner St Akron, OH | 4.0 | 1.0 | 1170 | $1,200 | $1.03 | 43d | 1 | 1.01mi |
| 240 Arch St Akron, OH | 3.0 | 1.0 | 1182 | $1,375 | $1.16 | 43d | 1 | 1.02mi |
| 248 Arch St Akron, OH | 3.0 | 1.0 | 1210 | $1,300 | $1.07 | 43d | 1 | 1.03mi |
| 288 Kryder Ave Akron, OH | 4.0 | 1.0 | 1400 | $1,450 | $1.04 | 43d | 1 | 1.05mi |
| 1297 Pondview Ave Akron, OH | 4.0 | 1.0 | 1373 | $1,450 | $1.06 | 23d | 1 | 1.07mi |
| 600 Sherman St Akron, OH | 4.0 | 1.0–2.0 | 824 | $1,600 | $1.94 | 14d | 14 | 1.11mi |
| 885 Brown St Akron, OH | 4.0 | 2.0 | 1280 | $1,400 | $1.09 | 23d | 1 | 1.11mi |
| 571 Chittenden St Akron, OH | 3.0 | 1.0 | 982 | $1,200 | $1.22 | 43d | 1 | 1.12mi |
| 907 Kling St Akron, OH | 3.0 | 1.0 | 1248 | $1,250 | $1.00 | 14d | 1 | 1.19mi |
| 1190 Hazel St Akron, OH | 3.0 | 1.0 | 1124 | $1,425 | $1.27 | 43d | 1 | 1.24mi |
| 979 Neptune Ave Akron, OH | 3.0 | 1.0 | 1248 | $1,250 | $1.00 | 23d | 1 | 1.25mi |
Listing history 2 events
-
2026-06-17remarks 693-char remark
-
2026-06-17$105,000 Active 1 DOM
ⓘ Source: listings_history table (triggers on properties + properties_extension) + one-shot
backfill from property_details.listing_events for pre-trigger history.
Tax reassessment forecast OH · Partial reset (capped growth)
- Current annual tax
- $1,061 · $88/mo
- Projected year-2 tax
- $1,350 · $112/mo
- Expected delta
- +$288/yr (+$24/mo · 27.2%)
ⓘ Screening estimate from a state-policy table — verify with the county assessor before closing.
Climate risk First Street
- Flood 1/10 Low FEMA zone X (unshaded) · 0% chance over 30 yrs
- Wildfire 1/10 Low
- Heat 3/10 Moderate 7 d/yr ≥97°F today · 17 d/yr by 30 yrs out
- Wind 1/10 Low
- Air quality 3/10 Moderate 2 unhealthy d/yr today · 4 by 30 yrs out
Nearby sold comps map
Loading sold comps map…
Walkable amenities ~0.75 mi
Loading nearby amenities…
Taxation est. · year 1
- Rental income
- $15,204
- − Mortgage interest
- −$5,882
- − Property taxes
- −$1,061
- − Insurance
- −$525
- − Repairs & maintenance
- −$1,216
- − Management
- −$1,216
- − Depreciation
- −$3,055
- Taxable income
- $2,249
- Est. tax owed @ 24.0%
- −$540
- After-tax cash flow
- $3,278/yr
For passive investors: Depreciation is non-cash, so a rental often shows a tax loss while cash-flowing — sheltering income. Rental losses are passive: they offset passive income freely, and up to $25,000/yr can offset ordinary (W-2) income if you actively participate and your MAGI is under $100k (phasing out to $0 by $150k); unused losses carry forward. On sale, claimed depreciation is recaptured at up to 25%, and gains may owe capital-gains tax (a 1031 exchange can defer both). Figures are a year-1 estimate at your 24.0% rate — not tax advice; consult a CPA.
Schools (NCES district)
- District
- Akron City
- NCES district ID
- 3904348
- Math proficiency
- 22% ▼ -17.00%
- Reading proficiency
- 30% ▼ -12.00%
- Median HH income
- $33,811
- Composite
- 21.31/100
- National rank
- #8383
- State rank
- #602 of 656 in OH
Livability — Akron
- Score
- 81/100
- State rank
- #104
- US rank
- #1591
Category grades
Schools grade is shown separately in the Schools card above.
Census & demographics
- Census place
- Akron, OH
- County
- Summit County · 440,783 people
- City population
- 174,375
- Metro
- Akron, OH
- Population (ZIP)
- 20,905
- Household income
- $41,688
- Rent vs Own
- Severe rent burden
- 1251.0
Population outlook (Summit County) Hauer SSP2
- Today (2025)
- 546,583 people
- By 2030
- 544,028 · -0.5%
- By 2040
- 531,363 · -2.8%
- By 2050
- 514,923 · -5.8%
- By 2075
- 481,765 · -11.9%
- By 2100
- 432,265 · -20.9%
Race, ethnicity, and origin ACS 2023
- Neighborhood character
- Diverse neighborhood (Simpson 0.62)
- Race & ethnicity
- White 48% Black 38% Two or more races 8% Hispanic / Latino 3% Asian 2%
- Common ancestry
- Lithuanian 2% Iranian 1% Scotch-Irish 1%
- Foreign-born
- 4% · Vietnam, Canada, Philippines
- Languages at home
- 94% English-only · Spanish 2% Other Asian/Pacific 1% Vietnamese 1%
Political lean MEDSL · Summit
- 2024 margin
- Lean D (+7.0) · D 53.0% · R 46.0%
- 2008→2024 swing
- -9.6pp toward R · 2008: 16.6pp · 2024: 7.0pp
- All cycles
- 2024: D+7.0 2020: D+9.6 2016: D+8.2 2012: D+14.8 2008: D+16.6
Not yet ingested
- Civics
- —
Market trends
- HPI YoY
- ▼ -101.46%
- Current HPI
- 132.768
- Rent YoY
- ▲ 7.63%
- Metro
- Akron, OH
- State GDP YoY
- ▲ 1.98%
- F500 in state
- 48
Industry mix (Fortune 500 HQ in OH)
| Industry | F500 HQs | Revenue |
|---|---|---|
| Insurance | 3 | $145B |
|
||
| Industrial Machinery | 3 | $49B |
|
||
| Financial Services | 3 | $24B |
|
||
| Consumer Goods | 2 | $93B |
|
||
| Aerospace / Defense | 2 | $47B |
|
||
| Utilities | 2 | $33B |
|
||
Price history
+130.8% since first listed61 events — show timeline
- 2026-06-17 Listed $105,000 MLSNOW
- 2025-05-08 Listing Removed — MLSNOW
- 2025-02-28 Price Changed $105,900 MLSNOW
- 2025-02-01 Listed $119,900 MLSNOW
- 2025-01-31 Listing Removed — MLSNOW
- 2025-01-16 Price Changed $125,000 MLSNOW
- 2025-01-08 Listed $132,900 MLSNOW
- 2024-05-03 Sold (Public Records) $100,001 Public Records
- 2024-05-01 Sold (MLS) $100,001 MLSNOW
- 2024-03-25 Pending — MLSNOW
- 2024-03-16 Listed $99,500 MLSNOW
- 2024-03-08 Listing Removed — MLSNOW
- 2024-02-15 Price Changed $99,000 MLSNOW
- 2024-02-07 Price Changed $105,000 MLSNOW
- 2024-01-12 Listed $119,900 MLSNOW
- 2023-12-30 Listing Removed — MLSNOW
- 2023-12-18 Relisted — MLSNOW
- 2023-12-18 Price Changed $119,900 MLSNOW
- 2023-11-09 Price Changed $109,900 MLSNOW
- 2023-10-30 Price Changed $114,900 MLSNOW
- 2023-10-15 Price Changed $119,900 MLSNOW
- 2023-10-04 Price Changed $124,900 MLSNOW
- 2023-09-28 Price Changed $129,000 MLSNOW
- 2023-09-21 Price Changed $134,000 MLSNOW
- 2023-09-15 Listed $145,000 MLSNOW
- 2023-08-16 Sold (Public Records) $48,500 Public Records
- 2023-08-16 Sold (MLS) $48,500 MLSNOW
- 2023-07-28 Pending — MLSNOW
- 2023-07-26 Listed $50,000 MLSNOW
- 2023-03-01 Sold (Public Records) $105,930 Public Records
- 2022-10-20 Listing Removed — MLSNOW
- 2022-10-10 Price Changed $55,000 MLSNOW
- 2022-09-30 Listed $65,000 MLSNOW
- 2020-12-23 Price Changed $60,000 MLSNOW
- 2020-12-17 Price Changed $65,000 MLSNOW
- 2020-11-05 Listed $75,000 MLSNOW
- 2020-02-05 Sold (Public Records) $37,900 Public Records
- 2018-03-16 Sold (MLS) $15,500 MLSNOW
- 2018-02-22 Pending — MLSNOW
- 2017-12-26 Listed $22,500 MLSNOW
- 2017-10-30 Pending — MLSNOW
- 2017-10-30 Listing Removed — MLSNOW
- 2017-08-01 Listed $24,995 MLSNOW
- 2008-09-17 Sold (Public Records) $50,000 Public Records
- 2008-09-15 Sold (MLS) $50,000 MLSNOW
- 2007-12-06 Listing Removed — MLSNOW
- 2007-10-24 Listed $54,900 MLSNOW
- 2007-08-06 Listed $59,900 MLSNOW
- 2007-08-06 Listing Removed — MLSNOW
- 2007-08-06 Listing Removed — MLSNOW
- 2007-07-18 Listed $59,900 MLSNOW
- 2007-06-06 Listed $62,500 MLSNOW
- 2007-06-01 Listing Removed — MLSNOW
- 2006-09-01 Listed $67,000 MLSNOW
- 2002-10-31 Listing Removed — MLSNOW
- 2002-05-31 Listed $65,500 MLSNOW
- 1998-11-30 Listing Removed — MLSNOW
- 1998-09-03 Listed $62,500 MLSNOW
- 1997-12-19 Sold (Public Records) $40,000 Public Records
- 1997-09-07 Listing Removed — MLSNOW
- 1997-05-13 Listed $45,500 MLSNOW
Property tax history
+0.7%/yrLatest (2025): $1,061 · +5.4% YoY. Source: county tax records.
Cash-flow waterfall
monthlySold comps — $/sqft
last 12 mo · ≤1 miLoading sold comps…