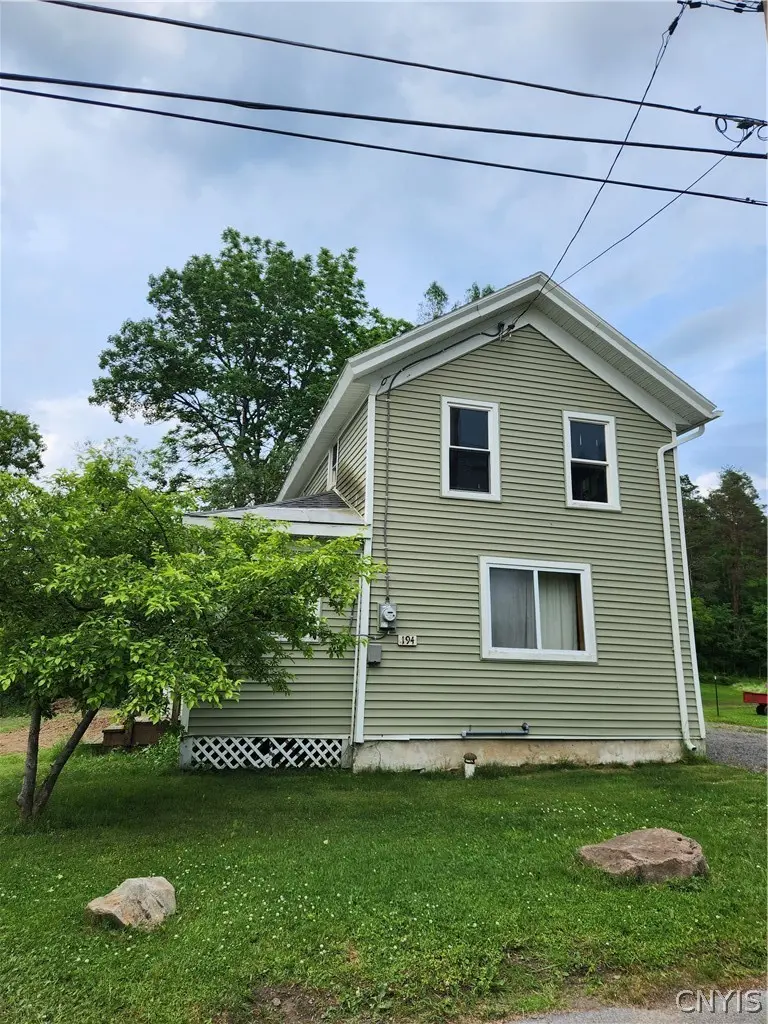
194 Ames St · Mexico, NY
Flood risk No data
- FEMA flood zone
- —
- Chance of flooding over 30 yrs
- —
- Est. flood insurance / yr
- —
Fire risk No data
- Est. fire insurance / yr
- —
Heat risk No data
- Hot days now (above threshold)
- —
- Hot days in 30 yrs
- —
Wind risk No data
- Chance of severe wind over 30 yrs
- —
Air-quality risk No data
- Unhealthy air days now
- —
- Unhealthy air days in 30 yrs
- —
Risk factors via First Street. Map © Google.
Why this score? — see what drove the C grade
The composite is a weighted blend of 9 inputs, each scored 0–100. Each bar is that input's sub-score; the figure is the points it added to the 100-point composite (weight × sub-score).
- Cash flow +19.2/30.0
- Appreciation +10.0/10.0
- ARV discount +7.5/15.0
- DSCR +6.1/10.0
- 1% rule +4.4/10.0
- Schools +3.3/10.0
- Livability +3.2/5.0
- Rent growth +2.5/5.0
- Condition / age +2.5/5.0
$115,000
🖨 Deal sheet 📄 Offer letter ✓ Due diligence
Listing remarks
Investor Special! This property has been mostly gutted and is ready for your vision. Most of the demolition work has already been completed, providing a blank canvas for a full renovation or custom rebuild. With the interior stripped down, buyers have the opportunity to redesign the layout, update systems, and create a home tailored to their needs. Newer vinyl siding, electrical service from road to box. Driveway has stone and is ready for asphalt. Situated on a nice lot in the village of Mexico, this property offers tremendous potential for investors, contractors, flippers, or ambitious homeowners looking for their next project.
Key facts
- Stone driveway
- Custom rebuild
- Newer vinyl siding
Tags
Property features AI
Finance
- Other: Property listed as resale/fixer
Exterior
- Parking: No garage
- Utilities: Electricity available and connected (circuit breakers); High-speed internet available; Public water connected; Sewer connected
- Home design: 2-story house; Existing construction; Rectangular lot (78 x 104)
- Construction: Vinyl siding; Blown-in insulation; Stone foundation; Asphalt roof
- Exterior features: Deck; Gravel driveway; See remarks
Interior
- Flooring: Hardwood; Varies
- Bathrooms: 1 full bathroom (1 on the main level)
- Heating & cooling: Gas heating
- Interior features: Separate/formal living room; Other interior features (see remarks); Partial basement
- Laundry & utility: Gas water heater
Neighborhood map
What this means for you Summary
Snapshot
- This is a 2-bed/1.0-bath single-family listed at $115k.
Deal economics
- At list price, monthly cash flow is $125 ($1k/yr) — positive.
- The deal already cash-flows at list — no discount required.
- To meet the 1% rule (rent ≥ 1% of price), the offer needs to be $108k (5.9% below list).
- Recommended offer: $108k (5.9% below list) — sets the bar for 1% rule.
- Cap rate 7.6% vs local median 3.1% in Mexico — top-decile yield for the area; either an underpriced asset or a hidden risk that comps aren't pricing in. Stress-test before assuming the spread holds.
Location & tenants
- Location reads 64/100 on livability (#756 in NY) — a middle-class / working-renter tenant base. Strengths: cost of living A+, housing A+, crime A; Watch: amenities F, commute F, health & safety D-.
- Mexico Central School District (rural): math 33% / reading 42% proficiency, ranked #540 of 590 in NY (top 92%) — families likely to look elsewhere, expect single-tenant / working-renter base with shorter leases.
- Market conditions: 26 active listings in the ZIP; 172 units permitted in Oswego County in 2024 (27 in 5+ unit buildings).
Forward outlook
- In year one you build about $12k of equity ($795 loan paydown + $12k appreciation (10.0% local appreciation)).
- Oswego County population projected at -23% by 2050 — secular population decline; favor cash flow + early exit over multi-decade hold.
- At projected returns (10.0% appreciation + 3.0% rent growth), your $32k cash investment doubles in ~3 years — after that, you're playing with house money.
- By year 3, paydown + projected appreciation supports a ~$31k cash-out refi (75% LTV) — recoverable capital for the next deal without selling this one.
Negotiation context
- Only 6 days on market — expect competitive offers; lowballing is unlikely to land.
Risks & watch-outs
- Watch-outs: built in 1890 — expect roof / HVAC / electrical / plumbing capex.
Questions for the listing agent
- Built in 1890 — when were the roof, HVAC, electrical panel, plumbing, and water heater last replaced?
- Is there a deadline driving the sale (1031 exchange, divorce, estate, relocation)? That informs how much negotiation room exists.
- Schools are B-rated — typically a magnet for longer-tenancy family renters. What's the average tenant stay here, and is there a school-zone premium baked into asking?
- What's the average days-on-market for RENTAL listings here right now (not sales)? A rising rental-DOM trend means longer vacancies and softer asking-rent achievability than the comps imply.
- What's the recent tenant-quality profile in this submarket — average credit score on applications, eviction rate, late-payment / NSF rate, and stable-employment percentage? A property-management company in the area should have these aggregated.
- How much new for-sale + rental construction is in the pipeline within 1–3 miles? Heavy new supply typically softens prices + rents 12–24 months out; constrained supply supports both.
Investment metrics
- 1% rule
- 0.94% ✗
- Cap rate
- 7.60%
- Cash-on-cash
- 4.65%
- DSCR
- 1.21
- GRM
- 8.9
CMA / ARV
- ARV (on-the-fly)
- $250,200
- Comps found
- 4
Show comp detail 4 sales within ~0.75 mi
| Address | Dist | Beds/Ba | Sqft | Sold | Price | $/sf | Match |
|---|---|---|---|---|---|---|---|
| 3414 Main St | 0.11mi | 2/1.5 | 1,232 (-2%) | 11mo | $159,574 | $130 | 81 |
| 26 County Route 64 | 0.23mi | 2/2.0 | 1,248 (-0%) | 21mo | $250,000 | $200 | 67 |
| 283 County Route 58 | 0.64mi | 3/1.5 (+1) | 1,200 (-4%) | 8mo | $315,000 | $263 | 50 |
| 6 Clinton St | 0.60mi | 3/1.0 (+1) | 1,378 (+10%) | 8mo | $170,000 | $123 | 44 |
Match score weights: distance 35% · size 25% · config 20% · recency 20%. Top-matched comps best support the ARV.
Projected returns pro-forma
10.0% appreciation · 3.0% rent growth · sell at horizon
- IRR
- 27.6%
- Equity multiple
- 3.19×
- Total profit
- $70,562
- Equity at exit
- $103,601
- IRR
- 24.1%
- Equity multiple
- 7.26×
- Total profit
- $201,493
- Equity at exit
- $223,420
Cash invested: $32,200 (down + closing). Projections, not guarantees.
Landlord ↔ Tenant lean methodology
- Overall (STATE)
- 15 Strongly Tenant-Friendly
- State New York
- 15 Strongly Tenant-Friendly · D+10
- County
- — inherits STATE
- City
- — inherits STATE
ZIP-level market 13114
- Home prices YoY
- 18.3%
- Active inventory
- 26
- Price-to-rent
- 8.9×
Monthly cashflow live
- Estimated rent
- $1,082 medium interval (Pro) →
- Mortgage (P&I)
- −$603
- Tax from tax record
- −$79 /mo · $951/yr
- Insurance
- −$48
- HOA
- −$0
- Vacancy / Maint / Mgmt
- −$227
- Net cashflow
- $125
Break-even live
UW: 25.0% down · 7.5% · 30yr · 1.5% tax · 5.0% vac · 8.0% maint · 8.0% mgmt
Financing live
Cash to close
- Down payment
- $28,750
- Closing costs
- $3,450
- Reserves months
- —
- Total cash needed
- —
Loan-product check · same deal, 3 products live
Conventional
25% down · 7.5% · 30yr
- Down + closing
- —
- Monthly P&I
- —
- Monthly cashflow
- —
- DSCR
- —
- Eligible?
- —
Personal DTI + credit; lowest rate.
DSCR
20% down · 8.5% · 30yr
- Down + closing
- —
- Monthly P&I
- —
- Monthly cashflow
- —
- DSCR
- —
- Eligible?
- —
No personal income docs; deal must DSCR.
Hard money
10% down · 12.0% · 12mo
- Down + closing
- —
- Monthly P&I
- —
- Monthly cashflow
- —
- DSCR
- —
- Eligible?
- —
Short-term bridge; refi at stabilization.
Listing history 6 events
-
2026-06-18days on market $115,000 Active 6 DOM
-
2026-06-17days on market $115,000 Active 5 DOM
-
2026-06-16days on market $115,000 Active 4 DOM
-
2026-06-15days on market $115,000 Active 3 DOM
-
2026-06-13remarks 637-char remark
-
2026-06-13$115,000 Active 1 DOM
ⓘ Source: listings_history table (triggers on properties + properties_extension) + one-shot
backfill from property_details.listing_events for pre-trigger history.
Tax reassessment forecast NY · Partial reset (capped growth)
- Current annual tax
- $951 · $79/mo
- Projected year-2 tax
- $1,447 · $121/mo
- Expected delta
- +$496/yr (+$41/mo · 52.2%)
ⓘ Screening estimate from a state-policy table — verify with the county assessor before closing.
Nearby sold comps map
Loading sold comps map…
Walkable amenities ~0.75 mi
Loading nearby amenities…
Taxation est. · year 1
- Rental income
- $12,989
- − Mortgage interest
- −$6,442
- − Property taxes
- −$951
- − Insurance
- −$575
- − Repairs & maintenance
- −$1,039
- − Management
- −$1,039
- − Depreciation
- −$3,345
- Taxable loss
- −$402
- Est. tax savings @ 24.0%
- +$97
- After-tax cash flow
- $1,595/yr
For passive investors: Depreciation is non-cash, so a rental often shows a tax loss while cash-flowing — sheltering income. Rental losses are passive: they offset passive income freely, and up to $25,000/yr can offset ordinary (W-2) income if you actively participate and your MAGI is under $100k (phasing out to $0 by $150k); unused losses carry forward. On sale, claimed depreciation is recaptured at up to 25%, and gains may owe capital-gains tax (a 1031 exchange can defer both). Figures are a year-1 estimate at your 24.0% rate — not tax advice; consult a CPA.
Schools (NCES district)
- District
- Mexico Central School District
- NCES district ID
- 3619170
- Math proficiency
- 33% ▼ -19.00%
- Reading proficiency
- 42% ▲ 1.00%
- Median HH income
- $51,635
- Composite
- 32.55/100
- National rank
- #5691
- State rank
- #540 of 590 in NY
Livability — Mexico
- Score
- 64/100
- State rank
- #756
- US rank
- #14489
Category grades
Schools grade is shown separately in the Schools card above.
Census & demographics
- Census place
- Mexico, NY
- City population
- 7,313
- Population (ZIP)
- 7,313
Population outlook (Oswego County) Hauer SSP2
- Today (2025)
- 114,465 people
- By 2030
- 109,968 · -3.9%
- By 2040
- 99,205 · -13.3%
- By 2050
- 87,979 · -23.1%
- By 2075
- 65,100 · -43.1%
- By 2100
- 47,117 · -58.8%
Race, ethnicity, and origin ACS 2023
- Neighborhood character
- Predominantly White (96%)
- Race & ethnicity
- White 96% Two or more races 2% Hispanic / Latino 1%
- Common ancestry
- Lithuanian 5% Romanian 4% Portuguese 3%
- Foreign-born
- 2% · Canada
- Languages at home
- 97% English-only · Other Asian/Pacific 1%
Political lean MEDSL · Oswego
- 2024 margin
- Strong R (+24.2) · D 37.9% · R 62.1%
- 2008→2024 swing
- -26.6pp toward R · 2008: 2.5pp · 2024: -24.2pp
- All cycles
- 2024: R+24.2 2020: R+20.2 2016: R+23.2 2012: D+7.9 2008: D+2.5
Not yet ingested
- Civics
- —
Market trends
- HPI YoY
- ▲ 50.65%
- Current HPI
- 327.6719
- Rent YoY
- —
- Metro
- —
- State GDP YoY
- ▲ 2.60%
- F500 in state
- 92
Industry mix (Fortune 500 HQ in NY)
| Industry | F500 HQs | Revenue |
|---|---|---|
| Financial Services | 10 | $950B |
|
||
| Consumer Goods | 9 | $162B |
|
||
| Insurance | 4 | $225B |
|
||
| Telecommunications | 2 | $144B |
|
||
| Pharmaceuticals | 2 | $112B |
|
||
| Media / Entertainment | 2 | $69B |
|
||
Price history
1 event — show timeline
- 2026-06-12 Listed $115,000 CNYIS
Property tax history
-6.3%/yrLatest (2024): $951 · -46.4% YoY. Source: county tax records.
Cash-flow waterfall
monthlySold comps — $/sqft
last 12 mo · ≤1 miLoading sold comps…