4305 Frazier Ave · Fort Worth, TX
Flood risk 1/10 · Minimal
- FEMA flood zone
- X (unshaded)
- Chance of flooding over 30 yrs
- 0.0%
- Est. flood insurance / yr
- $507 – $1,088
Fire risk 1/10 · Minimal
- Est. fire insurance / yr
- $1,222 – $2,270
Heat risk 7/10 · Major
- Hot days now (above 109°F)
- 7 days/yr
- Hot days in 30 yrs
- 23 days/yr
Wind risk 4/10 · Minor
- Chance of severe wind over 30 yrs
- 21.0%
Air-quality risk 3/10 · Minor
- Unhealthy air days now
- 2 days/yr
- Unhealthy air days in 30 yrs
- 3 days/yr
Risk factors via First Street. Map © Google.
Why this score? — see what drove the D grade
The composite is a weighted blend of 9 inputs, each scored 0–100. Each bar is that input's sub-score; the figure is the points it added to the 100-point composite (weight × sub-score).
- Cash flow +14.0/30.0
- ARV discount +8.3/15.0
- 1% rule +4.7/10.0
- DSCR +4.3/10.0
- Livability +4.0/5.0
- Rent growth +2.5/5.0
- Condition / age +2.5/5.0
- Schools +2.0/10.0
- Appreciation +0.0/10.0
$165,000
🖨 Deal sheet (PDF) 📄 Offer letter ✓ Due diligence
Listing remarks MLS
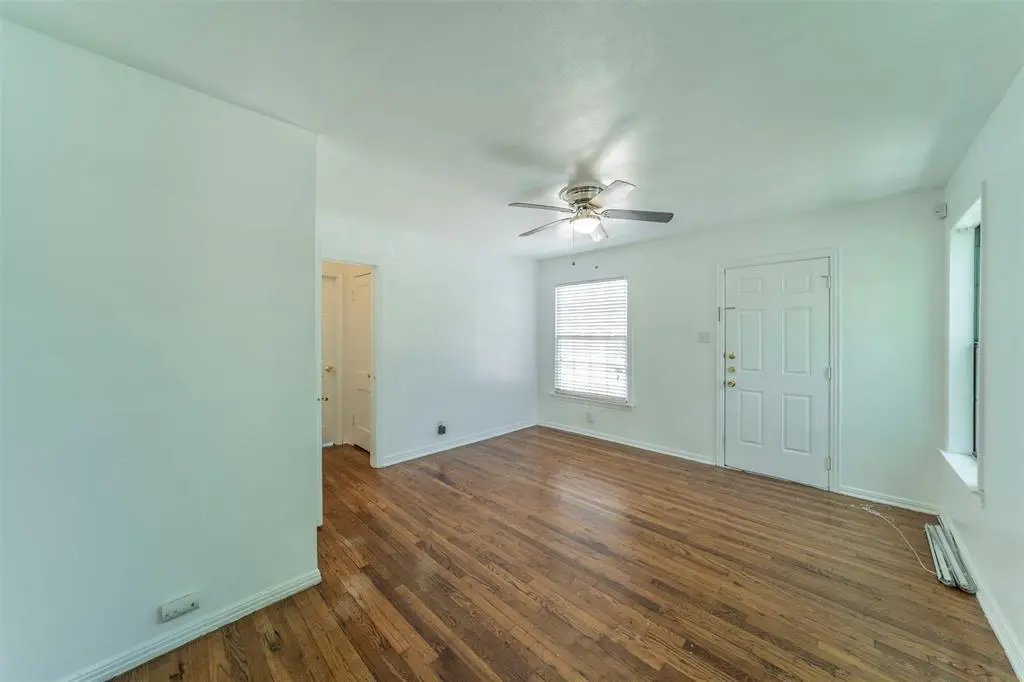
Turnkey investment opportunity with a tenant already in place at $1,250 per month through 2-1-2027, providing immediate and reliable rental income from day one. This charming 2-bedroom, 1-bath home offers a warm and inviting atmosphere from the moment you step inside. The bright and airy living room is filled with natural light and flows seamlessly into the dining area, creating a comfortable space for everyday living and entertaining. The cozy, functional kitchen features a gas stove and ample cabinet space for all your storage needs. Both bedrooms are well-sized with generous closet space, while the bathroom includes tasteful updates that add a touch of modern charm. Enjoy time outdoors in the lovely backyard—perfect for morning coffee, relaxing evenings, or gathering with friends and family. Additional highlights include a laundry area and convenient off-street parking. Ideally located near schools, parks, shopping, and dining, with easy access to major highways, this property offers the perfect blend of comfort, charm, and convenience, making it a smart, low-risk addition to any investment portfolio.
Key facts
- Laundry area
- Lovely backyard
- Gas stove
Tags
Neighborhood map
What this means for you Summary
Snapshot
- This is a 3-bed/1.0-bath single-family listed at $165k.
Deal economics
- At list price, monthly cash flow is $22 ($270/yr) — positive.
- The deal already cash-flows at list — no discount required.
- To meet the 1% rule (rent ≥ 1% of price), the offer needs to be $160k (3.2% below list).
- Recommended offer: $145k (12.0% below list) — sets the bar for market timing.
- Cap rate 6.5% vs local median 3.9% in Fort Worth — top-decile yield for the area; either an underpriced asset or a hidden risk that comps aren't pricing in. Stress-test before assuming the spread holds.
Location & tenants
- Location reads 80/100 on livability (#49 in TX, #1,954 nationally) — a professional / high-income tenant draw. Strengths: amenities A+, cost of living A+, housing A+; Watch: schools D+, crime F.
- Fort Worth ISD (urban): math 18% / reading 28% proficiency, ranked #742 of 826 in TX (top 90%) — low school quality limits family demand, transient renter base, plan for 1-2y turnover; 73% free/reduced lunch — lower-income household profile, screen leases tightly.
- Market conditions: 32 active listings in the ZIP; 23 comparable units currently listed for rent nearby; rentals at typical pace (median 21d on market — plan ~3-4 weeks tenant-placement turnaround); 18,938 units permitted in Tarrant County in 2024 (8,336 in 5+ unit buildings).
- This rent runs 37% of the median local income ($52k/yr) — at the standard rent-burdened threshold; future hikes will face affordability resistance.
Forward outlook
- Local home prices are declining (-3.0%/yr); year-one equity from $1k of loan paydown is wiped out by about $5k of value loss. Plan a longer hold.
- Tarrant County population projected at +41% by 2050 — long-run rental-demand tailwind backs the buy-and-hold thesis.
Negotiation context
- It's been on market 141 days — a 12% lower offer ($145k) is reasonable based on typical stale-listing flexibility.
- 11 sale attempts since 4y ago with the ask held roughly flat each time — persistent listings suggest the price (not the market) is what's stuck; bring a comps-based counter.
Risks & watch-outs
- Watch-outs: built in 1951 — expect roof / HVAC / electrical / plumbing capex.
- Climate carrying-cost: extreme-heat days projected 7→23/yr by 2055 (HVAC capex compounding) — expect insurance premiums to compound above CPI over the hold.
Questions for the listing agent
- It's been on market 141 days. Have you received any prior offers? Is the seller open to a 12% concession, seller financing, or rate buy-down credit?
- Built in 1951 — when were the roof, HVAC, electrical panel, plumbing, and water heater last replaced?
- Why hasn't it sold? Are there any deal-killer items the seller is aware of (foundation, flood, title, zoning, code violations)?
- Is there a deadline driving the sale (1031 exchange, divorce, estate, relocation)? That informs how much negotiation room exists.
- Schools are D-rated, which usually means shorter tenancies and higher turnover. Who's the typical renter profile here, and what's been the actual vacancy rate?
- Crime grade is F in this area — have there been break-ins, vandalism, or insurance claims at this property in the last 3 years? What carrier currently insures it and at what premium?
- The area grade is low — what's the realistic commute time and amenity access for the typical tenant pool here? Any planned neighborhood developments (good or bad) we should know about?
- What's the average days-on-market for RENTAL listings here right now (not sales)? A rising rental-DOM trend means longer vacancies and softer asking-rent achievability than the comps imply.
- What's the recent tenant-quality profile in this submarket — average credit score on applications, eviction rate, late-payment / NSF rate, and stable-employment percentage? A property-management company in the area should have these aggregated.
- How much new for-sale + rental construction is in the pipeline within 1–3 miles? Heavy new supply typically softens prices + rents 12–24 months out; constrained supply supports both.
Investment metrics
- 1% rule
- 0.97% ✗
- Cap rate
- 6.46%
- Cash-on-cash
- 0.58%
- DSCR
- 1.03
- GRM
- 8.6
CMA / ARV
- ARV (median comp)
- $167,956
- List price
- $165,000
- Delta
- -1.76%
- Verdict
- FAIR
- Comps
- 20 within 1.0 mi
Show comp detail 7 sales within ~0.75 mi
| Address | Dist | Beds/Ba | Sqft | Sold | Price | $/sf | Match |
|---|---|---|---|---|---|---|---|
| 3821 Townsend Dr | 0.47mi | 2/1.0 (-1) | 784 (+0%) | 4mo | $159,900 | $204 | 69 |
| 4109 Wayside Ave | 0.21mi | 2/1.0 (-1) | 807 (+3%) | 20mo | $169,900 | $211 | 63 |
| 1501 W Boyce Ave | 0.57mi | 2/2.0 (-1) | 768 (-2%) | 3mo | $179,900 | $234 | 58 |
| 4312 Greene Ave | 0.50mi | 2/1.0 (-1) | 774 (-1%) | 22mo | $135,450 | $175 | 52 |
| 4233 5th Ave | 0.67mi | 2/1.0 (-1) | 801 (+2%) | 22mo | $169,900 | $212 | 41 |
| 1321 W Hammond St | 0.71mi | 2/1.0 (-1) | 868 (+11%) | 9mo | $179,500 | $207 | 37 |
| 3841 Willing Ave | 0.71mi | 3/1.5 | 884 (+13%) | 13mo | $145,000 | $164 | 33 |
Match score weights: distance 35% · size 25% · config 20% · recency 20%. Top-matched comps best support the ARV.
Projected returns pro-forma
-3.0% appreciation · 3.0% rent growth · sell at horizon
- IRR
- -15.3%
- Equity multiple
- 0.45×
- Total profit
- $-25,220
- Equity at exit
- $24,602
- IRR
- -6.7%
- Equity multiple
- 0.57×
- Total profit
- $-19,771
- Equity at exit
- $14,266
Cash invested: $46,200 (down + closing). Projections, not guarantees.
Landlord ↔ Tenant lean methodology
- Overall (STATE)
- 87 Strongly Landlord-Friendly
- State Texas
- 87 Strongly Landlord-Friendly · R+5
- County
- — inherits STATE
- City
- — inherits STATE
ZIP-level market 76115
- Home prices YoY
- -6.0%
- Active inventory
- 32
- Price-to-rent
- 8.6×
Monthly cashflow live
- Estimated rent
- $1,597 high interval (Pro) →
- Mortgage (P&I)
- −$865
- Tax from tax record
- −$305 /mo · $3,661/yr
- Insurance
- −$69
- HOA
- −$0
- Vacancy / Maint / Mgmt
- −$335
- Net cashflow
- $22
Break-even live
Sensitivity live
| Price | -10% $116 | -5% $69 | +0% $22 | +5% $-24 | +10% $-71 |
|---|---|---|---|---|---|
| Rent | -10% $-104 | -5% $-41 | +0% $22 | +5% $86 | +10% $149 |
| Rate | -1.0pp $106 | -0.5pp $64 | base $22 | +0.5pp $-20 | +1.0pp $-64 |
UW: 25.0% down · 7.5% · 30yr · 1.5% tax · 5.0% vac · 8.0% maint · 8.0% mgmt
Financing live
Cash to close
- Down payment
- $41,250
- Closing costs
- $4,950
- Reserves months
- —
- Total cash needed
- —
Loan-product check · same deal, 3 products live
Conventional
25% down · 7.5% · 30yr
- Down + closing
- —
- Monthly P&I
- —
- Monthly cashflow
- —
- DSCR
- —
- Eligible?
- —
Personal DTI + credit; lowest rate.
DSCR
20% down · 8.5% · 30yr
- Down + closing
- —
- Monthly P&I
- —
- Monthly cashflow
- —
- DSCR
- —
- Eligible?
- —
No personal income docs; deal must DSCR.
Hard money
10% down · 12.0% · 12mo
- Down + closing
- —
- Monthly P&I
- —
- Monthly cashflow
- —
- DSCR
- —
- Eligible?
- —
Short-term bridge; refi at stabilization.
Rent comps 23 comps
| Address | Beds | Baths | Sqft | Rent | $/sqft | DOM | Units | Dist |
|---|---|---|---|---|---|---|---|---|
| 4201 William Fleming Ct W Fort Worth, TX | 2.0 | 1.5–2.0 | 865 | $1,450 | $1.68 | 0d | 103 | 0.13mi |
| 4113 McCart Ave Fort Worth, TX | 2.0 | 1.0 | 807 | $1,375 | $1.70 | 45d | 1 | 0.26mi |
| 4318 Baldwin Ave Fort Worth, TX | 2.0 | 1.0 | 730 | $1,399 | $1.92 | 45d | 1 | 0.68mi |
| 4316 Baldwin Ave Fort Worth, TX | 2.0 | 1.0 | 730 | $1,399 | $1.92 | 45d | 3 | 0.68mi |
| 4317 Baldwin Ave Fort Worth, TX | 1.0–2.0 | 1.0 | 642 | $1,399 | $2.18 | 45d | 2 | 0.70mi |
| 4321 Baldwin Ave Fort Worth, TX | 2.0 | 1.0 | 730 | $1,399 | $1.92 | 45d | 1 | 0.70mi |
| 1000 W Hammond St Fort Worth, TX | 2.0 | 1.0 | 900 | $1,600 | $1.78 | 26d | 1 | 0.92mi |
| 3437 Stanley Ave Fort Worth, TX | 2.0 | 1.0 | 1000 | $1,500 | $1.50 | 45d | 1 | 1.01mi |
| 3419 S University Dr Unit C Fort Worth, TX | 2.0 | 1.0 | 1059 | $1,095 | $1.03 | 0d | 1 | 1.20mi |
| 3419 S University Dr Unit D Fort Worth, TX | 2.0 | 1.0 | 900 | $1,095 | $1.22 | 18d | 1 | 1.20mi |
| 3417 S University Dr Unit D Fort Worth, TX | 2.0 | 1.0 | 900 | $1,235 | $1.37 | 45d | 1 | 1.21mi |
| 3417 S University Dr Unit A Fort Worth, TX | 2.0 | 1.0 | 1059 | $1,095 | $1.03 | 7d | 1 | 1.21mi |
| 3241 Sandage Ave Fort Worth, TX | 3.0 | 2.0 | 1115 | $3,000 | $2.69 | 20d | 1 | 1.24mi |
| 3500 College Ave Fort Worth, TX | 3.0 | 1.0 | 1012 | $1,650 | $1.63 | 45d | 1 | 1.26mi |
| 4152 Anita Ave Fort Worth, TX | 2.0 | 1.0 | 1112 | $1,995 | $1.79 | 20d | 1 | 1.27mi |
| 3301 S University Dr Unit C Fort Worth, TX | 2.0 | 1.0 | 800 | $1,500 | $1.88 | 26d | 1 | 1.29mi |
| 2720 W Devitt St Fort Worth, TX | 2.0 | 2.0 | 740 | $2,750 | $3.72 | 20d | 1 | 1.38mi |
| 1215 Lowe St Fort Worth, TX | 2.0 | 1.0 | 680 | $1,250 | $1.84 | 17d | 1 | 1.43mi |
| 3208 S University Dr Unit The Carter 106B Fort Worth, TX | 3.0 | 2.0 | 1121 | $3,600 | $3.21 | 8d | 1 | 1.44mi |
| 3208 S University Dr Unit The Carter 204B Fort Worth, TX | 3.0 | 2.0 | 1099 | $3,600 | $3.28 | 20d | 1 | 1.44mi |
| 5612 James Ave Fort Worth, TX | 1.0–3.0 | 1.0–2.0 | 824 | $1,700 | $2.06 | 5d | 8 | 1.44mi |
| 3211 Rogers Ave Fort Worth, TX | 2.0 | 1.0 | 1015 | $1,695 | $1.67 | 17d | 1 | 1.45mi |
| 3205 Wabash Ave Fort Worth, TX | 2.0 | 1.5 | 1050 | $1,950 | $1.86 | 45d | 1 | 1.48mi |
Listing history 25 events
-
2026-01-30historical $1,250
-
2026-01-08$165,000 Active 1127-char remark
Show marketing remark (1127 chars)
Turnkey investment opportunity with a tenant already in place at $1,250 per month through 2-1-2027, providing immediate and reliable rental income from day one. This charming 2-bedroom, 1-bath home offers a warm and inviting atmosphere from the moment you step inside. The bright and airy living room is filled with natural light and flows seamlessly into the dining area, creating a comfortable space for everyday living and entertaining. The cozy, functional kitchen features a gas stove and ample cabinet space for all your storage needs. Both bedrooms are well-sized with generous closet space, while the bathroom includes tasteful updates that add a touch of modern charm. Enjoy time outdoors in the lovely backyard—perfect for morning coffee, relaxing evenings, or gathering with friends and family. Additional highlights include a laundry area and convenient off-street parking. Ideally located near schools, parks, shopping, and dining, with easy access to major highways, this property offers the perfect blend of comfort, charm, and convenience, making it a smart, low-risk addition to any investment portfolio.
-
2025-12-04$1,250
-
2025-12-03historical $1,300
-
2025-11-13$1,300
-
2025-11-01historical $1,450
-
2025-09-19price $1,450
-
2025-07-24$1,500
-
2025-07-23historical $1,150
-
2025-07-02$1,150
-
2024-09-27status Active
-
2024-08-17historical $1,450
-
2024-07-23$170,000 Active
-
2024-07-22$1,450
-
2024-06-25price $170,000
-
2024-05-29$187,000 Active
-
2023-10-13historical $1,400
-
2023-09-22$1,400
-
2022-07-20soldstatus
-
2022-07-18soldstatus Closed
-
2022-07-09status Pending
-
2022-07-07$125,000 Active
-
2021-02-12soldstatus
-
1996-01-19soldstatus
-
1985-01-01soldstatus
ⓘ Source: listings_history table (triggers on properties + properties_extension) + one-shot
backfill from property_details.listing_events for pre-trigger history.
Tax reassessment forecast TX · Resets to sale price
- Current annual tax
- $3,661 · $305/mo
- Projected year-2 tax
- $3,661 · $305/mo
- Expected delta
- $0/yr ($0/mo · 0.0%)
ⓘ Screening estimate from a state-policy table — verify with the county assessor before closing.
Climate risk First Street
- Flood 1/10 Low FEMA zone X (unshaded) · 0% chance over 30 yrs
- Wildfire 1/10 Low
- Heat 7/10 Severe 7 d/yr ≥109°F today · 23 d/yr by 30 yrs out
- Wind 4/10 Moderate 21% chance of damaging wind over 30 yrs
- Air quality 3/10 Moderate 2 unhealthy d/yr today · 3 by 30 yrs out
Nearby sold comps map
Loading sold comps map…
Walkable amenities ~0.75 mi
Loading nearby amenities…
Taxation est. · year 1
- Rental income
- $19,164
- − Mortgage interest
- −$9,243
- − Property taxes
- −$3,661
- − Insurance
- −$825
- − Repairs & maintenance
- −$1,533
- − Management
- −$1,533
- − Depreciation
- −$4,800
- Taxable loss
- −$2,431
- Est. tax savings @ 24.0%
- +$583
- After-tax cash flow
- $853/yr
For passive investors: Depreciation is non-cash, so a rental often shows a tax loss while cash-flowing — sheltering income. Rental losses are passive: they offset passive income freely, and up to $25,000/yr can offset ordinary (W-2) income if you actively participate and your MAGI is under $100k (phasing out to $0 by $150k); unused losses carry forward. On sale, claimed depreciation is recaptured at up to 25%, and gains may owe capital-gains tax (a 1031 exchange can defer both). Figures are a year-1 estimate at your 24.0% rate — not tax advice; consult a CPA.
Schools (NCES district)
- District
- Fort Worth ISD
- NCES district ID
- 4819700
- Math proficiency
- 18% ▼ -16.00%
- Reading proficiency
- 28% ▼ -6.00%
- Median HH income
- $42,109
- Composite
- 19.61/100
- National rank
- #8753
- State rank
- #742 of 826 in TX
Livability — Fort Worth
- Score
- 80/100
- State rank
- #49
- US rank
- #1954
Category grades
Schools grade is shown separately in the Schools card above.
Census & demographics
- Census place
- Fort Worth, TX
- County
- Tarrant County · 2,033,669 people
- City population
- 911,619
- Metro
- Dallas-Fort Worth-Arlington, TX
- Population (ZIP)
- 19,655
- Household income
- $52,411
- Rent vs Own
- Severe rent burden
- 859.0
Population outlook (Tarrant County) Hauer SSP2
- Today (2025)
- 2,380,417 people
- By 2030
- 2,578,900 · +8.3%
- By 2040
- 2,974,995 · +25.0%
- By 2050
- 3,350,489 · +40.8%
- By 2075
- 4,216,909 · +77.2%
- By 2100
- 4,741,527 · +99.2%
Race, ethnicity, and origin ACS 2023
- Neighborhood character
- Predominantly Hispanic (72%)
- Race & ethnicity
- Hispanic / Latino 72% Two or more races 35% White 11% Black 11% Asian 5%
- Hispanic origin (detail)
- Mexican 66%
- Common ancestry
- Italian 1% Arab 1%
- Foreign-born
- 36% · Canada, South Korea, China
- Languages at home
- 32% English-only · Spanish 62% Korean 3% Arabic 1%
Political lean MEDSL · Tarrant
- 2024 margin
- Lean R (+5.1) · D 46.7% · R 51.9% · Other 1.4%
- 2008→2024 swing
- +6.6pp toward D · 2008: -11.7pp · 2024: -5.1pp
- All cycles
- 2024: R+5.1 2020: D+0.2 2016: R+8.7 2012: R+15.7 2008: R+11.7
Not yet ingested
- Civics
- —
Market trends
- HPI YoY
- ▼ -23.05%
- Current HPI
- 363.5732
- Rent YoY
- —
- Metro
- Dallas-Fort Worth-Arlington, TX
- State GDP YoY
- ▲ 3.95%
- F500 in state
- 110
Industry mix (Fortune 500 HQ in TX)
| Industry | F500 HQs | Revenue |
|---|---|---|
| Energy | 16 | $1,198B |
|
||
| Technology | 5 | $198B |
|
||
| Engineering / Construction | 4 | $72B |
|
||
| Energy Services | 3 | $60B |
|
||
| Utilities | 3 | $41B |
|
||
| Healthcare | 2 | $330B |
|
||
Price history
-99.0% since first listed25 events — show timeline
- 2026-01-30 Rental Removed $1,250 NTREIS
- 2026-01-08 Listed $165,000 NTREIS
- 2025-12-04 Listed for Rent $1,250 NTREIS
- 2025-12-03 Rental Removed $1,300 APPFOLIO
- 2025-11-13 Listed for Rent $1,300 APPFOLIO
- 2025-11-01 Rental Removed $1,450 NTREIS
- 2025-09-19 Price Changed $1,450 NTREIS
- 2025-07-24 Listed for Rent $1,500 NTREIS
- 2025-07-23 Rental Removed $1,150 SHOWMOJO
- 2025-07-02 Listed for Rent $1,150 SHOWMOJO
- 2024-09-27 Relisted — NTREIS
- 2024-08-17 Rental Removed $1,450 NTREIS
- 2024-07-23 Listed $170,000 NTREIS
- 2024-07-22 Listed for Rent $1,450 NTREIS
- 2024-06-25 Price Changed $170,000 NTREIS
- 2024-05-29 Listed $187,000 NTREIS
- 2023-10-13 Rental Removed $1,400 NTREIS
- 2023-09-22 Listed for Rent $1,400 NTREIS
- 2022-07-20 Sold (Public Records) — Public Records
- 2022-07-18 Sold (MLS) — NTREIS
- 2022-07-09 Pending — NTREIS
- 2022-07-07 Listed $125,000 NTREIS
- 2021-02-12 Sold (Public Records) — Public Records
- 1996-01-19 Sold (Public Records) — Public Records
- 1985-01-01 Sold (Public Records) — Public Records
Property tax history
+7.4%/yrLatest (2025): $3,661 · -1.3% YoY. Source: county tax records.
Cash-flow waterfall
monthlySold comps — $/sqft
last 12 mo · ≤1 miLoading sold comps…