4805 Cushman Rd NE #56 · Olympia, WA
Flood risk 1/10 · Minimal
- FEMA flood zone
- X (unshaded)
- Chance of flooding over 30 yrs
- 0.0%
- Est. flood insurance / yr
- $507 – $1,088
Fire risk 2/10 · Minimal
- Est. fire insurance / yr
- $604 – $1,122
Heat risk 3/10 · Minor
- Hot days now (above 89°F)
- 7 days/yr
- Hot days in 30 yrs
- 14 days/yr
Wind risk 1/10 · Minimal
- Chance of severe wind over 30 yrs
- —
Air-quality risk 6/10 · Moderate
- Unhealthy air days now
- 6 days/yr
- Unhealthy air days in 30 yrs
- 7 days/yr
Risk factors via First Street. Map © Google.
Why this score? — see what drove the C- grade
The composite is a weighted blend of 9 inputs, each scored 0–100. Each bar is that input's sub-score; the figure is the points it added to the 100-point composite (weight × sub-score).
- Cash flow +19.4/30.0
- ARV discount +7.5/15.0
- Schools +6.2/10.0
- DSCR +6.1/10.0
- 1% rule +4.3/10.0
- Livability +4.2/5.0
- Rent growth +3.4/5.0
- Condition / age +2.5/5.0
- Appreciation +0.0/10.0
$240,000
🖨 Deal sheet 📄 Offer letter ✓ Due diligence
Listing remarks
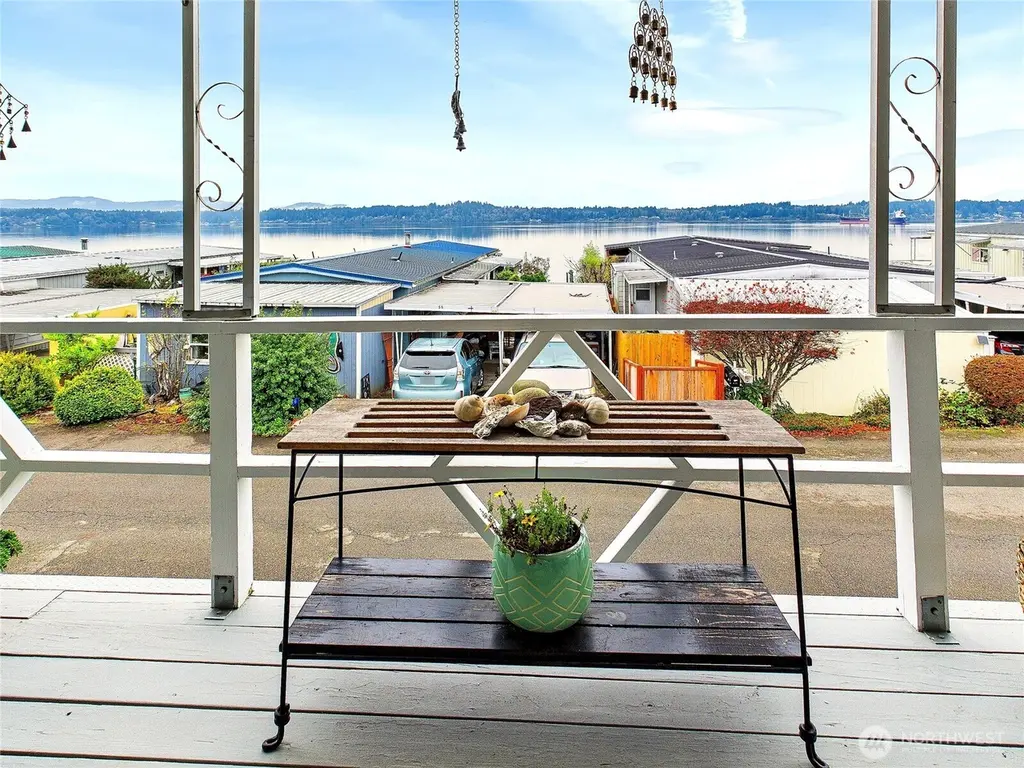
Enjoy stunning views of the Puget Sound, Olympics, and Black Hills from this beautifully maintained 3-bed, 1.75-bath home in the desirable 55+ Seashore Villa community. A wraparound covered deck expands your living space and showcases year-round scenery. Inside, the home features a bright layout, a remodeled primary bath with walk-in shower, fresh interior paint, newer flooring, and thoughtful updates throughout. Seashore Villa offers private beach access, pool, clubhouse, RV parking, and more—an ideal low-maintenance lifestyle in a peaceful waterfront setting.
Key facts
- Private beach access
- 2 parking spots
- Community pool
Tags
Neighborhood map
What this means for you Summary
Snapshot
- This is a 3-bed/2.0-bath manufactured listed at $240k.
Deal economics
- At list price, monthly cash flow is $270 ($3k/yr) — positive.
- The deal already cash-flows at list — no discount required.
- To meet the 1% rule (rent ≥ 1% of price), the offer needs to be $223k (7.2% below list).
- Recommended offer: $211k (12.0% below list) — sets the bar for market timing.
- Cap rate 7.6% vs local median 2.4% in Olympia — top-decile yield for the area; either an underpriced asset or a hidden risk that comps aren't pricing in. Stress-test before assuming the spread holds.
Location & tenants
- Location reads 83/100 on livability (#58 in WA, #1,036 nationally) — a professional / high-income tenant draw. Strengths: amenities A+, commute A+, health & safety A+; Watch: crime F, cost of living D-.
- Olympia School District (urban): math 66% / reading 75% proficiency, ranked #17 of 291 in WA (top 6%) — strong family-tenant draw, lease renewals of 3-5y typical.
- Market conditions: Rents rising (+3.7%/yr); 150 active listings in the ZIP; solid renter incomes; 1,222 units permitted in Thurston County in 2024 (508 in 5+ unit buildings).
Forward outlook
- Local home prices are declining (-3.0%/yr); year-one equity from $2k of loan paydown is wiped out by about $7k of value loss. Plan a longer hold.
- Thurston County population projected at +27% by 2050 — long-run rental-demand tailwind backs the buy-and-hold thesis.
Negotiation context
- It's been on market 189 days — a 12% lower offer ($211k) is reasonable based on typical stale-listing flexibility.
- 5 sale attempts since 9y ago with the ask held roughly flat each time — persistent listings suggest the price (not the market) is what's stuck; bring a comps-based counter.
Questions for the listing agent
- It's been on market 189 days. Have you received any prior offers? Is the seller open to a 12% concession, seller financing, or rate buy-down credit?
- Built in 1973 — when were the roof, HVAC, electrical panel, plumbing, and water heater last replaced?
- Why hasn't it sold? Are there any deal-killer items the seller is aware of (foundation, flood, title, zoning, code violations)?
- Is there a deadline driving the sale (1031 exchange, divorce, estate, relocation)? That informs how much negotiation room exists.
- Schools are A-rated — typically a magnet for longer-tenancy family renters. What's the average tenant stay here, and is there a school-zone premium baked into asking?
- Crime grade is F in this area — have there been break-ins, vandalism, or insurance claims at this property in the last 3 years? What carrier currently insures it and at what premium?
- What's the average days-on-market for RENTAL listings here right now (not sales)? A rising rental-DOM trend means longer vacancies and softer asking-rent achievability than the comps imply.
- What's the recent tenant-quality profile in this submarket — average credit score on applications, eviction rate, late-payment / NSF rate, and stable-employment percentage? A property-management company in the area should have these aggregated.
- How much new for-sale + rental construction is in the pipeline within 1–3 miles? Heavy new supply typically softens prices + rents 12–24 months out; constrained supply supports both.
Investment metrics
- 1% rule
- 0.93% ✗
- Cap rate
- 7.64%
- Cash-on-cash
- 4.81%
- DSCR
- 1.21
- GRM
- 9.0
CMA / ARV
- ARV (median comp)
- $99,000
- List price
- $240,000
- Delta
- 142.42%
- Verdict
- OVERPRICED
- Comps
- 5 within 1.0 mi
Show comp detail 8 sales within ~0.75 mi
| Address | Dist | Beds/Ba | Sqft | Sold | Price | $/sf | Match |
|---|---|---|---|---|---|---|---|
| 4806 Cushman Rd NE #120 | 0.22mi | 3/2.0 | 1,269 (+2%) | 8mo | $76,000 | $60 | 81 |
| 4805 Cushman Rd NE #63 | 0.05mi | 2/2.0 (-1) | 1,232 (-1%) | 12mo | $350,000 | $284 | 80 |
| 4805 Cushman Rd NE #21 | 0.04mi | 2/2.0 (-1) | 1,254 (+0%) | 16mo | $159,000 | $127 | 79 |
| 4805 Cushman Rd NE #61 | 0.04mi | 2/2.0 (-1) | 1,104 (-12%) | 0mo | $335,000 | $303 | 74 |
| 4806 Cushman Rd NE #139 | 0.22mi | 3/2.0 | 1,188 (-5%) | 11mo | $70,000 | $59 | 73 |
| 4806 Cushman Rd NE #125 | 0.22mi | 2/2.0 (-1) | 1,248 (0%) | 18mo | $36,500 | $29 | 70 |
| 4805 Cushman Rd NE #115 | 0.06mi | 3/2.0 | 1,404 (+12%) | 10mo | $220,000 | $157 | 68 |
| 4805 Cushman Rd NE #19 | 0.07mi | 3/2.0 | 1,080 (-14%) | 14mo | $148,000 | $137 | 62 |
Match score weights: distance 35% · size 25% · config 20% · recency 20%. Top-matched comps best support the ARV.
Projected returns pro-forma
-3.0% appreciation · 3.66% rent growth · sell at horizon
- IRR
- -8.2%
- Equity multiple
- 0.70×
- Total profit
- $-20,303
- Equity at exit
- $35,785
- IRR
- 2.1%
- Equity multiple
- 1.15×
- Total profit
- $10,339
- Equity at exit
- $20,751
Cash invested: $67,200 (down + closing). Projections, not guarantees.
Landlord ↔ Tenant lean methodology
- Overall (STATE)
- 28 Tenant-Leaning
- State Washington
- 28 Tenant-Leaning · D+8
- County
- — inherits STATE
- City
- — inherits STATE
ZIP-level market 98506
- Rents YoY
- 3.7%
- Active inventory
- 150
- Price-to-rent
- 9.0×
Monthly cashflow live
- Estimated rent
- $2,228 medium interval (Pro) →
- Mortgage (P&I)
- −$1,259
- Tax from tax record
- −$132 /mo · $1,587/yr
- Insurance
- −$100
- HOA
- −$0
- Vacancy / Maint / Mgmt
- −$468
- Net cashflow
- $270
Break-even live
UW: 25.0% down · 7.5% · 30yr · 1.5% tax · 5.0% vac · 8.0% maint · 8.0% mgmt
Financing live
Cash to close
- Down payment
- $60,000
- Closing costs
- $7,200
- Reserves months
- —
- Total cash needed
- —
Loan-product check · same deal, 3 products live
Conventional
25% down · 7.5% · 30yr
- Down + closing
- —
- Monthly P&I
- —
- Monthly cashflow
- —
- DSCR
- —
- Eligible?
- —
Personal DTI + credit; lowest rate.
DSCR
20% down · 8.5% · 30yr
- Down + closing
- —
- Monthly P&I
- —
- Monthly cashflow
- —
- DSCR
- —
- Eligible?
- —
No personal income docs; deal must DSCR.
Hard money
10% down · 12.0% · 12mo
- Down + closing
- —
- Monthly P&I
- —
- Monthly cashflow
- —
- DSCR
- —
- Eligible?
- —
Short-term bridge; refi at stabilization.
Listing history 28 events
-
2026-06-18days on market $240,000 Active 189 DOM
-
2026-06-17days on market $240,000 Active 188 DOM
-
2026-06-16days on market $240,000 Active 187 DOM
-
2026-06-15days on market $240,000 Active 186 DOM
-
2026-06-14days on market $240,000 Active 184 DOM
-
2026-06-13days on market $240,000 Active 183 DOM
-
2026-06-10days on market $240,000 Active 181 DOM
-
2026-06-09days on market $240,000 Active 180 DOM
-
2026-06-08days on market $240,000 Active 179 DOM
-
2026-06-07days on market $240,000 Active 178 DOM
-
2026-06-05days on market $240,000 Active 175 DOM
-
2026-06-02days on market $240,000 Active 173 DOM
-
2026-06-01days on market $240,000 Active 172 DOM
-
2026-05-31pricedays on market $240,000 Active 171 DOM
-
2026-05-30days on market $250,000 Active 170 DOM
-
2025-12-11$250,000 Active
-
2023-10-19soldstatus $235,000 Closed
-
2023-08-04price $239,000
-
2023-07-19$259,000 Active
-
2019-06-03historical
-
2019-06-03soldstatus $84,500 Sold
-
2019-05-20status Pending
-
2019-05-15$79,900 Active
-
2017-07-21soldstatus $81,000 Sold
-
2017-07-05status Pending
-
2017-06-28status Active
-
2017-06-26status Pending
-
2017-06-12$69,900 Active
ⓘ Source: listings_history table (triggers on properties + properties_extension) + one-shot
backfill from property_details.listing_events for pre-trigger history.
Tax reassessment forecast WA · Resets to sale price
- Current annual tax
- $1,587 · $132/mo
- Projected year-2 tax
- $2,352 · $196/mo
- Expected delta
- +$765/yr (+$64/mo · 48.2%)
ⓘ Screening estimate from a state-policy table — verify with the county assessor before closing.
Climate risk First Street
- Flood 1/10 Low FEMA zone X (unshaded) · 0% chance over 30 yrs
- Wildfire 2/10 Low
- Heat 3/10 Moderate 7 d/yr ≥89°F today · 14 d/yr by 30 yrs out
- Wind 1/10 Low
- Air quality 6/10 Major 6 unhealthy d/yr today · 7 by 30 yrs out
Nearby sold comps map
Loading sold comps map…
Walkable amenities ~0.75 mi
Loading nearby amenities…
Taxation est. · year 1
- Rental income
- $26,740
- − Mortgage interest
- −$13,444
- − Property taxes
- −$1,587
- − Insurance
- −$1,200
- − Repairs & maintenance
- −$2,139
- − Management
- −$2,139
- − Depreciation
- −$6,982
- Taxable loss
- −$751
- Est. tax savings @ 24.0%
- +$180
- After-tax cash flow
- $3,415/yr
For passive investors: Depreciation is non-cash, so a rental often shows a tax loss while cash-flowing — sheltering income. Rental losses are passive: they offset passive income freely, and up to $25,000/yr can offset ordinary (W-2) income if you actively participate and your MAGI is under $100k (phasing out to $0 by $150k); unused losses carry forward. On sale, claimed depreciation is recaptured at up to 25%, and gains may owe capital-gains tax (a 1031 exchange can defer both). Figures are a year-1 estimate at your 24.0% rate — not tax advice; consult a CPA.
Schools (NCES district)
- District
- Olympia School District
- NCES district ID
- 5306180
- Math proficiency
- 66% ▼ -2.00%
- Reading proficiency
- 75% ▼ -2.00%
- Median HH income
- $63,852
- Composite
- 62.27/100
- National rank
- #1438
- State rank
- #17 of 291 in WA
Livability — Olympia
- Score
- 83/100
- State rank
- #58
- US rank
- #1036
Category grades
Schools grade is shown separately in the Schools card above.
Census & demographics
- County
- Thurston County · 269,345 people
- City population
- 98,428
- Metro
- Olympia-Lacey-Tumwater, WA
- Population (ZIP)
- 18,497
- Household income
- $91,596
- Rent vs Own
- Severe rent burden
- 924.0
Population outlook (Thurston County) Hauer SSP2
- Today (2025)
- 308,239 people
- By 2030
- 326,483 · +5.9%
- By 2040
- 359,890 · +16.8%
- By 2050
- 391,800 · +27.1%
- By 2075
- 468,024 · +51.8%
- By 2100
- 519,890 · +68.7%
Race, ethnicity, and origin ACS 2023
- Neighborhood character
- Predominantly White (81%)
- Race & ethnicity
- White 81% Two or more races 9% Hispanic / Latino 5% Asian 5% Black 1%
- Hispanic origin (detail)
- Mexican 3%
- Common ancestry
- Portuguese 5% Italian 4% Romanian 4%
- Foreign-born
- 8% · Canada, Vietnam, China
- Languages at home
- 89% English-only · Spanish 2% German/W. Germanic 1% Vietnamese 1%
Political lean MEDSL · Thurston
- 2024 margin
- Strong D (+20.4) · D 58.5% · R 38.1% · Other 3.5%
- 2008→2024 swing
- -1.3pp toward R · 2008: 21.7pp · 2024: 20.4pp
- All cycles
- 2024: D+20.4 2020: D+18.6 2016: D+15.4 2012: D+19.0 2008: D+21.7
Not yet ingested
- Civics
- —
Market trends
- HPI YoY
- ▼ -437.08%
- Current HPI
- 363.2295
- Rent YoY
- ▲ 3.66%
- Metro
- Olympia-Lacey-Tumwater, WA
- State GDP YoY
- ▲ 4.65%
- F500 in state
- 22
Industry mix (Fortune 500 HQ in WA)
| Industry | F500 HQs | Revenue |
|---|---|---|
| Retail | 2 | $269B |
|
||
| Technology / Retail | 1 | $638B |
|
||
| Technology | 1 | $245B |
|
||
| Telecommunications | 1 | $38B |
|
||
| Food / Beverage | 1 | $36B |
|
||
| Automotive / Trucks | 1 | $34B |
|
||
Price history
+257.7% since first listed13 events — show timeline
- 2025-12-11 Listed $250,000 NWMLS as Distributed by MLS Grid
- 2023-10-19 Sold (MLS) $235,000 NWMLS as Distributed by MLS Grid
- 2023-08-04 Price Changed $239,000 NWMLS as Distributed by MLS Grid
- 2023-07-19 Listed $259,000 NWMLS as Distributed by MLS Grid
- 2019-06-03 Delisted — NWMLS as Distributed by MLS Grid
- 2019-06-03 Sold (MLS) $84,500 NWMLS as Distributed by MLS Grid
- 2019-05-20 Pending — NWMLS as Distributed by MLS Grid
- 2019-05-15 Listed $79,900 NWMLS as Distributed by MLS Grid
- 2017-07-21 Sold (MLS) $81,000 NWMLS as Distributed by MLS Grid
- 2017-07-05 Pending — NWMLS as Distributed by MLS Grid
- 2017-06-28 Relisted — NWMLS as Distributed by MLS Grid
- 2017-06-26 Pending — NWMLS as Distributed by MLS Grid
- 2017-06-12 Listed $69,900 NWMLS as Distributed by MLS Grid
Property tax history
+19.9%/yrLatest (2026): $1,587 · +5.8% YoY. Source: county tax records.
Cash-flow waterfall
monthlySold comps — $/sqft
last 12 mo · ≤1 miLoading sold comps…