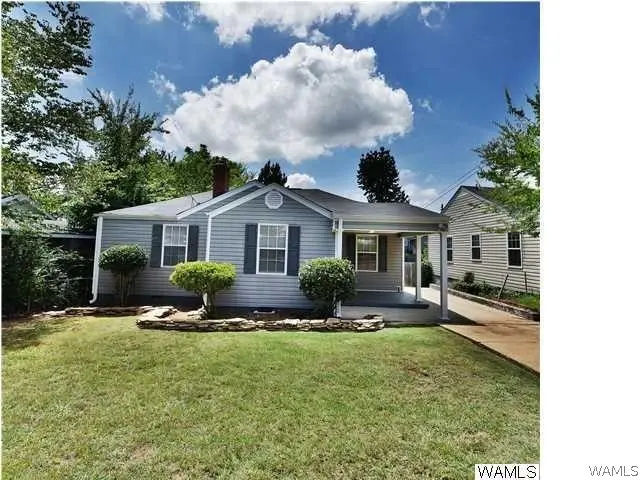
932 16th Ave E · Tuscaloosa, AL
Flood risk 1/10 · Minimal
- FEMA flood zone
- X (unshaded)
- Chance of flooding over 30 yrs
- 0.0%
- Est. flood insurance / yr
- $507 – $1,088
Fire risk 1/10 · Minimal
- Est. fire insurance / yr
- $916 – $1,700
Heat risk 7/10 · Major
- Hot days now (above 108°F)
- 7 days/yr
- Hot days in 30 yrs
- 20 days/yr
Wind risk 6/10 · Moderate
- Chance of severe wind over 30 yrs
- 56.0%
Air-quality risk 3/10 · Minor
- Unhealthy air days now
- 2 days/yr
- Unhealthy air days in 30 yrs
- 3 days/yr
Risk factors via First Street. Map © Google.
Why this score? — see what drove the D- grade
The composite is a weighted blend of 9 inputs, each scored 0–100. Each bar is that input's sub-score; the figure is the points it added to the 100-point composite (weight × sub-score).
- Cash flow +15.8/30.0
- DSCR +4.9/10.0
- Rent growth +4.1/5.0
- Livability +3.9/5.0
- 1% rule +3.1/10.0
- Schools +2.5/10.0
- Condition / age +2.5/5.0
- ARV discount +0.0/15.0
- Appreciation +0.0/10.0
$233,300
🖨 Deal sheet (PDF) 📄 Offer letter ✓ Due diligence
Listing remarks
THIS 3 BEDROOM, 1 BATH HOME IS conveniently located near the University of Alabama and just down the street from DCH Regional Medical Center Enjoy easy access to shopping, grocery stores, dining and other everyday conveniences.
Key facts
- Garage
- Built 1940
- Listed 12 days
Property features AI
Exterior
- Parking: Attached carport; Detached garage (1 garage space); Driveway; Concrete surfaces
- Security: Smoke detector(s)
- Utilities: Cable available; Sewer connected
- Home design: Single-family residence; One level
- Construction: Brick veneer and vinyl siding exterior; Composition/shingle roof; Crawl space foundation; Built with traditional construction materials
- Exterior features: Rain gutters; Covered patio/porch; Deck; Porch; Paved road access
Interior
- Kitchen: Dishwasher; Electric oven; Electric range; Microwave; Refrigerator
- Flooring: Hardwood floors
- Bathrooms: 1 full bathroom
- Heating & cooling: Heating present; Ceiling fans for cooling
- Interior features: Ceiling fans; Wood window frames; Smoke detectors
- Laundry & utility: Main level laundry room; Electric water heater
Neighborhood map
What this means for you Summary
Snapshot
- This is a 3-bed/1.0-bath single-family listed at $233k.
Deal economics
- At list price, monthly cash flow is $106 ($1k/yr) — positive.
- The deal already cash-flows at list — no discount required.
- To meet the 1% rule (rent ≥ 1% of price), the offer needs to be $189k (19.1% below list).
- Recommended offer: $189k (19.1% below list) — sets the bar for 1% rule.
- Cap rate 6.8% vs local median 3.4% in Tuscaloosa — top-decile yield for the area; either an underpriced asset or a hidden risk that comps aren't pricing in. Stress-test before assuming the spread holds.
Location & tenants
- Location reads 77/100 on livability (#9 in AL, #2,909 nationally) — a middle-class / working-renter tenant base. Strengths: amenities A+, health & safety A+, cost of living A; Watch: crime F, employment D-.
- Tuscaloosa City (urban): math 19% / reading 40% proficiency, ranked #74 of 129 in AL (top 57%) — low school quality limits family demand, transient renter base, plan for 1-2y turnover.
- Zoned schools: The Alberta School of Performing Arts (math 10% / reading 37%, grade F, #429 of 627 statewide, top 69%, 671 students, 82% FRL); Northridge Middle School (math 29% / reading 57%, grade D-, #48 of 257 statewide, top 19%, 740 students, 39% FRL); Northridge High School (math 40% / reading 42%, grade F, #31 of 305 statewide, top 10%, 1,145 students, 35% FRL).
- Market conditions: Rents rising fast (+6.3%/yr); 307 active listings in the ZIP; 26 comparable units currently listed for rent nearby; rentals lingering (median 46d on market — plan ~5-8 weeks vacancy on turnover, expect pricing pressure); 54% of comp listings sitting > 30 days — soft ceiling on asking rent; lower-income renter base — watch delinquency; 622 units permitted in Tuscaloosa County in 2024 (69 in 5+ unit buildings).
- At $1,886/mo this rent would consume 78% of the median local household income ($29k/yr) (locally 3997% of renters already pay >50% of income on rent) — very limited rent-growth headroom before tenants either downsize or default.
Forward outlook
- Local home prices are declining (-3.0%/yr); year-one equity from $2k of loan paydown is wiped out by about $7k of value loss. Plan a longer hold.
- Tuscaloosa County population projected at +26% by 2050 — long-run rental-demand tailwind backs the buy-and-hold thesis.
Negotiation context
- Only 12 days on market — expect competitive offers; lowballing is unlikely to land.
- 6 sale attempts since 11y ago with the ask held roughly flat each time — persistent listings suggest the price (not the market) is what's stuck; bring a comps-based counter.
- Current owner paid $95k; list at $233k implies a 146% gain — meaningful room to come down on a strong offer.
Risks & watch-outs
- Watch-outs: built in 1940 — expect roof / HVAC / electrical / plumbing capex.
- Climate carrying-cost: major wind risk, 56% chance of damaging wind over 30y; extreme-heat days projected 7→20/yr by 2055 (HVAC capex compounding) — expect insurance premiums to compound above CPI over the hold.
Questions for the listing agent
- Built in 1940 — when were the roof, HVAC, electrical panel, plumbing, and water heater last replaced?
- Is there a deadline driving the sale (1031 exchange, divorce, estate, relocation)? That informs how much negotiation room exists.
- Crime grade is F in this area — have there been break-ins, vandalism, or insurance claims at this property in the last 3 years? What carrier currently insures it and at what premium?
- The area grade is low — what's the realistic commute time and amenity access for the typical tenant pool here? Any planned neighborhood developments (good or bad) we should know about?
- What's the average days-on-market for RENTAL listings here right now (not sales)? A rising rental-DOM trend means longer vacancies and softer asking-rent achievability than the comps imply.
- What's the recent tenant-quality profile in this submarket — average credit score on applications, eviction rate, late-payment / NSF rate, and stable-employment percentage? A property-management company in the area should have these aggregated.
- How much new for-sale + rental construction is in the pipeline within 1–3 miles? Heavy new supply typically softens prices + rents 12–24 months out; constrained supply supports both.
Investment metrics
- 1% rule
- 0.81% ✗
- Cap rate
- 6.84%
- Cash-on-cash
- 1.95%
- DSCR
- 1.09
- GRM
- 10.3
CMA / ARV
- ARV (on-the-fly)
- $194,247
- Comps found
- 12
Show comp detail 12 sales within ~0.75 mi
| Address | Dist | Beds/Ba | Sqft | Sold | Price | $/sf | Match |
|---|---|---|---|---|---|---|---|
| 1415 13th St E | 0.27mi | 3/2.0 | 1,005 (-1%) | 2mo | $299,900 | $298 | 80 |
| 2012 6th St E | 0.51mi | 3/1.0 | 1,032 (+2%) | 1mo | $199,900 | $194 | 73 |
| 1913 14th Street St E | 0.42mi | 3/1.0 | 1,088 (+7%) | 12mo | $167,500 | $154 | 59 |
| 1119 23rd Ave Ave E | 0.49mi | 3/2.0 | 1,056 (+4%) | 11mo | $195,000 | $185 | 58 |
| 2320 10th St E | 0.50mi | 2/2.0 (-1) | 987 (-3%) | 9mo | $182,000 | $184 | 56 |
| 1265 Lynnwood Park | 0.37mi | 3/1.0 | 864 (-15%) | 6mo | $150,000 | $174 | 53 |
| 1515 17th Ave E | 0.56mi | 2/1.5 (-1) | 1,056 (+4%) | 10mo | $203,000 | $192 | 52 |
| 1432 20th Ave E | 0.54mi | 3/1.0 | 1,154 (+14%) | 2mo | $165,000 | $143 | 50 |
| 1705 17th Ave E | 0.68mi | 3/2.0 | 998 (-2%) | 15mo | $197,000 | $197 | 49 |
| 2131 5th St E | 0.62mi | 3/2.0 | 1,150 (+13%) | 1mo | $219,900 | $191 | 45 |
| 1428 20th Ave E | 0.53mi | 2/2.0 (-1) | 926 (-9%) | 12mo | $189,900 | $205 | 41 |
| 1615 18th Ave E | 0.66mi | 2/1.0 (-1) | 1,120 (+10%) | 14mo | $159,000 | $142 | 36 |
Match score weights: distance 35% · size 25% · config 20% · recency 20%. Top-matched comps best support the ARV.
Projected returns pro-forma
-3.0% appreciation · 6.29% rent growth · sell at horizon
- IRR
- -10.1%
- Equity multiple
- 0.62×
- Total profit
- $-24,702
- Equity at exit
- $34,786
- IRR
- 2.8%
- Equity multiple
- 1.23×
- Total profit
- $15,067
- Equity at exit
- $20,172
Cash invested: $65,324 (down + closing). Projections, not guarantees.
Landlord ↔ Tenant lean methodology
- Overall (STATE)
- 90 Strongly Landlord-Friendly
- State Alabama
- 90 Strongly Landlord-Friendly · R+15
- County
- — inherits STATE
- City
- — inherits STATE
ZIP-level market 35401
- Rents YoY
- 6.3%
- Active inventory
- 307
- Price-to-rent
- 10.3×
Monthly cashflow live
- Estimated rent
- $1,886 high interval (Pro) →
- Mortgage (P&I)
- −$1,223
- Tax from tax record
- −$63 /mo · $759/yr
- Insurance
- −$97
- HOA
- −$0
- Vacancy / Maint / Mgmt
- −$396
- Net cashflow
- $106
Break-even live
Sensitivity live
| Price | -10% $238 | -5% $172 | +0% $106 | +5% $40 | +10% $-26 |
|---|---|---|---|---|---|
| Rent | -10% $-43 | -5% $32 | +0% $106 | +5% $181 | +10% $255 |
| Rate | -1.0pp $224 | -0.5pp $166 | base $106 | +0.5pp $46 | +1.0pp $-16 |
UW: 25.0% down · 7.5% · 30yr · 1.5% tax · 5.0% vac · 8.0% maint · 8.0% mgmt
Financing live
Cash to close
- Down payment
- $58,325
- Closing costs
- $6,999
- Reserves months
- —
- Total cash needed
- —
Loan-product check · same deal, 3 products live
Conventional
25% down · 7.5% · 30yr
- Down + closing
- —
- Monthly P&I
- —
- Monthly cashflow
- —
- DSCR
- —
- Eligible?
- —
Personal DTI + credit; lowest rate.
DSCR
20% down · 8.5% · 30yr
- Down + closing
- —
- Monthly P&I
- —
- Monthly cashflow
- —
- DSCR
- —
- Eligible?
- —
No personal income docs; deal must DSCR.
Hard money
10% down · 12.0% · 12mo
- Down + closing
- —
- Monthly P&I
- —
- Monthly cashflow
- —
- DSCR
- —
- Eligible?
- —
Short-term bridge; refi at stabilization.
Rent comps 26 comps
| Address | Beds | Baths | Sqft | Rent | $/sqft | DOM | Units | Dist |
|---|---|---|---|---|---|---|---|---|
| 30 Beverly Hts Tuscaloosa, AL | 3.0 | 2.0 | 1100 | $2,100 | $1.91 | 15d | 1 | 0.10mi |
| 1305 12th St E Tuscaloosa, AL | 4.0 | 2.0 | 1377 | $1,615 | $1.17 | 23d | 1 | 0.26mi |
| 927 Kicker Rd Tuscaloosa, AL | 3.0 | 3.0 | 1412 | $3,075 | $2.18 | 23d | 2 | 0.30mi |
| 1722 13th St E Tuscaloosa, AL | 3.0 | 1.0 | 1200 | $1,100 | $0.92 | 45d | 1 | 0.32mi |
| 933 21st Ave E Tuscaloosa, AL | 1.0–2.0 | 1.0–2.0 | 906 | $2,150 | $2.37 | 45d | 2 | 0.37mi |
| 936 22nd Ave E Tuscaloosa, AL | 1.0–2.0 | 1.0–2.0 | 906 | $2,000 | $2.21 | 15d | 4 | 0.40mi |
| 1010 23rd Ave E Tuscaloosa, AL | 3.0 | 2.0 | 1251 | $1,500 | $1.20 | 45d | 1 | 0.47mi |
| 922 23rd Ave E Tuscaloosa, AL | 1.0–2.0 | 1.0–2.0 | 1092 | $2,300 | $2.11 | 15d | 4 | 0.47mi |
| 1515 Kicker Rd Tuscaloosa, AL | 1.0–2.0 | 1.0–2.0 | 1050 | $1,025 | $0.98 | 45d | 1 | 0.61mi |
| 2501 Veterans Memorial Pkwy Tuscaloosa, AL | 2.0 | 2.0 | 1018 | $875 | $0.86 | 46d | 1 | 0.85mi |
| 2501 Veterans Memorial Pkwy Tuscaloosa, AL | 2.0 | 2.0 | 1078 | $975 | $0.90 | 15d | 1 | 0.85mi |
| 380 14th Pl E Tuscaloosa, AL | 2.0 | 2.0 | 1440 | $1,850 | $1.28 | 45d | 1 | 0.97mi |
| 1415 2nd East Ct Tuscaloosa, AL | 2.0 | 1.5 | 1033 | $2,200 | $2.13 | 45d | 1 | 1.00mi |
| 1901 5th Ave E Tuscaloosa, AL | 3.0 | 3.0 | 1336 | $2,300 | $1.72 | 23d | 1 | 1.12mi |
| 419 30th Ave E Tuscaloosa, AL | 1.0–2.0 | 1.0–2.0 | 852 | $2,400 | $2.82 | 45d | 5 | 1.14mi |
| 419 30th Ave E Tuscaloosa, AL | 1.0–2.0 | 1.0–2.0 | 852 | $2,200 | $2.58 | 15d | 7 | 1.14mi |
| 20 16th St Tuscaloosa, AL | 1.0–3.0 | 1.0–3.0 | 1320 | $3,000 | $2.27 | 45d | 4 | 1.21mi |
| 632 23rd St E Tuscaloosa, AL | 2.0 | 1.5 | 960 | $1,058 | $1.10 | 23d | 2 | 1.21mi |
| 80 16th St Unit 1-8 Tuscaloosa, AL | 1.0–3.0 | 1.0–3.0 | 1320 | $3,000 | $2.27 | 45d | 4 | 1.23mi |
| 622 4th St NE Unit Highland 4 Tuscaloosa, AL | 2.0 | 2.0 | 1150 | $1,080 | $0.94 | 45d | 1 | 1.25mi |
| 1800 Hargrove East Rd Tuscaloosa, AL | 2.0 | 1.0 | 950 | $875 | $0.92 | 15d | 1 | 1.31mi |
| 302 22nd St E Tuscaloosa, AL | 3.0 | 2.0 | 1150 | $1,475 | $1.28 | 23d | 1 | 1.35mi |
| 123 Circlewood Tuscaloosa, AL | 2.0 | 1.0 | 1250 | $1,150 | $0.92 | 45d | 1 | 1.36mi |
| 680 6th Ave NE #3401 Tuscaloosa, AL | 3.0 | 3.0 | 1266 | $2,300 | $1.82 | 45d | 1 | 1.37mi |
| 3218 Veterans Memorial Pkwy Tuscaloosa, AL | 3.0 | 3.0–3.5 | 1484 | $1,950 | $1.31 | 23d | 1 | 1.39mi |
| 680 6th Ave NE Unit WC3407 A Tuscaloosa, AL | 3.0 | 3.0 | 1266 | $1,200 | $0.95 | 45d | 1 | 1.40mi |
Listing history 9 events
-
2026-06-21days on market $233,300 Active 12 DOM
-
2026-06-18days on market $233,300 Active 9 DOM
-
2026-06-17days on market $233,300 Active 8 DOM
-
2026-06-16days on market $233,300 Active 7 DOM
-
2026-06-15days on market $233,300 Active 6 DOM
-
2026-06-14days on market $233,300 Active 4 DOM
-
2026-06-13days on market $233,300 Active 3 DOM
-
2026-06-10remarks 227-char remark
-
2026-06-10$233,300 Active 1 DOM
ⓘ Source: listings_history table (triggers on properties + properties_extension) + one-shot
backfill from property_details.listing_events for pre-trigger history.
Tax reassessment forecast AL · Resets to sale price
- Current annual tax
- $759 · $63/mo
- Projected year-2 tax
- $957 · $80/mo
- Expected delta
- +$197/yr (+$16/mo · 26.0%)
ⓘ Screening estimate from a state-policy table — verify with the county assessor before closing.
Climate risk First Street
- Flood 1/10 Low FEMA zone X (unshaded) · 0% chance over 30 yrs
- Wildfire 1/10 Low
- Heat 7/10 Severe 7 d/yr ≥108°F today · 20 d/yr by 30 yrs out
- Wind 6/10 Major 56% chance of damaging wind over 30 yrs
- Air quality 3/10 Moderate 2 unhealthy d/yr today · 3 by 30 yrs out
Nearby sold comps map
Loading sold comps map…
Walkable amenities ~0.75 mi
Loading nearby amenities…
Taxation est. · year 1
- Rental income
- $22,635
- − Mortgage interest
- −$13,068
- − Property taxes
- −$759
- − Insurance
- −$1,166
- − Repairs & maintenance
- −$1,811
- − Management
- −$1,811
- − Depreciation
- −$6,787
- Taxable loss
- −$2,768
- Est. tax savings @ 24.0%
- +$664
- After-tax cash flow
- $1,939/yr
For passive investors: Depreciation is non-cash, so a rental often shows a tax loss while cash-flowing — sheltering income. Rental losses are passive: they offset passive income freely, and up to $25,000/yr can offset ordinary (W-2) income if you actively participate and your MAGI is under $100k (phasing out to $0 by $150k); unused losses carry forward. On sale, claimed depreciation is recaptured at up to 25%, and gains may owe capital-gains tax (a 1031 exchange can defer both). Figures are a year-1 estimate at your 24.0% rate — not tax advice; consult a CPA.
Schools (NCES district)
- District
- Tuscaloosa City
- NCES district ID
- 0103360
- Math proficiency
- 19% ▼ -24.00%
- Reading proficiency
- 40% ▼ -1.00%
- Median HH income
- $37,474
- Composite
- 24.51/100
- National rank
- #7647
- State rank
- #74 of 129 in AL
Livability — Tuscaloosa
- Score
- 77/100
- State rank
- #9
- US rank
- #2909
Category grades
Schools grade is shown separately in the Schools card above.
Census & demographics
- Census place
- Tuscaloosa, AL
- County
- Tuscaloosa County · 206,491 people
- City population
- 134,228
- Metro
- Tuscaloosa, AL
- Population (ZIP)
- 43,459
- Household income
- $29,152
- Rent vs Own
- Severe rent burden
- 3997.0
Population outlook (Tuscaloosa County) Hauer SSP2
- Today (2025)
- 228,293 people
- By 2030
- 240,551 · +5.4%
- By 2040
- 263,856 · +15.6%
- By 2050
- 286,491 · +25.5%
- By 2075
- 335,783 · +47.1%
- By 2100
- 370,520 · +62.3%
Race, ethnicity, and origin ACS 2023
- Neighborhood character
- Diverse neighborhood (Simpson 0.58)
- Race & ethnicity
- Black 47% White 44% Hispanic / Latino 5% Two or more races 4% Asian 2%
- Common ancestry
- Slovak 2% Italian 1% Romanian 1%
- Foreign-born
- 3% · Canada, China
- Languages at home
- 96% English-only · Spanish 2% Other Indo-European 1% Chinese 1%
Political lean MEDSL · Tuscaloosa
- 2024 margin
- Strong R (+20.4) · D 39.4% · R 59.8%
- 2008→2024 swing
- -4.4pp toward R · 2008: -16.0pp · 2024: -20.4pp
- All cycles
- 2024: R+20.4 2020: R+14.8 2016: R+19.5 2012: R+17.4 2008: R+16.0
Not yet ingested
- Civics
- —
Market trends
- HPI YoY
- ▼ -191.40%
- Current HPI
- 179.8335
- Rent YoY
- ▲ 6.29%
- Metro
- Tuscaloosa, AL
- State GDP YoY
- ▲ 2.94%
- F500 in state
- 4
Industry mix (Fortune 500 HQ in AL)
| Industry | F500 HQs | Revenue |
|---|---|---|
| Financial Services | 1 | $8B |
|
||
| Healthcare | 1 | $5B |
|
||
Price history
+199.1% since first listed9 events — show timeline
- 2026-06-09 Listed $233,300 WAMLS
- 2025-02-11 Listed $249,900 WAMLS
- 2023-06-28 Listed $225,000 WAMLS
- 2021-05-26 Listed $185,900 WAMLS
- 2016-08-03 Sold (MLS) — WAMLS
- 2016-07-12 Listed $162,900 WAMLS
- 2016-02-17 Sold (Public Records) $95,000 Public Records
- 2015-06-01 Listed $122,200 WAMLS
- 2008-03-10 Sold (Public Records) $78,000 Public Records
Property tax history
+8.5%/yrLatest (2025): $759 · +7.0% YoY. Source: county tax records.
Cash-flow waterfall
monthlySold comps — $/sqft
last 12 mo · ≤1 miLoading sold comps…