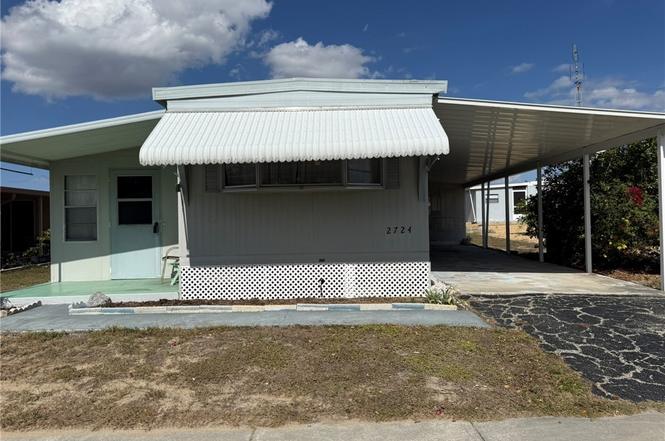
2724 Desoto Rd · Sebring, FL
Flood risk 1/10 · Minimal
- FEMA flood zone
- X (unshaded)
- Chance of flooding over 30 yrs
- 0.0%
- Est. flood insurance / yr
- $507 – $1,088
Fire risk 5/10 · Moderate
- Est. fire insurance / yr
- $947 – $1,759
Heat risk 9/10 · Severe
- Hot days now (above 108°F)
- 7 days/yr
- Hot days in 30 yrs
- 25 days/yr
Wind risk 9/10 · Severe
- Chance of severe wind over 30 yrs
- 99.0%
Air-quality risk 2/10 · Minimal
- Unhealthy air days now
- 1 days/yr
- Unhealthy air days in 30 yrs
- 1 days/yr
Risk factors via First Street. Map © Google.
Why this score? — see what drove the C+ grade
The composite is a weighted blend of 9 inputs, each scored 0–100. Each bar is that input's sub-score; the figure is the points it added to the 100-point composite (weight × sub-score).
- Cash flow +30.0/30.0
- DSCR +10.0/10.0
- 1% rule +8.7/10.0
- Schools +3.6/10.0
- Livability +3.3/5.0
- Condition / age +2.5/5.0
- Rent growth +2.4/5.0
- ARV discount +0.0/15.0
- Appreciation +0.0/10.0
$89,000
🖨 Deal sheet 📄 Offer letter ✓ Due diligence
Listing remarks MLS
AC replaced within 5 years, newer flooring, Roof resealed 2019 with a long life sealer. Great 55+ neighborhood with pool, and community clubhouse.
Key facts
- Kitchen cabinetry
- Office space
- Hot tub
Tags
Property features AI
Finance
- HOA & community: Homeowners association with $55 monthly fee; Senior community; Community clubhouse
Exterior
- Parking: Carport (1 space)
- Utilities: Public water; Public sewer; Sewer available
- Home design: Mobile home; Single-story; Residential property
- Construction: Frame construction; Metal roof; Skirted mobile home
- Exterior features: Screened porch; Side porch; Community pool; Pets allowed; Paved road access; 50 ft frontage
Interior
- Flooring: Carpet; Vinyl
- Bathrooms: 1 full bathroom
- Heating & cooling: Central heating (electric); Central air conditioning (electric)
- Interior features: Partially furnished; 5 total rooms
Neighborhood map
What this means for you Summary
Snapshot
- This is a 2-bed/2.0-bath manufactured listed at $89k.
Deal economics
- At list price, monthly cash flow is $334 ($4k/yr) — positive.
- The deal already cash-flows at list — no discount required.
- Meets the 1% rule at list price ($1k rent vs $89k).
- Recommended offer: $78k (12.0% below list) — sets the bar for market timing.
- Cap rate 10.8% vs local median 4.3% in Sebring — top-decile yield for the area; either an underpriced asset or a hidden risk that comps aren't pricing in. Stress-test before assuming the spread holds.
Location & tenants
- Location reads 66/100 on livability (#618 in FL) — a middle-class / working-renter tenant base. Strengths: cost of living A+, housing A+, health & safety A; Watch: schools D, amenities F, commute F.
- Highlands (other): math 45% / reading 43% proficiency, ranked #54 of 73 in FL (top 74%) — families likely to look elsewhere, expect single-tenant / working-renter base with shorter leases; 68% free/reduced lunch — lower-income household profile, screen leases tightly.
- Market conditions: Rents soft (-0.3%/yr); 475 active listings in the ZIP; 980 units permitted in Highlands County in 2024 (80 in 5+ unit buildings).
Forward outlook
- Local home prices are declining (-3.0%/yr); year-one equity from $615 of loan paydown is wiped out by about $3k of value loss. Plan a longer hold.
Negotiation context
- It's been on market 140 days — a 12% lower offer ($78k) is reasonable based on typical stale-listing flexibility.
- 5 sale attempts since 12y ago; this cycle's ask has dropped $6k (6%) from the opening price — seller is motivated, your offer sets the floor, not the list.
- Current owner paid $35k; list at $89k implies a 154% gain — meaningful room to come down on a strong offer.
Risks & watch-outs
- Climate carrying-cost: severe wind risk, 99% chance of damaging wind over 30y; moderate wildfire risk; extreme-heat days projected 7→25/yr by 2055 (HVAC capex compounding) — expect insurance premiums to compound above CPI over the hold.
Questions for the listing agent
- It's been on market 140 days. Have you received any prior offers? Is the seller open to a 12% concession, seller financing, or rate buy-down credit?
- Built in 1972 — when were the roof, HVAC, electrical panel, plumbing, and water heater last replaced?
- What does the HOA fee cover, when was the last increase, and are there any pending special assessments or reserve-fund shortfalls?
- Why hasn't it sold? Are there any deal-killer items the seller is aware of (foundation, flood, title, zoning, code violations)?
- Is there a deadline driving the sale (1031 exchange, divorce, estate, relocation)? That informs how much negotiation room exists.
- Schools are D-rated, which usually means shorter tenancies and higher turnover. Who's the typical renter profile here, and what's been the actual vacancy rate?
- What's the average days-on-market for RENTAL listings here right now (not sales)? A rising rental-DOM trend means longer vacancies and softer asking-rent achievability than the comps imply.
- What's the recent tenant-quality profile in this submarket — average credit score on applications, eviction rate, late-payment / NSF rate, and stable-employment percentage? A property-management company in the area should have these aggregated.
- How much new for-sale + rental construction is in the pipeline within 1–3 miles? Heavy new supply typically softens prices + rents 12–24 months out; constrained supply supports both.
Investment metrics
- 1% rule
- 1.37% ✓
- Cap rate
- 10.80%
- Cash-on-cash
- 16.09%
- DSCR
- 1.72
- GRM
- 6.1
CMA / ARV
- ARV (on-the-fly)
- $67,200
- Comps found
- 12
Show comp detail 12 sales within ~0.75 mi
| Address | Dist | Beds/Ba | Sqft | Sold | Price | $/sf | Match |
|---|---|---|---|---|---|---|---|
| 2942 San Francisco Ln | 0.15mi | 2/1.0 | 672 (0%) | 3mo | $77,450 | $115 | 87 |
| 3121 Paradise Path | 0.26mi | 2/1.5 | 672 (0%) | 3mo | $77,500 | $115 | 83 |
| 2932 Desoto Rd | 0.13mi | 2/2.0 | 672 (0%) | 16mo | $72,000 | $107 | 81 |
| 30523 Francis St | 0.43mi | 2/2.0 | 672 (0%) | 3mo | $62,000 | $92 | 77 |
| 3050 San Francisco Ln | 0.22mi | 2/2.0 | 672 (0%) | 15mo | $79,900 | $119 | 77 |
| 2720 Las Vegas Blvd | 0.08mi | 2/2.0 | 720 (+7%) | 11mo | $55,000 | $76 | 75 |
| 30501 Francis St | 0.43mi | 1/2.0 (-1) | 672 (0%) | 3mo | $63,000 | $94 | 72 |
| 8070 Von Maxcy Rd | 0.59mi | 2/2.0 | 672 (0%) | 4mo | $60,000 | $89 | 69 |
| 30408 Francis St | 0.48mi | 2/2.0 | 672 (0%) | 16mo | $67,000 | $100 | 64 |
| 8019 Von Maxcy Rd | 0.68mi | 2/2.0 | 672 (0%) | 11mo | $30,000 | $45 | 59 |
| 30495 Tiger Tail Rd | 0.47mi | 2/1.5 | 720 (+7%) | 10mo | $70,000 | $97 | 56 |
| 30417 Francis St | 0.49mi | 2/2.0 | 612 (-9%) | 12mo | $69,000 | $113 | 52 |
Match score weights: distance 35% · size 25% · config 20% · recency 20%. Top-matched comps best support the ARV.
Projected returns pro-forma
-3.0% appreciation · 0.0% rent growth · sell at horizon
- IRR
- 3.6%
- Equity multiple
- 1.13×
- Total profit
- $3,326
- Equity at exit
- $13,270
- IRR
- 10.0%
- Equity multiple
- 1.67×
- Total profit
- $16,643
- Equity at exit
- $7,695
Cash invested: $24,920 (down + closing). Projections, not guarantees.
Landlord ↔ Tenant lean methodology
- Overall (STATE)
- 87 Strongly Landlord-Friendly
- State Florida
- 87 Strongly Landlord-Friendly · R+3
- County
- — inherits STATE
- City
- — inherits STATE
ZIP-level market 33870
- Home prices YoY
- -20.0%
- Rents YoY
- -0.3%
- Active inventory
- 475
- Price-to-rent
- 6.1×
Monthly cashflow live
- Estimated rent
- $1,215 medium interval (Pro) →
- Mortgage (P&I)
- −$467
- Tax from tax record
- −$67 /mo · $802/yr
- Insurance
- −$37
- HOA
- −$55
- Vacancy / Maint / Mgmt
- −$255
- Net cashflow
- $334
Break-even live
UW: 25.0% down · 7.5% · 30yr · 1.5% tax · 5.0% vac · 8.0% maint · 8.0% mgmt
Financing live
Cash to close
- Down payment
- $22,250
- Closing costs
- $2,670
- Reserves months
- —
- Total cash needed
- —
Loan-product check · same deal, 3 products live
Conventional
25% down · 7.5% · 30yr
- Down + closing
- —
- Monthly P&I
- —
- Monthly cashflow
- —
- DSCR
- —
- Eligible?
- —
Personal DTI + credit; lowest rate.
DSCR
20% down · 8.5% · 30yr
- Down + closing
- —
- Monthly P&I
- —
- Monthly cashflow
- —
- DSCR
- —
- Eligible?
- —
No personal income docs; deal must DSCR.
Hard money
10% down · 12.0% · 12mo
- Down + closing
- —
- Monthly P&I
- —
- Monthly cashflow
- —
- DSCR
- —
- Eligible?
- —
Short-term bridge; refi at stabilization.
HOA detail
- Monthly dues
- $55 · $660/yr
- Likely covers
- pool
Listing history 25 events
-
2026-06-19days on market $89,000 Active 140 DOM
-
2026-06-18days on market $89,000 Active 139 DOM
-
2026-06-17days on market $89,000 Active 138 DOM
-
2026-06-16days on market $89,000 Active 137 DOM
-
2026-06-15days on market $89,000 Active 136 DOM
-
2026-06-14days on market $89,000 Active 134 DOM
-
2026-06-10days on market $89,000 Active 131 DOM
-
2026-06-09days on market $89,000 Active 130 DOM
-
2026-06-08days on market $89,000 Active 129 DOM
-
2026-06-07days on market $89,000 Active 128 DOM
-
2026-06-02days on market $89,000 Active 123 DOM
-
2026-06-01days on market $89,000 Active 122 DOM
-
2026-05-31days on market $89,000 Active 121 DOM
-
2026-05-30days on market $89,000 Active 120 DOM
-
2026-02-26price $89,000
-
2026-01-29$95,000 Active
-
2026-01-26historical $1,000
-
2025-12-04$1,000
-
2025-07-04historical $1,000
-
2025-06-18$1,000
-
2020-12-25soldstatus $35,000 146-char remark
Show marketing remark (146 chars)
AC replaced within 5 years, newer flooring, Roof resealed 2019 with a long life sealer. Great 55+ neighborhood with pool, and community clubhouse.
-
2020-10-14$37,000 146-char remark
Show marketing remark (146 chars)
AC replaced within 5 years, newer flooring, Roof resealed 2019 with a long life sealer. Great 55+ neighborhood with pool, and community clubhouse.
-
2014-06-13soldstatus $20,000 464-char remark
Show marketing remark (464 chars)
Freshly painted 2 bedroom and 1 bath mobile home in Francis II. Home features a separate living room and family room and oversized kitchen with dining area. The dining area overlooks the windows at the front of the home. There is a workshop/laundry room off living room for additional storage. Enjoy your Florida evenings on your 11x19 screened porch. Francis II offer a community center, pool and shuffleboard course and is located close to shopping and commerce.
-
2014-03-06$23,000 464-char remark
Show marketing remark (464 chars)
Freshly painted 2 bedroom and 1 bath mobile home in Francis II. Home features a separate living room and family room and oversized kitchen with dining area. The dining area overlooks the windows at the front of the home. There is a workshop/laundry room off living room for additional storage. Enjoy your Florida evenings on your 11x19 screened porch. Francis II offer a community center, pool and shuffleboard course and is located close to shopping and commerce.
-
1998-01-06soldstatus $17,000
ⓘ Source: listings_history table (triggers on properties + properties_extension) + one-shot
backfill from property_details.listing_events for pre-trigger history.
Tax reassessment forecast FL · Resets to sale price
- Current annual tax
- $802 · $67/mo
- Projected year-2 tax
- $802 · $67/mo
- Expected delta
- $0/yr ($0/mo · -0.0%)
ⓘ Screening estimate from a state-policy table — verify with the county assessor before closing.
Climate risk First Street
- Flood 1/10 Low FEMA zone X (unshaded) · 0% chance over 30 yrs
- Wildfire 5/10 Major
- Heat 9/10 Extreme 7 d/yr ≥108°F today · 25 d/yr by 30 yrs out
- Wind 9/10 Extreme 99% chance of damaging wind over 30 yrs
- Air quality 2/10 Low 1 unhealthy d/yr today · 1 by 30 yrs out
Nearby sold comps map
Loading sold comps map…
Walkable amenities ~0.75 mi
Loading nearby amenities…
Taxation est. · year 1
- Rental income
- $14,580
- − Mortgage interest
- −$4,985
- − Property taxes
- −$802
- − Insurance
- −$445
- − Repairs & maintenance
- −$1,166
- − Management
- −$1,166
- − HOA
- −$660
- − Depreciation
- −$2,589
- Taxable income
- $2,765
- Est. tax owed @ 24.0%
- −$664
- After-tax cash flow
- $3,346/yr
For passive investors: Depreciation is non-cash, so a rental often shows a tax loss while cash-flowing — sheltering income. Rental losses are passive: they offset passive income freely, and up to $25,000/yr can offset ordinary (W-2) income if you actively participate and your MAGI is under $100k (phasing out to $0 by $150k); unused losses carry forward. On sale, claimed depreciation is recaptured at up to 25%, and gains may owe capital-gains tax (a 1031 exchange can defer both). Figures are a year-1 estimate at your 24.0% rate — not tax advice; consult a CPA.
Schools (NCES district)
- District
- Highlands
- NCES district ID
- 1200840
- Math proficiency
- 45% ▼ -7.00%
- Reading proficiency
- 43% ▼ -3.00%
- Median HH income
- $35,276
- Composite
- 36.42/100
- National rank
- #4672
- State rank
- #54 of 73 in FL
Livability — Sebring
- Score
- 66/100
- State rank
- #618
- US rank
- #11992
Category grades
Schools grade is shown separately in the Schools card above.
Census & demographics
- County
- Highlands County · 98,898 people
- City population
- 50,797
- Metro
- Sebring-Avon Park, FL
- Population (ZIP)
- 25,195
- Household income
- $49,942
- Rent vs Own
- Severe rent burden
- 994.0
Population outlook (Highlands County) Hauer SSP2
- Today (2025)
- 99,674 people
- By 2030
- 99,615 · -0.1%
- By 2040
- 99,342 · -0.3%
- By 2050
- 98,242 · -1.4%
- By 2075
- 93,291 · -6.4%
- By 2100
- 79,894 · -19.8%
Race, ethnicity, and origin ACS 2023
- Neighborhood character
- Diverse neighborhood (Simpson 0.57)
- Race & ethnicity
- White 60% Hispanic / Latino 22% Black 13% Two or more races 10% Asian 1%
- Hispanic origin (detail)
- Mexican 8% Puerto Rican 7% Cuban 5%
- Common ancestry
- Slovak 2% Romanian 1% Lithuanian 1%
- Foreign-born
- 10% · Canada, Jamaica, China
- Languages at home
- 80% English-only · Spanish 16% Other Indo-European 1% French/Haitian/Cajun 1%
Political lean MEDSL · Highlands
- 2024 margin
- Solid R (+40.8) · D 29.3% · R 70.1%
- 2008→2024 swing
- -22.7pp toward R · 2008: -18.1pp · 2024: -40.8pp
- All cycles
- 2024: R+40.8 2020: R+34.4 2016: R+32.0 2012: R+23.0 2008: R+18.1
Not yet ingested
- Civics
- —
Market trends
- HPI YoY
- ▼ -68.68%
- Current HPI
- 273.9861
- Rent YoY
- ▼ -0.29%
- Metro
- Sebring-Avon Park, FL
- State GDP YoY
- ▲ 3.28%
- F500 in state
- 36
Industry mix (Fortune 500 HQ in FL)
| Industry | F500 HQs | Revenue |
|---|---|---|
| Industrial Technology | 2 | $29B |
|
||
| Insurance | 2 | $17B |
|
||
| Retail | 1 | $60B |
|
||
| Technology Distribution | 1 | $58B |
|
||
| Homebuilding | 1 | $35B |
|
||
| Technology Manufacturing | 1 | $35B |
|
||
Price history
+423.5% since first listed11 events — show timeline
- 2026-02-26 Price Changed $89,000 HAOR as distributed by MLS GRID
- 2026-01-29 Listed $95,000 HAOR as distributed by MLS GRID
- 2026-01-26 Rental Removed $1,000 HAOR
- 2025-12-04 Listed for Rent $1,000 HAOR
- 2025-07-04 Rental Removed $1,000 HAOR
- 2025-06-18 Listed for Rent $1,000 HAOR
- 2020-12-25 Sold (MLS) $35,000 HAOR as distributed by MLS GRID
- 2020-10-14 Listed $37,000 HAOR as distributed by MLS GRID
- 2014-06-13 Sold (MLS) $20,000 HAOR as distributed by MLS GRID
- 2014-03-06 Listed $23,000 HAOR as distributed by MLS GRID
- 1998-01-06 Sold (Public Records) $17,000 Public Records
Property tax history
+6.1%/yrLatest (2025): $802 · +10.9% YoY. Source: county tax records.
Cash-flow waterfall
monthlySold comps — $/sqft
last 12 mo · ≤1 miLoading sold comps…