 Duplex
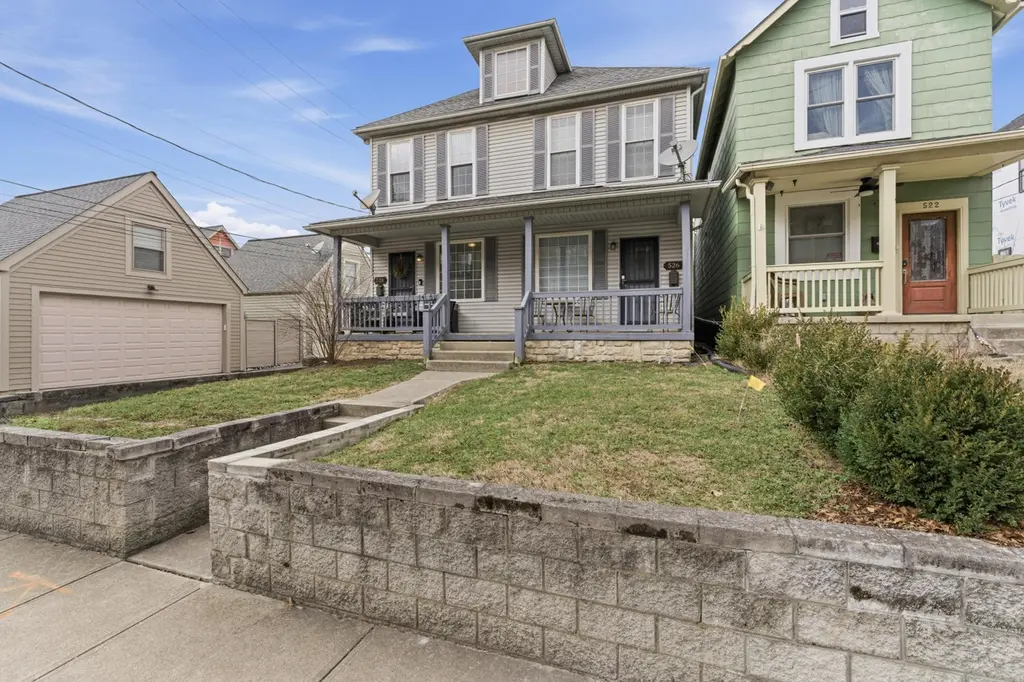
526 W 1st Ave · Columbus, OH
Flood risk 6/10 · Moderate
- FEMA flood zone
- X (unshaded)
- Chance of flooding over 30 yrs
- 0.69%
- Est. flood insurance / yr
- $473 – $860
Fire risk 1/10 · Minimal
- Est. fire insurance / yr
- $713 – $1,323
Heat risk 4/10 · Minor
- Hot days now (above 100°F)
- 7 days/yr
- Hot days in 30 yrs
- 18 days/yr
Wind risk 2/10 · Minimal
- Chance of severe wind over 30 yrs
- 1.0%
Air-quality risk 3/10 · Minor
- Unhealthy air days now
- 2 days/yr
- Unhealthy air days in 30 yrs
- 4 days/yr
Risk factors via First Street. Map © Google.
Why this score? — see what drove the C- grade
The composite is a weighted blend of 9 inputs, each scored 0–100. Each bar is that input's sub-score; the figure is the points it added to the 100-point composite (weight × sub-score).
- Cash flow +16.2/30.0
- ARV discount +14.9/15.0
- DSCR +5.0/10.0
- 1% rule +4.4/10.0
- Livability +4.0/5.0
- Rent growth +3.0/5.0
- Condition / age +2.8/5.0
- Schools +1.7/10.0
- Appreciation +0.0/10.0
$549,900
🖨 Deal sheet 📄 Offer letter ✓ Due diligence
Multi-family units
County records classify this as Multi-Family (2-4 Unit). Listing-text estimate: 2 units. confirmed
Listing remarks MLS
Duplex - both sides 3 bedroom. 528 has a bonus loft/office area.
Key facts
- Office area
- Bonus loft
- 3,484 sq ft lot
Tags
Neighborhood map
What this means for you Summary
Snapshot
- This is a 2 × 3-bed/1-bath units multifamily listed at $550k. Condition is rated average.
Deal economics
- At list price, monthly cash flow is $293 ($4k/yr) — positive. Per door: $146/mo.
- The deal already cash-flows at list — no discount required.
- To meet the 1% rule (rent ≥ 1% of price), the offer needs to be $518k (5.8% below list).
- Recommended offer: $517k (6.0% below list) — sets the bar for market timing.
- Cap rate 6.9% vs local median 3.8% in Columbus — top-decile yield for the area; either an underpriced asset or a hidden risk that comps aren't pricing in. Stress-test before assuming the spread holds.
Location & tenants
- Location reads 81/100 on livability (#97 in OH, #1,491 nationally) — a professional / high-income tenant draw. Strengths: commute A+, cost of living A+, housing A+; Watch: employment C-, crime F.
- Columbus City School District (urban): math 15% / reading 26% proficiency, ranked #626 of 656 in OH (top 95%) — low school quality limits family demand, transient renter base, plan for 1-2y turnover; 72% free/reduced lunch — lower-income household profile, screen leases tightly.
- Market conditions: Rents rising (+2.1%/yr); 136 active listings in the ZIP; 3 comparable units currently listed for rent nearby; rentals at typical pace (median 24d on market — plan ~3-4 weeks tenant-placement turnaround); lower-income renter base — watch delinquency; 8,139 units permitted in Franklin County in 2024 (5,940 in 5+ unit buildings).
- At $5,181/mo this rent would consume 142% of the median local household income ($44k/yr) (locally 4913% of renters already pay >50% of income on rent) — very limited rent-growth headroom before tenants either downsize or default.
Forward outlook
- Local home prices are declining (-3.0%/yr); year-one equity from $4k of loan paydown is wiped out by about $16k of value loss. Plan a longer hold.
- Franklin County population projected at +34% by 2050 — long-run rental-demand tailwind backs the buy-and-hold thesis.
Negotiation context
- It's been on market 86 days — a 6% lower offer ($517k) is reasonable based on typical stale-listing flexibility.
- 2 sale attempts; this cycle's ask has dropped $30k (5%) from the opening price — seller is motivated, your offer sets the floor, not the list.
Risks & watch-outs
- Watch-outs: built in 1900 — expect roof / HVAC / electrical / plumbing capex.
- Climate carrying-cost: major flood risk — expect insurance premiums to compound above CPI over the hold.
Questions for the listing agent
- It's been on market 86 days. Have you received any prior offers? Is the seller open to a 6% concession, seller financing, or rate buy-down credit?
- Can we see the unit-by-unit rent roll, current vacancy, and any below-market leases? What's the average tenancy length?
- What capital expenditures (roof, boiler, parking lot, exteriors) have been made in the last 5 years, and what's planned in the next 2?
- Built in 1900 — when were the roof, HVAC, electrical panel, plumbing, and water heater last replaced?
- Why hasn't it sold? Are there any deal-killer items the seller is aware of (foundation, flood, title, zoning, code violations)?
- Is there a deadline driving the sale (1031 exchange, divorce, estate, relocation)? That informs how much negotiation room exists.
- Crime grade is F in this area — have there been break-ins, vandalism, or insurance claims at this property in the last 3 years? What carrier currently insures it and at what premium?
- What's the average days-on-market for RENTAL listings here right now (not sales)? A rising rental-DOM trend means longer vacancies and softer asking-rent achievability than the comps imply.
- What's the recent tenant-quality profile in this submarket — average credit score on applications, eviction rate, late-payment / NSF rate, and stable-employment percentage? A property-management company in the area should have these aggregated.
- How much new apartment / multifamily construction is in the pipeline within 1–3 miles? Heavy new supply (>2% of stock underway) typically softens rents 12–24 months out; light construction supports rent growth.
Investment metrics
- 1% rule
- 0.94% ✗
- Cap rate
- 6.93%
- Cash-on-cash
- 2.28%
- DSCR
- 1.10
- GRM
- 8.8
CMA / ARV
- ARV (median comp)
- $657,656
- List price
- $549,900
- Delta
- -16.38%
- Verdict
- UNDERPRICED
- Comps
- 20 within 1.0 mi
Show comp detail 3 sales within ~0.75 mi
| Address | Dist | Beds/Ba | Sqft | Sold | Price | $/sf | Match |
|---|---|---|---|---|---|---|---|
| 326 - 328 W 1st Ave | 0.29mi | 6/— | 2,668 (-12%) | 13mo | $620,000 | $232 | 56 |
| 246 - 248 W 4th Ave | 0.48mi | 6/— | 3,386 (+12%) | 13mo | $549,000 | $162 | 47 |
| 823 - 827 Timberman Rd | 0.73mi | 6/— | 2,586 (-14%) | 10mo | $585,000 | $226 | 34 |
Match score weights: distance 35% · size 25% · config 20% · recency 20%. Top-matched comps best support the ARV.
Projected returns pro-forma
-3.0% appreciation · 2.14% rent growth · sell at horizon
- IRR
- -13.6%
- Equity multiple
- 0.51×
- Total profit
- $-74,829
- Equity at exit
- $81,992
- IRR
- -6.2%
- Equity multiple
- 0.62×
- Total profit
- $-58,760
- Equity at exit
- $47,545
Cash invested: $153,972 (down + closing). Projections, not guarantees.
Landlord ↔ Tenant lean methodology
- Overall (STATE)
- 73 Landlord-Friendly
- State Ohio
- 73 Landlord-Friendly · R+6
- County
- — inherits STATE
- City
- — inherits STATE
ZIP-level market 43201
- Rents YoY
- 2.1%
- Active inventory
- 136
- Price-to-rent
- 17.7×
Monthly cashflow live
- Estimated rent
- $5,181 high interval (Pro) →
- Mortgage (P&I)
- −$2,884
- Tax est. 1.5%
- −$687 /mo · $8,248/yr
- Insurance
- −$229
- HOA
- −$0
- Vacancy / Maint / Mgmt
- −$1,088
- Net cashflow
- $293
Break-even live
2-unit breakdown (identical units grouped — click to expand)
| Units | Beds | Baths | Est. rent |
|---|---|---|---|
| 2× units | 3 | 1 | $5,182 |
| #1 | 3 | 1 | $2,591 |
| #2 | 3 | 1 | $2,591 |
| Total (2 units) | $5,181 | ||
UW: 25.0% down · 7.5% · 30yr · 1.5% tax · 5.0% vac · 8.0% maint · 8.0% mgmt
Financing live
Cash to close
- Down payment
- $137,475
- Closing costs
- $16,497
- Reserves months
- —
- Total cash needed
- —
Loan-product check · same deal, 3 products live
Conventional
25% down · 7.5% · 30yr
- Down + closing
- —
- Monthly P&I
- —
- Monthly cashflow
- —
- DSCR
- —
- Eligible?
- —
Personal DTI + credit; lowest rate.
DSCR
20% down · 8.5% · 30yr
- Down + closing
- —
- Monthly P&I
- —
- Monthly cashflow
- —
- DSCR
- —
- Eligible?
- —
No personal income docs; deal must DSCR.
Hard money
10% down · 12.0% · 12mo
- Down + closing
- —
- Monthly P&I
- —
- Monthly cashflow
- —
- DSCR
- —
- Eligible?
- —
Short-term bridge; refi at stabilization.
Rent comps 3 comps
| Address | Beds | Baths | Sqft | Rent | $/sqft | DOM | Units | Dist |
|---|---|---|---|---|---|---|---|---|
| 294 King Ave Columbus, OH | 5.0 | 3.0 | 2500 | $2,395 | $0.96 | 43d | 1 | 0.71mi |
| 1329 Indianola Ave Unit 1407030P Columbus, OH | 6.0 | 2.5 | 3498 | $8,656 | $2.47 | 21d | 1 | 1.02mi |
| 1329 Indianola Ave Unit 1407025P Columbus, OH | 5.0 | 2.5 | 3498 | $8,624 | $2.47 | 23d | 1 | 1.02mi |
Listing history 21 events
-
2026-06-18days on market $549,900 Active 86 DOM
-
2026-06-17days on market $549,900 Active 85 DOM
-
2026-06-16days on market $549,900 Active 84 DOM
-
2026-06-15days on market $549,900 Active 83 DOM
-
2026-06-13days on market $549,900 Active 81 DOM
-
2026-06-13days on market $549,900 Active 80 DOM
-
2026-06-09days on market $549,900 Active 77 DOM
-
2026-06-08days on market $549,900 Active 76 DOM
-
2026-06-07days on market $549,900 Active 75 DOM
-
2026-06-05days on market $549,900 Active 72 DOM
-
2026-06-03days on market $549,900 Active 71 DOM
-
2026-06-02days on market $549,900 Active 70 DOM
-
2026-06-01days on market $549,900 Active 69 DOM
-
2026-05-31days on market $549,900 Active 68 DOM
-
2026-05-15historical Contingent 64-char remark
Show marketing remark (64 chars)
Duplex - both sides 3 bedroom. 528 has a bonus loft/office area.
-
2026-05-12price $549,900 64-char remark
Show marketing remark (64 chars)
Duplex - both sides 3 bedroom. 528 has a bonus loft/office area.
-
2026-03-24$579,900 Active 64-char remark
Show marketing remark (64 chars)
Duplex - both sides 3 bedroom. 528 has a bonus loft/office area.
-
2026-03-24historical
Show marketing remark (64 chars)
Duplex - both sides 3 bedroom. 528 has a bonus loft/office area.
-
2026-01-14price $599,900
-
2025-12-03$625,000 Active
-
2025-11-28historical
ⓘ Source: listings_history table (triggers on properties + properties_extension) + one-shot
backfill from property_details.listing_events for pre-trigger history.
Climate risk First Street
- Flood 6/10 Major FEMA zone X (unshaded) · 69% chance over 30 yrs
- Wildfire 1/10 Low
- Heat 4/10 Moderate 7 d/yr ≥100°F today · 18 d/yr by 30 yrs out
- Wind 2/10 Low 100% chance of damaging wind over 30 yrs
- Air quality 3/10 Moderate 2 unhealthy d/yr today · 4 by 30 yrs out
Nearby sold comps map
Loading sold comps map…
Walkable amenities ~0.75 mi
Loading nearby amenities…
Taxation est. · year 1
- Rental income
- $62,172
- − Mortgage interest
- −$30,803
- − Property taxes
- −$8,248
- − Insurance
- −$2,750
- − Repairs & maintenance
- −$4,974
- − Management
- −$4,974
- − Depreciation
- −$15,997
- Taxable loss
- −$5,574
- Est. tax savings @ 24.0%
- +$1,338
- After-tax cash flow
- $4,851/yr
For passive investors: Depreciation is non-cash, so a rental often shows a tax loss while cash-flowing — sheltering income. Rental losses are passive: they offset passive income freely, and up to $25,000/yr can offset ordinary (W-2) income if you actively participate and your MAGI is under $100k (phasing out to $0 by $150k); unused losses carry forward. On sale, claimed depreciation is recaptured at up to 25%, and gains may owe capital-gains tax (a 1031 exchange can defer both). Figures are a year-1 estimate at your 24.0% rate — not tax advice; consult a CPA.
Condition & rehab AI · 12 photos
This property requires moderate renovations to improve its condition and increase its value. Key areas for improvement include painting, landscaping, and updating the kitchen and bathrooms.
Repairs flagged
- Minor kitchen cabinets — existing cabinetry
- Minor bathroom fixtures — existing fixtures
- Minor roof shingles — existing shingles
- Minor exterior siding — existing siding
- Minor interior walls — existing paint
- Minor windows — existing windows
- Minor HVAC system — existing heating and cooling systems
Value-add opportunities
- Both paint interior walls and trim — enhances curb appeal and interior aesthetics
- Both landscape and add curb appeal — enhances curb appeal and property value
- Both replace kitchen cabinets and countertops — modernizes kitchen and increases value
- Both replace bathroom fixtures and tiles — modernizes bathrooms and increases value
- Both replace roof shingles — extends roof life and enhances curb appeal
- Both replace exterior siding — enhances curb appeal and property value
- Both replace HVAC system — improves comfort and energy efficiency
Renovation cost estimate screening
| Repair item | Severity | Est. cost |
|---|---|---|
| kitchen cabinets · existing cabinetry | Minor | $500–3,000 |
| bathroom fixtures · existing fixtures | Minor | $500–3,000 |
| roof shingles · existing shingles | Minor | $500–3,000 |
| exterior siding · existing siding | Minor | $500–3,000 |
| interior walls · existing paint | Minor | $500–3,000 |
| windows · existing windows | Minor | $500–3,000 |
| HVAC system · existing heating and cooling systems | Minor | $500–3,000 |
| Total estimated repair cost · 7 items | $3,500–21,000 |
Value-add ROI direction
- Both paint interior walls and trim — enhances curb appeal and interior aesthetics ↑
- Both landscape and add curb appeal — enhances curb appeal and property value ↑
- Both replace kitchen cabinets and countertops — modernizes kitchen and increases value ↑
- Both replace bathroom fixtures and tiles — modernizes bathrooms and increases value ↑
- Both replace roof shingles — extends roof life and enhances curb appeal ↑
- Both replace exterior siding — enhances curb appeal and property value ↑
- Both replace HVAC system — improves comfort and energy efficiency ↑
ⓘ Cost ranges are severity-bucket heuristics (US national rule-of-thumb). Get contractor quotes + a written scope before underwriting a rehab budget.
Schools (NCES district)
- District
- Columbus City School District
- NCES district ID
- 3904380
- Math proficiency
- 15% ▼ -17.00%
- Reading proficiency
- 26% ▼ -12.00%
- Median HH income
- $38,483
- Composite
- 17.19/100
- National rank
- #9105
- State rank
- #626 of 656 in OH
Livability — Columbus
- Score
- 81/100
- State rank
- #97
- US rank
- #1491
Category grades
Schools grade is shown separately in the Schools card above.
Census & demographics
- Census place
- Columbus, OH
- County
- Franklin County · 1,351,780 people
- City population
- 612,189
- Metro
- Columbus, OH
- Population (ZIP)
- 34,322
- Household income
- $43,731
- Rent vs Own
- Severe rent burden
- 4913.0
Population outlook (Franklin County) Hauer SSP2
- Today (2025)
- 1,456,139 people
- By 2030
- 1,556,890 · +6.9%
- By 2040
- 1,757,349 · +20.7%
- By 2050
- 1,950,539 · +34.0%
- By 2075
- 2,376,171 · +63.2%
- By 2100
- 2,636,796 · +81.1%
Race, ethnicity, and origin ACS 2023
- Neighborhood character
- Predominantly White (68%)
- Race & ethnicity
- White 68% Black 14% Two or more races 8% Asian 7% Hispanic / Latino 5%
- Hispanic origin (detail)
- Mexican 1% Puerto Rican 1%
- Common ancestry
- Romanian 4% Lithuanian 2% Italian 2%
- Foreign-born
- 8% · Canada, China, Jamaica
- Languages at home
- 90% English-only · Chinese 3% Spanish 2% Other Indo-European 2%
Political lean MEDSL · Franklin
- 2024 margin
- Strong D (+28.4) · D 63.7% · R 35.3% · Other 1.0%
- 2008→2024 swing
- +7.7pp toward D · 2008: 20.7pp · 2024: 28.4pp
- All cycles
- 2024: D+28.4 2020: D+31.4 2016: D+25.9 2012: D+21.7 2008: D+20.7
Not yet ingested
- Civics
- —
Market trends
- HPI YoY
- ▼ -207.90%
- Current HPI
- 321.7282
- Rent YoY
- ▲ 2.14%
- Metro
- Columbus, OH
- State GDP YoY
- ▲ 1.98%
- F500 in state
- 48
Industry mix (Fortune 500 HQ in OH)
| Industry | F500 HQs | Revenue |
|---|---|---|
| Insurance | 3 | $145B |
|
||
| Industrial Machinery | 3 | $49B |
|
||
| Financial Services | 3 | $24B |
|
||
| Consumer Goods | 2 | $93B |
|
||
| Aerospace / Defense | 2 | $47B |
|
||
| Utilities | 2 | $33B |
|
||
Price history
-12.0% since first listed7 events — show timeline
- 2026-05-15 Contingent — CBRMLS
- 2026-05-12 Price Changed $549,900 CBRMLS
- 2026-03-24 Listing Removed — CBRMLS
- 2026-03-24 Listed $579,900 CBRMLS
- 2026-01-14 Price Changed $599,900 CBRMLS
- 2025-12-03 Listed $625,000 CBRMLS
- 2025-11-28 Coming Soon — CBRMLS
Cash-flow waterfall
monthlySold comps — $/sqft
last 12 mo · ≤1 miLoading sold comps…