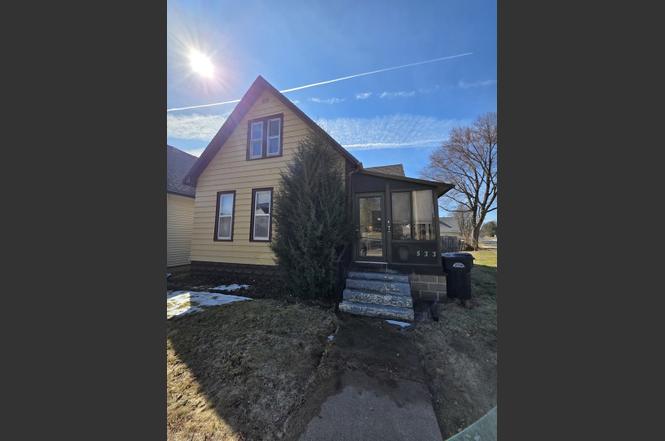
533 6th Ave N · Clinton, IA
Flood risk 1/10 · Minimal
- FEMA flood zone
- X (unshaded)
- Chance of flooding over 30 yrs
- 0.0%
- Est. flood insurance / yr
- $473 – $860
Fire risk 1/10 · Minimal
- Est. fire insurance / yr
- $902 – $1,676
Heat risk 3/10 · Minor
- Hot days now (above 103°F)
- 7 days/yr
- Hot days in 30 yrs
- 16 days/yr
Wind risk 2/10 · Minimal
- Chance of severe wind over 30 yrs
- —
Air-quality risk 3/10 · Minor
- Unhealthy air days now
- 2 days/yr
- Unhealthy air days in 30 yrs
- 3 days/yr
Risk factors via First Street. Map © Google.
Why this score? — see what drove the B grade
The composite is a weighted blend of 9 inputs, each scored 0–100. Each bar is that input's sub-score; the figure is the points it added to the 100-point composite (weight × sub-score).
- Cash flow +30.0/30.0
- 1% rule +10.0/10.0
- DSCR +10.0/10.0
- ARV discount +7.5/15.0
- Schools +4.5/10.0
- Livability +3.8/5.0
- Rent growth +2.5/5.0
- Condition / age +2.5/5.0
- Appreciation +0.0/10.0
$59,900
🖨 Deal sheet 📄 Offer letter ✓ Due diligence
Listing remarks
This 1 bedroom ranch home offers main floor living with large dining/kitchen, living room, bedroom, enclosed porch, and office that could be converted to a 2nd bedroom and a possible attic finish. this is strictly being sold as-is. Only electric is on. No others utilities will be on.
Key facts
- 3,135 sq ft lot
- Garage
- Built 1900
Property features AI
Finance
- Other: Ownership: Fee simple
- Financial info: No special service area
Exterior
- Parking: Detached garage (1 garage space, 1 total parking space)
- Utilities: Public water; Public sewer; Electric with circuit breakers
- Home design: Detached single-family home; 1.5-story; Over 100 years old; Not attached
- Construction: Frame construction with aluminum siding; Block foundation; Built before 1978
- Exterior features: Corner, level lot; Lot dimensions approximately 33 x 95
Interior
- Kitchen: Range; Refrigerator
- Bedrooms: 1 bedroom
- Bathrooms: 1 full bathroom
- Heating & cooling: Forced air heating (natural gas); Central air conditioning
- Interior features: Partial unfinished basement with egress window
Neighborhood map
What this means for you Summary
Snapshot
- This is a 2-bed/1.0-bath single-family listed at $60k.
Deal economics
- At list price, monthly cash flow is $549 ($7k/yr) — positive.
- The deal already cash-flows at list — no discount required.
- Meets the 1% rule at list price ($1k rent vs $60k).
- Recommended offer: $55k (9.0% below list) — sets the bar for market timing.
- Cap rate 17.3% vs local median 6.7% in Clinton — top-decile yield for the area; either an underpriced asset or a hidden risk that comps aren't pricing in. Stress-test before assuming the spread holds.
Location & tenants
- Location reads 75/100 on livability (#222 in IA, #4,192 nationally) — a middle-class / working-renter tenant base. Strengths: cost of living A+, housing A+, health & safety A+; Watch: amenities C-, crime D, employment D.
- Clinton Community School District (town): math 52% / reading 56% proficiency, ranked #273 of 289 in IA (top 94%) — acceptable for families but not a draw, mixed tenant base, ~2y average lease.
- Market conditions: 246 active listings in the ZIP; 5 comparable units currently listed for rent nearby; rentals lingering (median 44d on market — plan ~5-8 weeks vacancy on turnover, expect pricing pressure); 100% of comp listings sitting > 30 days — soft ceiling on asking rent; 116 units permitted in Clinton County in 2024 (50 in 5+ unit buildings).
Forward outlook
- Local home prices are declining (-3.0%/yr); year-one equity from $414 of loan paydown is wiped out by about $2k of value loss. Plan a longer hold.
- Clinton County population projected at -19% by 2050 — secular population decline; favor cash flow + early exit over multi-decade hold.
- At projected returns (-3.0% appreciation + 3.0% rent growth), your $17k cash investment doubles in ~3 years — after that, you're playing with house money.
Negotiation context
- It's been on market 117 days — a 9% lower offer ($55k) is reasonable based on typical stale-listing flexibility.
- 3 sale attempts with the ask held roughly flat each time — persistent listings suggest the price (not the market) is what's stuck; bring a comps-based counter.
Risks & watch-outs
- Watch-outs: built in 1900 — expect roof / HVAC / electrical / plumbing capex.
Questions for the listing agent
- It's been on market 117 days. Have you received any prior offers? Is the seller open to a 9% concession, seller financing, or rate buy-down credit?
- Built in 1900 — when were the roof, HVAC, electrical panel, plumbing, and water heater last replaced?
- Why hasn't it sold? Are there any deal-killer items the seller is aware of (foundation, flood, title, zoning, code violations)?
- Is there a deadline driving the sale (1031 exchange, divorce, estate, relocation)? That informs how much negotiation room exists.
- Schools are B-rated — typically a magnet for longer-tenancy family renters. What's the average tenant stay here, and is there a school-zone premium baked into asking?
- Crime grade is D in this area — have there been break-ins, vandalism, or insurance claims at this property in the last 3 years? What carrier currently insures it and at what premium?
- What's the average days-on-market for RENTAL listings here right now (not sales)? A rising rental-DOM trend means longer vacancies and softer asking-rent achievability than the comps imply.
- What's the recent tenant-quality profile in this submarket — average credit score on applications, eviction rate, late-payment / NSF rate, and stable-employment percentage? A property-management company in the area should have these aggregated.
- How much new for-sale + rental construction is in the pipeline within 1–3 miles? Heavy new supply typically softens prices + rents 12–24 months out; constrained supply supports both.
Investment metrics
- 1% rule
- 1.99% ✓
- Cap rate
- 17.29%
- Cash-on-cash
- 39.26%
- DSCR
- 2.75
- GRM
- 4.2
CMA / ARV
- ARV (on-the-fly)
- $128,154
- Comps found
- 12
Show comp detail 12 sales within ~0.75 mi
| Address | Dist | Beds/Ba | Sqft | Sold | Price | $/sf | Match |
|---|---|---|---|---|---|---|---|
| 317 7th Ave N | 0.30mi | 2/1.0 | 1,361 (-1%) | 13mo | $100,000 | $73 | 73 |
| 516 5th Ave N | 0.05mi | 3/1.0 (+1) | 1,190 (-14%) | 0mo | $80,000 | $67 | 69 |
| 337 4th Ave N | 0.28mi | 2/1.0 | 1,200 (-13%) | 2mo | $118,000 | $98 | 64 |
| 414 N 3rd Ave Ave | 0.23mi | 3/1.5 (+1) | 1,527 (+11%) | 4mo | $85,000 | $56 | 61 |
| 920 5th Ave N | 0.58mi | 3/2.0 (+1) | 1,416 (+3%) | 3mo | $168,000 | $119 | 56 |
| 545 3rd Ave S | 0.56mi | 2/1.0 | 1,245 (-10%) | 2mo | $74,900 | $60 | 56 |
| 430 N 6th Ave | 0.12mi | 2/1.0 | 1,200 (-13%) | 21mo | $112,000 | $93 | 55 |
| 512 2nd Ave S | 0.45mi | 3/2.0 (+1) | 1,356 (-2%) | 18mo | $69,000 | $51 | 52 |
| 1334 7th St NW | 0.65mi | 3/2.0 (+1) | 1,470 (+7%) | 0mo | $225,000 | $153 | 49 |
| 218 Adams Pl | 0.35mi | 2/1.0 | 1,538 (+12%) | 21mo | $89,900 | $58 | 47 |
| 1121 N 4th St | 0.56mi | 2/1.0 | 1,181 (-14%) | 6mo | $132,500 | $112 | 45 |
| 1201 N 4th St | 0.61mi | 2/1.0 | 1,226 (-11%) | 19mo | $145,000 | $118 | 38 |
Match score weights: distance 35% · size 25% · config 20% · recency 20%. Top-matched comps best support the ARV.
Projected returns pro-forma
-3.0% appreciation · 3.0% rent growth · sell at horizon
- IRR
- 35.5%
- Equity multiple
- 2.51×
- Total profit
- $25,247
- Equity at exit
- $8,931
- IRR
- 42.3%
- Equity multiple
- 5.00×
- Total profit
- $67,009
- Equity at exit
- $5,179
Cash invested: $16,772 (down + closing). Projections, not guarantees.
Landlord ↔ Tenant lean methodology
- Overall (STATE)
- 83 Strongly Landlord-Friendly
- State Iowa
- 83 Strongly Landlord-Friendly · R+6
- County
- — inherits STATE
- City
- — inherits STATE
ZIP-level market 52732
- Home prices YoY
- -34.9%
- Active inventory
- 246
- Price-to-rent
- 4.2×
Monthly cashflow live
- Estimated rent
- $1,193 high interval (Pro) →
- Mortgage (P&I)
- −$314
- Tax from tax record
- −$55 /mo · $656/yr
- Insurance
- −$25
- HOA
- −$0
- Vacancy / Maint / Mgmt
- −$251
- Net cashflow
- $549
Break-even live
UW: 25.0% down · 7.5% · 30yr · 1.5% tax · 5.0% vac · 8.0% maint · 8.0% mgmt
Financing live
Cash to close
- Down payment
- $14,975
- Closing costs
- $1,797
- Reserves months
- —
- Total cash needed
- —
Loan-product check · same deal, 3 products live
Conventional
25% down · 7.5% · 30yr
- Down + closing
- —
- Monthly P&I
- —
- Monthly cashflow
- —
- DSCR
- —
- Eligible?
- —
Personal DTI + credit; lowest rate.
DSCR
20% down · 8.5% · 30yr
- Down + closing
- —
- Monthly P&I
- —
- Monthly cashflow
- —
- DSCR
- —
- Eligible?
- —
No personal income docs; deal must DSCR.
Hard money
10% down · 12.0% · 12mo
- Down + closing
- —
- Monthly P&I
- —
- Monthly cashflow
- —
- DSCR
- —
- Eligible?
- —
Short-term bridge; refi at stabilization.
Rent comps 5 comps
| Address | Beds | Baths | Sqft | Rent | $/sqft | DOM | Units | Dist |
|---|---|---|---|---|---|---|---|---|
| 516 2nd Ave S Unit 2 Clinton, IA | 2.0 | 1.0 | 1082 | $750 | $0.69 | 43d | 1 | 0.43mi |
| 1002 S 4th St Clinton, IA | 3.0 | 2.5 | 1467 | $1,750 | $1.19 | 43d | 1 | 1.11mi |
| 1004 S 4th St Clinton, IA | 3.0 | 2.5 | 1467 | $1,700 | $1.16 | 43d | 1 | 1.11mi |
| 1006 S 4th St Clinton, IA | 3.0 | 2.5 | 1467 | $1,700 | $1.16 | 43d | 1 | 1.12mi |
| 1008 S 4th St Clinton, IA | 3.0 | 2.5 | 1467 | $1,750 | $1.19 | 43d | 1 | 1.12mi |
Listing history 14 events
-
2026-05-22$59,900 Active
-
2026-05-22price $59,900
-
2026-05-11soldstatus Closed
-
2026-04-14status Pending
-
2026-03-20price $44,900
-
2026-02-03price $49,900
-
2026-01-16price $54,900
-
2026-01-15status Active
-
2026-01-14historical
-
2026-01-06historical
-
2025-12-15Active
-
2021-08-07historical
-
2021-08-06historical
-
2020-08-30historical
ⓘ Source: listings_history table (triggers on properties + properties_extension) + one-shot
backfill from property_details.listing_events for pre-trigger history.
Tax reassessment forecast IA · Partial reset (capped growth)
- Current annual tax
- $656 · $55/mo
- Projected year-2 tax
- $798 · $67/mo
- Expected delta
- +$142/yr (+$12/mo · 21.7%)
ⓘ Screening estimate from a state-policy table — verify with the county assessor before closing.
Climate risk First Street
- Flood 1/10 Low FEMA zone X (unshaded) · 0% chance over 30 yrs
- Wildfire 1/10 Low
- Heat 3/10 Moderate 7 d/yr ≥103°F today · 16 d/yr by 30 yrs out
- Wind 2/10 Low
- Air quality 3/10 Moderate 2 unhealthy d/yr today · 3 by 30 yrs out
Nearby sold comps map
Loading sold comps map…
Walkable amenities ~0.75 mi
Loading nearby amenities…
Taxation est. · year 1
- Rental income
- $14,316
- − Mortgage interest
- −$3,355
- − Property taxes
- −$656
- − Insurance
- −$300
- − Repairs & maintenance
- −$1,145
- − Management
- −$1,145
- − Depreciation
- −$1,743
- Taxable income
- $5,972
- Est. tax owed @ 24.0%
- −$1,433
- After-tax cash flow
- $5,151/yr
For passive investors: Depreciation is non-cash, so a rental often shows a tax loss while cash-flowing — sheltering income. Rental losses are passive: they offset passive income freely, and up to $25,000/yr can offset ordinary (W-2) income if you actively participate and your MAGI is under $100k (phasing out to $0 by $150k); unused losses carry forward. On sale, claimed depreciation is recaptured at up to 25%, and gains may owe capital-gains tax (a 1031 exchange can defer both). Figures are a year-1 estimate at your 24.0% rate — not tax advice; consult a CPA.
Schools (NCES district)
- District
- Clinton Community School District
- NCES district ID
- 1907710
- Math proficiency
- 52% ▼ -13.00%
- Reading proficiency
- 56% ▼ -8.00%
- Median HH income
- $40,900
- Composite
- 45.22/100
- National rank
- #2666
- State rank
- #273 of 289 in IA
Livability — Clinton
- Score
- 75/100
- State rank
- #222
- US rank
- #4192
Category grades
Schools grade is shown separately in the Schools card above.
Census & demographics
- Census place
- Clinton, IA
- County
- Clinton County · 25,880 people
- City population
- 25,880
- Metro
- Clinton, IA
- Population (ZIP)
- 25,880
- Household income
- $61,105
- Rent vs Own
- Severe rent burden
- 889.0
Population outlook (Clinton County) Hauer SSP2
- Today (2025)
- 44,817 people
- By 2030
- 43,090 · -3.9%
- By 2040
- 39,513 · -11.8%
- By 2050
- 36,209 · -19.2%
- By 2075
- 31,888 · -28.8%
- By 2100
- 30,382 · -32.2%
Race, ethnicity, and origin ACS 2023
- Neighborhood character
- Predominantly White (86%)
- Race & ethnicity
- White 86% Two or more races 7% Hispanic / Latino 5% Black 4%
- Common ancestry
- Iranian 4% Portuguese 2% Lithuanian 2%
- Foreign-born
- 2% · Canada
- Languages at home
- 97% English-only · Spanish 2% Arabic 1%
Political lean MEDSL · Clinton
- 2024 margin
- R (+18.9) · D 39.8% · R 58.6% · Other 1.6%
- 2008→2024 swing
- -41.9pp toward R · 2008: 23.0pp · 2024: -18.9pp
- All cycles
- 2024: R+18.9 2020: R+10.3 2016: R+5.1 2012: D+22.9 2008: D+23.0
Not yet ingested
- Civics
- —
Market trends
- HPI YoY
- ▼ -83.23%
- Current HPI
- 155.3426
- Rent YoY
- —
- Metro
- Clinton, IA
- State GDP YoY
- ▲ 2.48%
- F500 in state
- 4
Industry mix (Fortune 500 HQ in IA)
| Industry | F500 HQs | Revenue |
|---|---|---|
| Financial Services | 1 | $16B |
|
||
| Retail / Convenience | 1 | $15B |
|
||
Price history
+9.1% since first listed14 events — show timeline
- 2026-05-22 Listed $59,900 MRED as Distributed by MLS Grid
- 2026-05-22 Price Changed $59,900 MRED as Distributed by MLS Grid
- 2026-05-11 Sold (MLS) — MRED as Distributed by MLS Grid
- 2026-04-14 Pending — MRED as Distributed by MLS Grid
- 2026-03-20 Price Changed $44,900 MRED as Distributed by MLS Grid
- 2026-02-03 Price Changed $49,900 MRED as Distributed by MLS Grid
- 2026-01-16 Price Changed $54,900 MRED as Distributed by MLS Grid
- 2026-01-15 Relisted — MRED as Distributed by MLS Grid
- 2026-01-14 Listing Removed — MRED as Distributed by MLS Grid
- 2026-01-06 Listing Removed — RMLSA as Distributed by MLS Grid
- 2025-12-15 Listed — RMLSA as Distributed by MLS Grid
- 2021-08-07 Listing Removed — RMLSA as Distributed by MLS Grid
- 2021-08-06 Listing Removed — RMLSA as Distributed by MLS Grid
- 2020-08-30 Listing Removed — MRED as Distributed by MLS Grid
Property tax history
-4.0%/yrLatest (2025): $656 · -10.9% YoY. Source: county tax records.
Cash-flow waterfall
monthlySold comps — $/sqft
last 12 mo · ≤1 miLoading sold comps…