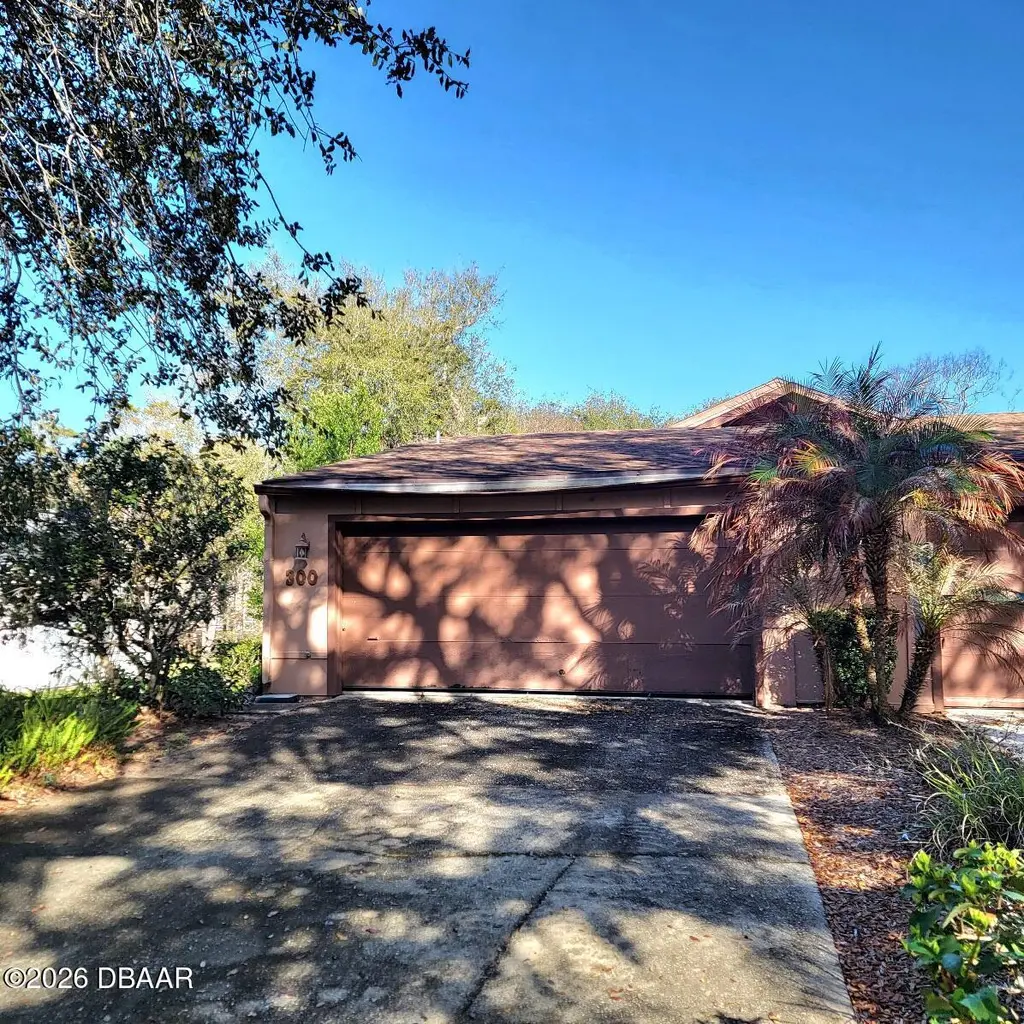
300 Timberline Trl · Ormond Beach, FL
Flood risk 1/10 · Minimal
- FEMA flood zone
- X (unshaded)
- Chance of flooding over 30 yrs
- 0.0%
- Est. flood insurance / yr
- $507 – $1,088
Fire risk 4/10 · Minor
- Est. fire insurance / yr
- $947 – $1,759
Heat risk 9/10 · Severe
- Hot days now (above 105°F)
- 7 days/yr
- Hot days in 30 yrs
- 20 days/yr
Wind risk 10/10 · Severe
- Chance of severe wind over 30 yrs
- 99.0%
Air-quality risk 3/10 · Minor
- Unhealthy air days now
- 3 days/yr
- Unhealthy air days in 30 yrs
- 3 days/yr
Risk factors via First Street. Map © Google.
Why this score? — see what drove the C grade
The composite is a weighted blend of 9 inputs, each scored 0–100. Each bar is that input's sub-score; the figure is the points it added to the 100-point composite (weight × sub-score).
- Cash flow +20.7/30.0
- ARV discount +7.5/15.0
- 1% rule +7.4/10.0
- DSCR +6.6/10.0
- Livability +4.2/5.0
- Schools +3.9/10.0
- Rent growth +2.9/5.0
- Condition / age +2.5/5.0
- Appreciation +0.0/10.0
$160,900
🖨 Deal sheet 📄 Offer letter ✓ Due diligence
Listing remarks MLS
A true diamond in the rough, this two bedroom two bath townhome in the trails is ready for your vision. Owner's sweat features a full private bathroom, toilet closet, walk in closet. Split plan, attached two car garage complete with laundry hook up. Stop and check this one out before it's gone.
Key facts
- Attached garage
- Private bathroom
- Walk in closet
Tags
Neighborhood map
What this means for you Summary
Snapshot
- This is a 2-bed/2.0-bath single-family listed at $161k.
Deal economics
- At list price, monthly cash flow is $218 ($3k/yr) — positive.
- The deal already cash-flows at list — no discount required.
- Meets the 1% rule at list price ($2k rent vs $161k).
- Recommended offer: $146k (9.0% below list) — sets the bar for market timing.
- Cap rate 7.9% vs local median 3.9% in Ormond Beach — top-decile yield for the area; either an underpriced asset or a hidden risk that comps aren't pricing in. Stress-test before assuming the spread holds.
Location & tenants
- Location reads 83/100 on livability (#55 in FL, #965 nationally) — a professional / high-income tenant draw. Strengths: amenities A+, housing A+, health & safety A+; Watch: commute F.
- Volusia (suburban): math 44% / reading 49% proficiency, ranked #47 of 73 in FL (top 64%) — families likely to look elsewhere, expect single-tenant / working-renter base with shorter leases.
- Market conditions: Rents rising (+1.6%/yr); 985 active listings in the ZIP; 9 comparable units currently listed for rent nearby; rentals at typical pace (median 19d on market — plan ~3-4 weeks tenant-placement turnaround); 3,402 units permitted in Volusia County in 2024 (681 in 5+ unit buildings).
- This rent runs 34% of the median local income ($71k/yr) — at the standard rent-burdened threshold; future hikes will face affordability resistance.
Forward outlook
- Local home prices are declining (-3.0%/yr); year-one equity from $1k of loan paydown is wiped out by about $5k of value loss. Plan a longer hold.
- Volusia County population projected at +19% by 2050 — long-run rental-demand tailwind backs the buy-and-hold thesis.
Negotiation context
- It's been on market 106 days — a 9% lower offer ($146k) is reasonable based on typical stale-listing flexibility.
- 2 sale attempts; this cycle's ask has dropped $43k (21%) from the opening price — seller is motivated, your offer sets the floor, not the list.
- Current owner paid $90k; list at $161k implies a 79% gain — meaningful room to come down on a strong offer.
Risks & watch-outs
- Climate carrying-cost: severe wind risk, 99% chance of damaging wind over 30y; extreme-heat days projected 7→20/yr by 2055 (HVAC capex compounding) — expect insurance premiums to compound above CPI over the hold.
Questions for the listing agent
- It's been on market 106 days. Have you received any prior offers? Is the seller open to a 9% concession, seller financing, or rate buy-down credit?
- Built in 1977 — when were the roof, HVAC, electrical panel, plumbing, and water heater last replaced?
- What does the HOA fee cover, when was the last increase, and are there any pending special assessments or reserve-fund shortfalls?
- Why hasn't it sold? Are there any deal-killer items the seller is aware of (foundation, flood, title, zoning, code violations)?
- Is there a deadline driving the sale (1031 exchange, divorce, estate, relocation)? That informs how much negotiation room exists.
- Schools are B-rated — typically a magnet for longer-tenancy family renters. What's the average tenant stay here, and is there a school-zone premium baked into asking?
- What's the average days-on-market for RENTAL listings here right now (not sales)? A rising rental-DOM trend means longer vacancies and softer asking-rent achievability than the comps imply.
- What's the recent tenant-quality profile in this submarket — average credit score on applications, eviction rate, late-payment / NSF rate, and stable-employment percentage? A property-management company in the area should have these aggregated.
- How much new for-sale + rental construction is in the pipeline within 1–3 miles? Heavy new supply typically softens prices + rents 12–24 months out; constrained supply supports both.
Investment metrics
- 1% rule
- 1.24% ✓
- Cap rate
- 7.92%
- Cash-on-cash
- 5.79%
- DSCR
- 1.26
- GRM
- 6.7
CMA / ARV
No comps found within radius.
Projected returns pro-forma
-3.0% appreciation · 1.64% rent growth · sell at horizon
- IRR
- -9.1%
- Equity multiple
- 0.67×
- Total profit
- $-14,725
- Equity at exit
- $23,991
- IRR
- -1.7%
- Equity multiple
- 0.89×
- Total profit
- $-4,979
- Equity at exit
- $13,912
Cash invested: $45,052 (down + closing). Projections, not guarantees.
Landlord ↔ Tenant lean methodology
- Overall (STATE)
- 87 Strongly Landlord-Friendly
- State Florida
- 87 Strongly Landlord-Friendly · R+3
- County
- — inherits STATE
- City
- — inherits STATE
ZIP-level market 32174
- Rents YoY
- 1.6%
- Active inventory
- 985
- Price-to-rent
- 6.7×
Monthly cashflow live
- Estimated rent
- $1,989 high interval (Pro) →
- Mortgage (P&I)
- −$844
- Tax from tax record
- −$263 /mo · $3,158/yr
- Insurance
- −$67
- HOA
- −$180
- Vacancy / Maint / Mgmt
- −$418
- Net cashflow
- $218
Break-even live
UW: 25.0% down · 7.5% · 30yr · 1.5% tax · 5.0% vac · 8.0% maint · 8.0% mgmt
Financing live
Cash to close
- Down payment
- $40,225
- Closing costs
- $4,827
- Reserves months
- —
- Total cash needed
- —
Loan-product check · same deal, 3 products live
Conventional
25% down · 7.5% · 30yr
- Down + closing
- —
- Monthly P&I
- —
- Monthly cashflow
- —
- DSCR
- —
- Eligible?
- —
Personal DTI + credit; lowest rate.
DSCR
20% down · 8.5% · 30yr
- Down + closing
- —
- Monthly P&I
- —
- Monthly cashflow
- —
- DSCR
- —
- Eligible?
- —
No personal income docs; deal must DSCR.
Hard money
10% down · 12.0% · 12mo
- Down + closing
- —
- Monthly P&I
- —
- Monthly cashflow
- —
- DSCR
- —
- Eligible?
- —
Short-term bridge; refi at stabilization.
Rent comps 9 comps
| Address | Beds | Baths | Sqft | Rent | $/sqft | DOM | Units | Dist |
|---|---|---|---|---|---|---|---|---|
| 7 Stone Haven Trl Ormond Beach, FL | 3.0 | 2.0 | 1678 | $2,200 | $1.31 | 19d | 1 | 0.15mi |
| 162 Pine Cone Trl Ormond Beach, FL | 3.0 | 2.0 | 1555 | $2,100 | $1.35 | 14d | 1 | 0.22mi |
| 35 Magnolia Ave Unit 35 Ormond Beach, FL | 2.0 | 2.0 | 1300 | $1,800 | $1.38 | 23d | 1 | 0.43mi |
| 3 Glen Arbor Park Ormond Beach, FL | 2.0 | 1.5 | 1200 | $1,700 | $1.42 | 23d | 1 | 0.49mi |
| 500 Shadow Lakes Blvd Ormond Beach, FL | 1.0–2.0 | 1.0–2.0 | 856 | $1,645 | $1.92 | 11d | 15 | 0.54mi |
| 51 Brookwood Dr Ormond Beach, FL | 3.0 | 2.0 | 1791 | $2,100 | $1.17 | 23d | 1 | 0.61mi |
| 67 Brookwood Dr Ormond Beach, FL | 3.0 | 2.0 | 1602 | $2,500 | $1.56 | 23d | 1 | 0.67mi |
| 1088 W Granada Blvd Ormond Beach, FL | 1.0–2.0 | 1.0–2.0 | 950 | $1,570 | $1.65 | 11d | 8 | 0.85mi |
| 450 Tomoka Ave Unit 215 Ormond Beach, FL | 2.0 | 1.5 | 1150 | $1,750 | $1.52 | 14d | 1 | 1.28mi |
HOA detail
- Monthly dues
- $180 · $2,160/yr
Listing history 23 events
-
2026-06-18price $160,900 Active 106 DOM
-
2026-06-18days on market $172,900 Active 106 DOM
-
2026-06-17days on market $172,900 Active 105 DOM
-
2026-06-16days on market $172,900 Active 104 DOM
-
2026-06-15days on market $172,900 Active 103 DOM
-
2026-06-14days on market $172,900 Active 101 DOM
-
2026-06-10days on market $172,900 Active 98 DOM
-
2026-06-09days on market $172,900 Active 97 DOM
-
2026-06-08days on market $172,900 Active 96 DOM
-
2026-06-07days on market $172,900 Active 95 DOM
-
2026-06-05days on market $172,900 Active 92 DOM
-
2026-06-03days on market $172,900 Active 91 DOM
-
2026-06-03days on market $172,900 Active 90 DOM
-
2026-06-01days on market $172,900 Active 89 DOM
-
2026-05-31days on market $172,900 Active 88 DOM
-
2026-05-31days on market $172,900 Active 87 DOM
-
2026-04-23price $187,700 295-char remark
Show marketing remark (295 chars)
A true diamond in the rough, this two bedroom two bath townhome in the trails is ready for your vision. Owner's sweat features a full private bathroom, toilet closet, walk in closet. Split plan, attached two car garage complete with laundry hook up. Stop and check this one out before it's gone.
-
2026-03-03$204,000 Active 295-char remark
Show marketing remark (295 chars)
A true diamond in the rough, this two bedroom two bath townhome in the trails is ready for your vision. Owner's sweat features a full private bathroom, toilet closet, walk in closet. Split plan, attached two car garage complete with laundry hook up. Stop and check this one out before it's gone.
-
2025-04-09historical
-
2025-04-07$125,000 Active
-
1998-12-30soldstatus $90,000
-
1983-11-01soldstatus $56,888
-
1981-04-01soldstatus $55,500
ⓘ Source: listings_history table (triggers on properties + properties_extension) + one-shot
backfill from property_details.listing_events for pre-trigger history.
Tax reassessment forecast FL · Resets to sale price
- Current annual tax
- $3,158 · $263/mo
- Projected year-2 tax
- $3,158 · $263/mo
- Expected delta
- $0/yr ($0/mo · 0.0%)
ⓘ Screening estimate from a state-policy table — verify with the county assessor before closing.
Climate risk First Street
- Flood 1/10 Low FEMA zone X (unshaded) · 0% chance over 30 yrs
- Wildfire 4/10 Moderate
- Heat 9/10 Extreme 7 d/yr ≥105°F today · 20 d/yr by 30 yrs out
- Wind 10/10 Extreme 99% chance of damaging wind over 30 yrs
- Air quality 3/10 Moderate 3 unhealthy d/yr today · 3 by 30 yrs out
Nearby sold comps map
Loading sold comps map…
Walkable amenities ~0.75 mi
Loading nearby amenities…
Taxation est. · year 1
- Rental income
- $23,871
- − Mortgage interest
- −$9,013
- − Property taxes
- −$3,158
- − Insurance
- −$804
- − Repairs & maintenance
- −$1,910
- − Management
- −$1,910
- − HOA
- −$2,160
- − Depreciation
- −$4,681
- Taxable income
- $236
- Est. tax owed @ 24.0%
- −$57
- After-tax cash flow
- $2,554/yr
For passive investors: Depreciation is non-cash, so a rental often shows a tax loss while cash-flowing — sheltering income. Rental losses are passive: they offset passive income freely, and up to $25,000/yr can offset ordinary (W-2) income if you actively participate and your MAGI is under $100k (phasing out to $0 by $150k); unused losses carry forward. On sale, claimed depreciation is recaptured at up to 25%, and gains may owe capital-gains tax (a 1031 exchange can defer both). Figures are a year-1 estimate at your 24.0% rate — not tax advice; consult a CPA.
Schools (NCES district)
- District
- Volusia
- NCES district ID
- 1201920
- Math proficiency
- 44% ▼ -9.00%
- Reading proficiency
- 49% ▼ -3.00%
- Median HH income
- $42,946
- Composite
- 39.2/100
- National rank
- #4019
- State rank
- #47 of 73 in FL
Livability — Ormond Beach
- Score
- 83/100
- State rank
- #55
- US rank
- #965
Category grades
Schools grade is shown separately in the Schools card above.
Census & demographics
- Census place
- Ormond Beach, FL
- County
- Volusia County · 556,871 people
- City population
- 69,624
- Metro
- Deltona-Daytona Beach-Ormond Beach, FL
- Population (ZIP)
- 54,783
- Household income
- $71,011
- Rent vs Own
- Severe rent burden
- 1158.0
Population outlook (Volusia County) Hauer SSP2
- Today (2025)
- 572,749 people
- By 2030
- 598,695 · +4.5%
- By 2040
- 644,880 · +12.6%
- By 2050
- 681,451 · +19.0%
- By 2075
- 759,957 · +32.7%
- By 2100
- 778,902 · +36.0%
Race, ethnicity, and origin ACS 2023
- Neighborhood character
- Predominantly White (82%)
- Race & ethnicity
- White 82% Black 6% Hispanic / Latino 5% Two or more races 5% Asian 3%
- Hispanic origin (detail)
- Puerto Rican 2%
- Common ancestry
- Romanian 4% Lithuanian 3% Slovak 3%
- Foreign-born
- 7% · Canada, China
- Languages at home
- 91% English-only · Spanish 3% Other Indo-European 1% German/W. Germanic 1%
Political lean MEDSL · Volusia
- 2024 margin
- Strong R (+21.8) · D 38.7% · R 60.5%
- 2008→2024 swing
- -27.4pp toward R · 2008: 5.7pp · 2024: -21.8pp
- All cycles
- 2024: R+21.8 2020: R+14.1 2016: R+13.1 2012: R+1.2 2008: D+5.7
Not yet ingested
- Civics
- —
Market trends
- HPI YoY
- ▼ -327.97%
- Current HPI
- 271.92
- Rent YoY
- ▲ 1.64%
- Metro
- Deltona-Daytona Beach-Ormond Beach, FL
- State GDP YoY
- ▲ 3.28%
- F500 in state
- 36
Industry mix (Fortune 500 HQ in FL)
| Industry | F500 HQs | Revenue |
|---|---|---|
| Industrial Technology | 2 | $29B |
|
||
| Insurance | 2 | $17B |
|
||
| Retail | 1 | $60B |
|
||
| Technology Distribution | 1 | $58B |
|
||
| Homebuilding | 1 | $35B |
|
||
| Technology Manufacturing | 1 | $35B |
|
||
Price history
+238.2% since first listed7 events — show timeline
- 2026-04-23 Price Changed $187,700 Daytona MLS
- 2026-03-03 Listed $204,000 Daytona MLS
- 2025-04-09 Listing Removed — Stellar MLS as Distributed by MLS Grid
- 2025-04-07 Listed $125,000 Stellar MLS as Distributed by MLS Grid
- 1998-12-30 Sold (Public Records) $90,000 Public Records
- 1983-11-01 Sold (Public Records) $56,888 Public Records
- 1981-04-01 Sold (Public Records) $55,500 Public Records
Property tax history
+10.9%/yrLatest (2025): $3,158 · +2.7% YoY. Source: county tax records.
Cash-flow waterfall
monthlySold comps — $/sqft
last 12 mo · ≤1 miLoading sold comps…