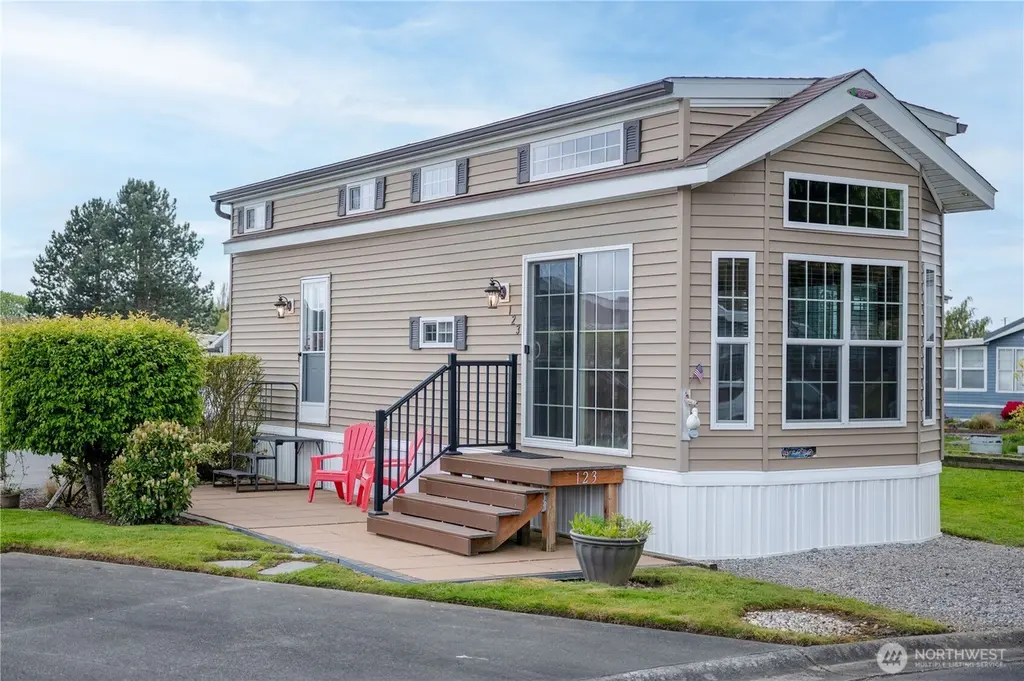
4751 Birch Bay Lynden Rd #123 · Birch Bay, WA
Flood risk 1/10 · Minimal
- FEMA flood zone
- X (unshaded)
- Chance of flooding over 30 yrs
- 0.0%
- Est. flood insurance / yr
- $507 – $1,088
Fire risk 1/10 · Minimal
- Est. fire insurance / yr
- $604 – $1,122
Heat risk 3/10 · Minor
- Hot days now (above 81°F)
- 8 days/yr
- Hot days in 30 yrs
- 20 days/yr
Wind risk 1/10 · Minimal
- Chance of severe wind over 30 yrs
- —
Air-quality risk 6/10 · Moderate
- Unhealthy air days now
- 7 days/yr
- Unhealthy air days in 30 yrs
- 10 days/yr
Risk factors via First Street. Map © Google.
Why this score? — see what drove the B- grade
The composite is a weighted blend of 9 inputs, each scored 0–100. Each bar is that input's sub-score; the figure is the points it added to the 100-point composite (weight × sub-score).
- Cash flow +22.0/30.0
- Appreciation +10.0/10.0
- DSCR +7.0/10.0
- ARV discount +6.3/15.0
- 1% rule +6.1/10.0
- Schools +4.7/10.0
- Rent growth +3.3/5.0
- Livability +3.1/5.0
- Condition / age +2.5/5.0
$174,900
🖨 Deal sheet 📄 Offer letter ✓ Due diligence
Listing remarks
Escape to your own coastal retreat in this light-filled, well-maintained home featuring vaulted ceilings and an inviting open-concept living, dining, and kitchen area—perfect for relaxing or entertaining. Stay cozy with the charming electric fireplace, creating the perfect ambiance on cooler coastal evenings. The main floor offers a comfortable bedroom, while upstairs includes a second bedroom plus a flexible den or sitting area that can easily serve as a third bedroom. Enjoy the ease of ample storage inside and out, including a convenient shed for all your beach essentials. Step onto the patio, breathe in the coastal air, and unwind after a day by the water. Located in the desirable
Key facts
- 4,356 sq ft lot
- 2 parking spots
- Community pool
Property features AI
Finance
- Other: Unit located in a community of 225 units; Building name: Latitude 49
- Financial info: Listing terms: Cash
- HOA & community: Monthly association fee of $135; HOA covers common area maintenance, road maintenance, security, snow removal and trash; Community amenities: athletic court, clubhouse, exercise room, game/rec room, hot tub, playground, outdoor pool, laundry room, gated entry, high-speed internet available, pool
Exterior
- Parking: Off-street parking (2 uncovered spaces)
- Security: Gated community; Security gate and security service
- Utilities: Electric and propane energy sources; Birch Bay Water & Sewer service; PSE power; Xfinity internet available
- Home design: Detached single-wide manufactured home; Two stories (one level listed as living levels); Main-level entry
- Construction: Metal/vinyl construction materials; Composition and torch-down roof
- Exterior features: Metal/vinyl exterior; Corner lot; Cul-de-sac location; Paved access; Unit-level view
Interior
- Kitchen: Microwave; Refrigerator; Stove/Range
- Bedrooms: 2 bedrooms (1 on main level, 1 on second level); Primary bedroom on main level
- Flooring: Vinyl; Carpet
- Bathrooms: One three-quarter bath (main level) with shower
- Heating & cooling: Forced-air heating; No central cooling
- Interior features: Gas cooking; Fireplace (electric); Vaulted ceilings; Den/office; Entry hall; Living room; Kitchen with eating space; Balcony/Deck/Patio; Yard
- Laundry & utility: Laundry room (community)
Neighborhood map
What this means for you Summary
Snapshot
- This is a 2-bed/1.0-bath condo listed at $175k.
Deal economics
- At list price, monthly cash flow is $278 ($3k/yr) — positive.
- The deal already cash-flows at list — no discount required.
- Meets the 1% rule at list price ($2k rent vs $175k).
- Recommended offer: $170k (3.0% below list) — sets the bar for market timing.
- Cap rate 8.2% vs local median 2.6% in Birch Bay — top-decile yield for the area; either an underpriced asset or a hidden risk that comps aren't pricing in. Stress-test before assuming the spread holds.
Location & tenants
- Location reads 62/100 on livability (#406 in WA) — a middle-class / working-renter tenant base. Strengths: housing A; Watch: cost of living D+, health & safety D, schools F.
- Blaine School District (town): math 49% / reading 55% proficiency, ranked #120 of 291 in WA (top 41%) — acceptable for families but not a draw, mixed tenant base, ~2y average lease.
- Market conditions: Rents rising (+3.1%/yr); 454 active listings in the ZIP; solid renter incomes; 1,190 units permitted in Whatcom County in 2024 (327 in 5+ unit buildings).
Forward outlook
- In year one you build about $19k of equity ($1k loan paydown + $17k appreciation (10.0% local appreciation)).
- Whatcom County population projected at +28% by 2050 — long-run rental-demand tailwind backs the buy-and-hold thesis.
- At projected returns (10.0% appreciation + 3.1% rent growth), your $49k cash investment doubles in ~3 years — after that, you're playing with house money.
- By year 2, paydown + projected appreciation supports a ~$30k cash-out refi (75% LTV) — recoverable capital for the next deal without selling this one.
Negotiation context
- It's been on market 44 days — a 3% lower offer ($170k) is reasonable based on typical stale-listing flexibility.
- 4 sale attempts since 12y ago with the ask held roughly flat each time — persistent listings suggest the price (not the market) is what's stuck; bring a comps-based counter.
- Current owner paid $110k; list at $175k implies a 59% gain — meaningful room to come down on a strong offer.
Questions for the listing agent
- It's been on market 44 days. Have you received any prior offers? Is the seller open to a 3% concession, seller financing, or rate buy-down credit?
- What does the HOA fee cover, when was the last increase, and are there any pending special assessments or reserve-fund shortfalls?
- Any open or pending special assessments — roof, HVAC, plumbing, elevator, façade? What's the per-unit balance and payoff schedule, and is the seller paying it off at close or rolling it to the buyer?
- Is there a deadline driving the sale (1031 exchange, divorce, estate, relocation)? That informs how much negotiation room exists.
- Schools are F-rated, which usually means shorter tenancies and higher turnover. Who's the typical renter profile here, and what's been the actual vacancy rate?
- What's the average days-on-market for RENTAL listings here right now (not sales)? A rising rental-DOM trend means longer vacancies and softer asking-rent achievability than the comps imply.
- What's the recent tenant-quality profile in this submarket — average credit score on applications, eviction rate, late-payment / NSF rate, and stable-employment percentage? A property-management company in the area should have these aggregated.
- How much new apartment / multifamily construction is in the pipeline within 1–3 miles? Heavy new supply (>2% of stock underway) typically softens rents 12–24 months out; light construction supports rent growth.
Investment metrics
- 1% rule
- 1.11% ✓
- Cap rate
- 8.20%
- Cash-on-cash
- 6.81%
- DSCR
- 1.30
- GRM
- 7.5
CMA / ARV
- ARV (median comp)
- $170,540
- List price
- $174,900
- Delta
- 2.56%
- Verdict
- FAIR
- Comps
- 20 within 1.0 mi
Projected returns pro-forma
10.0% appreciation · 3.1% rent growth · sell at horizon
- IRR
- 29.3%
- Equity multiple
- 3.31×
- Total profit
- $113,217
- Equity at exit
- $157,564
- IRR
- 25.5%
- Equity multiple
- 7.53×
- Total profit
- $319,989
- Equity at exit
- $339,792
Cash invested: $48,972 (down + closing). Projections, not guarantees.
Landlord ↔ Tenant lean methodology
- Overall (STATE)
- 28 Tenant-Leaning
- State Washington
- 28 Tenant-Leaning · D+8
- County
- — inherits STATE
- City
- — inherits STATE
ZIP-level market 98230
- Home prices YoY
- 14.0%
- Rents YoY
- 3.1%
- Active inventory
- 454
- Price-to-rent
- 7.5×
Monthly cashflow live
- Estimated rent
- $1,939 medium interval (Pro) →
- Mortgage (P&I)
- −$917
- Tax from tax record
- −$128 /mo · $1,541/yr
- Insurance
- −$73
- HOA
- −$135
- Vacancy / Maint / Mgmt
- −$407
- Net cashflow
- $278
Break-even live
UW: 25.0% down · 7.5% · 30yr · 1.5% tax · 5.0% vac · 8.0% maint · 8.0% mgmt
Financing live
Cash to close
- Down payment
- $43,725
- Closing costs
- $5,247
- Reserves months
- —
- Total cash needed
- —
Loan-product check · same deal, 3 products live
Conventional
25% down · 7.5% · 30yr
- Down + closing
- —
- Monthly P&I
- —
- Monthly cashflow
- —
- DSCR
- —
- Eligible?
- —
Personal DTI + credit; lowest rate.
DSCR
20% down · 8.5% · 30yr
- Down + closing
- —
- Monthly P&I
- —
- Monthly cashflow
- —
- DSCR
- —
- Eligible?
- —
No personal income docs; deal must DSCR.
Hard money
10% down · 12.0% · 12mo
- Down + closing
- —
- Monthly P&I
- —
- Monthly cashflow
- —
- DSCR
- —
- Eligible?
- —
Short-term bridge; refi at stabilization.
HOA detail condo
- Monthly dues
- $135 · $1,620/yr
- Likely covers
- waterelectric
- Assessments
- None detected in remarks — confirm with the listing agent.
Listing history 29 events
-
2026-06-18days on market $174,900 Active 44 DOM
-
2026-06-17days on market $174,900 Active 43 DOM
-
2026-06-16days on market $174,900 Active 42 DOM
-
2026-06-15days on market $174,900 Active 41 DOM
-
2026-06-14days on market $174,900 Active 39 DOM
-
2026-06-13days on market $174,900 Active 38 DOM
-
2026-06-10days on market $174,900 Active 36 DOM
-
2026-06-09days on market $174,900 Active 35 DOM
-
2026-06-08days on market $174,900 Active 34 DOM
-
2026-06-07days on market $174,900 Active 33 DOM
-
2026-06-05days on market $174,900 Active 30 DOM
-
2026-06-02days on market $174,900 Active 28 DOM
-
2026-06-01days on market $174,900 Active 27 DOM
-
2026-05-31days on market $174,900 Active 26 DOM
-
2026-05-30days on market $174,900 Active 25 DOM
-
2026-05-05$174,900 Active
-
2020-11-13soldstatus $110,000 Sold
-
2020-10-19status Pending
-
2020-10-13status Active
-
2020-10-02status Pending Inspection
-
2020-09-28price $115,500
-
2020-09-03price $119,500
-
2020-07-08price $129,500
-
2020-06-05$139,500 Active
-
2014-09-03soldstatus $40,000 Sold
-
2014-09-03soldstatus $40,000
-
2014-08-20status Pending
-
2014-07-02price $41,900
-
2014-06-04$44,000 Active
ⓘ Source: listings_history table (triggers on properties + properties_extension) + one-shot
backfill from property_details.listing_events for pre-trigger history.
Tax reassessment forecast WA · Resets to sale price
- Current annual tax
- $1,541 · $128/mo
- Projected year-2 tax
- $1,714 · $143/mo
- Expected delta
- +$173/yr (+$14/mo · 11.3%)
ⓘ Screening estimate from a state-policy table — verify with the county assessor before closing.
Climate risk First Street
- Flood 1/10 Low FEMA zone X (unshaded) · 0% chance over 30 yrs
- Wildfire 1/10 Low
- Heat 3/10 Moderate 8 d/yr ≥81°F today · 20 d/yr by 30 yrs out
- Wind 1/10 Low
- Air quality 6/10 Major 7 unhealthy d/yr today · 10 by 30 yrs out
Nearby sold comps map
Loading sold comps map…
Walkable amenities ~0.75 mi
Loading nearby amenities…
Taxation est. · year 1
- Rental income
- $23,264
- − Mortgage interest
- −$9,797
- − Property taxes
- −$1,541
- − Insurance
- −$874
- − Repairs & maintenance
- −$1,861
- − Management
- −$1,861
- − HOA
- −$1,620
- − Depreciation
- −$5,088
- Taxable income
- $621
- Est. tax owed @ 24.0%
- −$149
- After-tax cash flow
- $3,188/yr
For passive investors: Depreciation is non-cash, so a rental often shows a tax loss while cash-flowing — sheltering income. Rental losses are passive: they offset passive income freely, and up to $25,000/yr can offset ordinary (W-2) income if you actively participate and your MAGI is under $100k (phasing out to $0 by $150k); unused losses carry forward. On sale, claimed depreciation is recaptured at up to 25%, and gains may owe capital-gains tax (a 1031 exchange can defer both). Figures are a year-1 estimate at your 24.0% rate — not tax advice; consult a CPA.
Schools (NCES district)
- District
- Blaine School District
- NCES district ID
- 5300570
- Math proficiency
- 49% ▼ -1.00%
- Reading proficiency
- 55% ▼ -2.00%
- Median HH income
- $57,085
- Composite
- 47.05/100
- National rank
- #5128
- State rank
- #120 of 291 in WA
Livability — Birch Bay
- Score
- 62/100
- State rank
- #406
- US rank
- #16180
Category grades
Schools grade is shown separately in the Schools card above.
Census & demographics
- Census place
- Birch Bay, WA
- County
- Whatcom County · 209,776 people
- Metro
- Bellingham, WA
- Population (ZIP)
- 18,744
- Household income
- $86,623
- Rent vs Own
- Severe rent burden
- 454.0
Population outlook (Whatcom County) Hauer SSP2
- Today (2025)
- 240,408 people
- By 2030
- 254,667 · +5.9%
- By 2040
- 281,365 · +17.0%
- By 2050
- 307,592 · +27.9%
- By 2075
- 375,576 · +56.2%
- By 2100
- 421,637 · +75.4%
Race, ethnicity, and origin ACS 2023
- Neighborhood character
- Predominantly White (77%)
- Race & ethnicity
- White 77% Two or more races 11% Hispanic / Latino 9% Asian 3% Pacific Islander 2% Black 1%
- Hispanic origin (detail)
- Mexican 5%
- Common ancestry
- Portuguese 6% Iranian 4% Lithuanian 3%
- Foreign-born
- 13% · Canada, China
- Languages at home
- 89% English-only · Spanish 4% Russian/Polish/Slavic 1% Other Indo-European 1%
Political lean MEDSL · Whatcom
- 2024 margin
- Strong D (+24.9) · D 60.8% · R 35.9% · Other 3.3%
- 2008→2024 swing
- +6.9pp toward D · 2008: 18.0pp · 2024: 24.9pp
- All cycles
- 2024: D+24.9 2020: D+23.9 2016: D+17.7 2012: D+12.1 2008: D+18.0
Not yet ingested
- Civics
- —
Market trends
- HPI YoY
- ▲ 106.58%
- Current HPI
- 868.68
- Rent YoY
- ▲ 3.10%
- Metro
- Bellingham, WA
- State GDP YoY
- ▲ 4.65%
- F500 in state
- 22
Industry mix (Fortune 500 HQ in WA)
| Industry | F500 HQs | Revenue |
|---|---|---|
| Retail | 2 | $269B |
|
||
| Technology / Retail | 1 | $638B |
|
||
| Technology | 1 | $245B |
|
||
| Telecommunications | 1 | $38B |
|
||
| Food / Beverage | 1 | $36B |
|
||
| Automotive / Trucks | 1 | $34B |
|
||
Price history
+297.5% since first listed14 events — show timeline
- 2026-05-05 Listed $174,900 NWMLS as Distributed by MLS Grid
- 2020-11-13 Sold (MLS) $110,000 NWMLS as Distributed by MLS Grid
- 2020-10-19 Pending — NWMLS as Distributed by MLS Grid
- 2020-10-13 Relisted — NWMLS as Distributed by MLS Grid
- 2020-10-02 Pending — NWMLS as Distributed by MLS Grid
- 2020-09-28 Price Changed $115,500 NWMLS as Distributed by MLS Grid
- 2020-09-03 Price Changed $119,500 NWMLS as Distributed by MLS Grid
- 2020-07-08 Price Changed $129,500 NWMLS as Distributed by MLS Grid
- 2020-06-05 Listed $139,500 NWMLS as Distributed by MLS Grid
- 2014-09-03 Sold (Public Records) $40,000 Public Records
- 2014-09-03 Sold (MLS) $40,000 NWMLS as Distributed by MLS Grid
- 2014-08-20 Pending — NWMLS as Distributed by MLS Grid
- 2014-07-02 Price Changed $41,900 NWMLS as Distributed by MLS Grid
- 2014-06-04 Listed $44,000 NWMLS as Distributed by MLS Grid
Property tax history
+11.6%/yrLatest (2026): $1,541 · +3.2% YoY. Source: county tax records.
Cash-flow waterfall
monthlySold comps — $/sqft
last 12 mo · ≤1 miLoading sold comps…