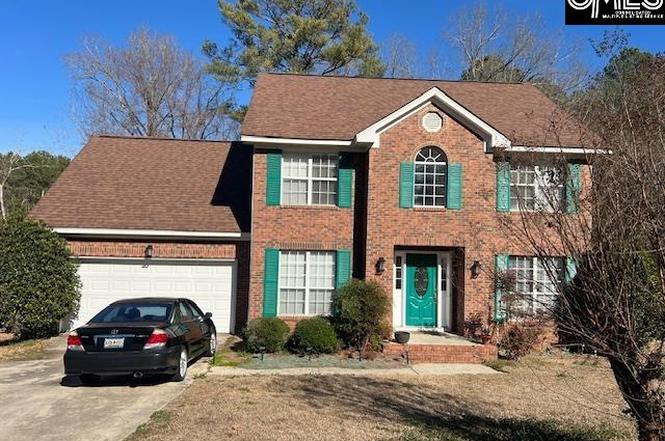
206 Beckworth Ln · Irmo, SC
Flood risk 7/10 · Major
- FEMA flood zone
- X
- Chance of flooding over 30 yrs
- 0.99%
- Est. flood insurance / yr
- $435 – $905
Fire risk 2/10 · Minimal
- Est. fire insurance / yr
- $783 – $1,453
Heat risk 7/10 · Major
- Hot days now (above threshold)
- 7 days/yr
- Hot days in 30 yrs
- 16 days/yr
Wind risk No data
- Chance of severe wind over 30 yrs
- —
Air-quality risk No data
- Unhealthy air days now
- —
- Unhealthy air days in 30 yrs
- —
Risk factors via First Street. Map © Google.
Why this score? — see what drove the D grade
The composite is a weighted blend of 9 inputs, each scored 0–100. Each bar is that input's sub-score; the figure is the points it added to the 100-point composite (weight × sub-score).
- Cash flow +14.7/30.0
- ARV discount +7.5/15.0
- DSCR +4.5/10.0
- Schools +4.5/10.0
- Livability +3.7/5.0
- 1% rule +3.2/10.0
- Rent growth +2.7/5.0
- Condition / age +2.5/5.0
- Appreciation +0.0/10.0
$289,900
🖨 Deal sheet (PDF) 📄 Offer letter ✓ Due diligence
Listing remarks
Well priced home in Ashford community. Great floor plan with formal DR area, office down. Finished room over the garage. Kitchen has upgrades and granite counters. Carpet needs upgrading but seller negotiable. Large fully fenced backyard. Disclaimer: CMLS has not reviewed and, therefore, does not endorse vendors who may appear in listings.
Key facts
- Upgrades
- Ashford community
- Granite counters
Tags
Property features AI
Finance
- Other: Paved road access
- HOA & community: Community association with clubhouse, playground, pool, and tennis courts; association maintains common areas
Exterior
- Parking: Attached garage with 2 spaces
- Utilities: Public water; Public sewer
- Home design: Two-story home
- Construction: Partial brick above foundation exterior; Crawlspace foundation
- Exterior features: Rear wood privacy fence; Deck
Interior
- Kitchen: Kitchen on main level with island; Pantry; Granite countertops; Tiled backsplash; Painted cabinets; Luxury vinyl plank flooring in kitchen; Smooth-surface range; Dishwasher; Garbage disposal
- Bedrooms: Primary bedroom on second floor with walk-in closet and carpet; Second bedroom on second floor with carpet; Third bedroom on second floor
- Flooring: Carpet in bedrooms and great room; Luxury vinyl plank in kitchen
- Bathrooms: Two full bathrooms; One partial bathroom (half bath); One main half bath
- Heating & cooling: Central heating; Central air conditioning
- Interior features: Ceiling fan(s); Garage opener; Pull-down attic access; Wood-burning fireplace (1)
- Laundry & utility: Main-level mud room laundry; Electric water heater
Neighborhood map
What this means for you Summary
Snapshot
- This is a 3-bed/3.0-bath single-family listed at $290k.
Deal economics
- At list price, monthly cash flow is $20 ($238/yr) — positive.
- The deal already cash-flows at list — no discount required.
- To meet the 1% rule (rent ≥ 1% of price), the offer needs to be $237k (18.3% below list).
- Recommended offer: $237k (18.3% below list) — sets the bar for 1% rule.
Location & tenants
- Location reads 73/100 on livability (#38 in SC) — a middle-class / working-renter tenant base. Strengths: cost of living A+, housing A+, employment B; Watch: amenities F, commute F.
- Lexington 05 (suburban): math 47% / reading 55% proficiency, ranked #5 of 80 in SC (top 6%) — acceptable for families but not a draw, mixed tenant base, ~2y average lease.
- Zoned schools: Ballentine Elementary (math 59% / reading 64%, grade B, #76 of 597 statewide, top 13%, 521 students, 42% FRL); Dutch Fork Middle (math 39% / reading 52%, grade D+, #46 of 229 statewide, top 20%, 921 students, 57% FRL); Dutch Fork High (math 54% / reading 86%, grade B+, #58 of 196 statewide, top 30%, 1,726 students, 52% FRL) — zoned schools average 50% FRL vs 27% district-wide (23 pts higher); higher-poverty schools than district average — tighter screening recommended.
- Market conditions: Rents flat; 318 active listings in the ZIP; 32 comparable units currently listed for rent nearby; rentals at typical pace (median 23d on market — plan ~3-4 weeks tenant-placement turnaround); solid renter incomes; 3,472 units permitted in Richland County in 2024 (1,096 in 5+ unit buildings).
- This rent runs 31% of the median local income ($92k/yr) — at the standard rent-burdened threshold; future hikes will face affordability resistance.
Forward outlook
- Local home prices are declining (-3.0%/yr); year-one equity from $2k of loan paydown is wiped out by about $9k of value loss. Plan a longer hold.
- Richland County population projected at +30% by 2050 — long-run rental-demand tailwind backs the buy-and-hold thesis.
Negotiation context
- It's been on market 98 days — a 9% lower offer ($264k) is reasonable based on typical stale-listing flexibility.
- Current owner paid $149k; list at $290k implies a 95% gain — meaningful room to come down on a strong offer.
Risks & watch-outs
- Watch-outs: flood insurance adds $56/mo.
- Climate carrying-cost: major flood risk; extreme-heat days projected 7→16/yr by 2055 (HVAC capex compounding) — expect insurance premiums to compound above CPI over the hold.
Questions for the listing agent
- It's been on market 98 days. Have you received any prior offers? Is the seller open to a 18% concession, seller financing, or rate buy-down credit?
- What's the actual annual flood-insurance premium (NFIP or private), and is the property in a SFHA with mandatory coverage?
- What does the HOA fee cover, when was the last increase, and are there any pending special assessments or reserve-fund shortfalls?
- Why hasn't it sold? Are there any deal-killer items the seller is aware of (foundation, flood, title, zoning, code violations)?
- Is there a deadline driving the sale (1031 exchange, divorce, estate, relocation)? That informs how much negotiation room exists.
- Schools are B-rated — typically a magnet for longer-tenancy family renters. What's the average tenant stay here, and is there a school-zone premium baked into asking?
- The area grade is low — what's the realistic commute time and amenity access for the typical tenant pool here? Any planned neighborhood developments (good or bad) we should know about?
- What's the average days-on-market for RENTAL listings here right now (not sales)? A rising rental-DOM trend means longer vacancies and softer asking-rent achievability than the comps imply.
- What's the recent tenant-quality profile in this submarket — average credit score on applications, eviction rate, late-payment / NSF rate, and stable-employment percentage? A property-management company in the area should have these aggregated.
- How much new for-sale + rental construction is in the pipeline within 1–3 miles? Heavy new supply typically softens prices + rents 12–24 months out; constrained supply supports both.
Investment metrics
- 1% rule
- 0.82% ✗
- Cap rate
- 6.61%
- Cash-on-cash
- 1.12%
- DSCR
- 1.05
- GRM
- 10.2
CMA / ARV
No comps found within radius.
Projected returns pro-forma
-3.0% appreciation · 0.78% rent growth · sell at horizon
- IRR
- -18.2%
- Equity multiple
- 0.37×
- Total profit
- $-50,946
- Equity at exit
- $43,225
- IRR
- -15.1%
- Equity multiple
- 0.22×
- Total profit
- $-63,285
- Equity at exit
- $25,065
Cash invested: $81,172 (down + closing). Projections, not guarantees.
Landlord ↔ Tenant lean methodology
- Overall (STATE)
- 90 Strongly Landlord-Friendly
- State South Carolina
- 90 Strongly Landlord-Friendly · R+6
- County
- — inherits STATE
- City
- — inherits STATE
ZIP-level market 29063
- Rents YoY
- 0.8%
- Active inventory
- 318
- Price-to-rent
- 10.2×
Monthly cashflow live
- Estimated rent
- $2,369 high interval (Pro) →
- Mortgage (P&I)
- −$1,520
- Tax from tax record
- −$107 /mo · $1,279/yr
- Insurance
- −$121
- Flood insurance flood zone
- −$56 /mo · $670/yr
- HOA
- −$48
- Vacancy / Maint / Mgmt
- −$497
- Net cashflow
- $20
Break-even live
Sensitivity live
| Price | -10% $184 | -5% $102 | +0% $20 | +5% $-62 | +10% $-144 |
|---|---|---|---|---|---|
| Rent | -10% $-167 | -5% $-74 | +0% $20 | +5% $113 | +10% $207 |
| Rate | -1.0pp $166 | -0.5pp $94 | base $20 | +0.5pp $-55 | +1.0pp $-132 |
UW: 25.0% down · 7.5% · 30yr · 1.5% tax · 5.0% vac · 8.0% maint · 8.0% mgmt
Financing live
Cash to close
- Down payment
- $72,475
- Closing costs
- $8,697
- Reserves months
- —
- Total cash needed
- —
Loan-product check · same deal, 3 products live
Conventional
25% down · 7.5% · 30yr
- Down + closing
- —
- Monthly P&I
- —
- Monthly cashflow
- —
- DSCR
- —
- Eligible?
- —
Personal DTI + credit; lowest rate.
DSCR
20% down · 8.5% · 30yr
- Down + closing
- —
- Monthly P&I
- —
- Monthly cashflow
- —
- DSCR
- —
- Eligible?
- —
No personal income docs; deal must DSCR.
Hard money
10% down · 12.0% · 12mo
- Down + closing
- —
- Monthly P&I
- —
- Monthly cashflow
- —
- DSCR
- —
- Eligible?
- —
Short-term bridge; refi at stabilization.
Rent comps 32 comps
| Address | Beds | Baths | Sqft | Rent | $/sqft | DOM | Units | Dist |
|---|---|---|---|---|---|---|---|---|
| 103 Walnut Grove Cir Irmo, SC | 4.0 | 2.0 | 2022 | $2,200 | $1.09 | 5d | 1 | 0.46mi |
| 783 Patmore Dr Irmo, SC | 4.0 | 2.5 | 2266 | $2,449 | $1.08 | 23d | 1 | 1.04mi |
| 763 Patmore Dr Irmo, SC | 4.0 | 3.0 | 2110 | $2,299 | $1.09 | 23d | 1 | 1.04mi |
| 767 Patmore Dr Irmo, SC | 4.0 | 3.0 | 2110 | $2,299 | $1.09 | 23d | 1 | 1.04mi |
| 912 Hayston Way Irmo, SC | 4.0 | 2.5 | 2266 | $2,549 | $1.12 | 23d | 1 | 1.07mi |
| 916 Hayston Way Irmo, SC | 4.0 | 3.0 | 2110 | $2,475 | $1.17 | 23d | 1 | 1.08mi |
| 920 Hayston Way Irmo, SC | 3.0 | 2.0 | 1700 | $2,295 | $1.35 | 23d | 1 | 1.08mi |
| 913 Hayston Way Irmo, SC | 4.0 | 3.0 | 2110 | $2,583 | $1.22 | 23d | 1 | 1.09mi |
| 928 Hayston Way Irmo, SC | 4.0 | 2.5 | 2266 | $2,625 | $1.16 | 23d | 1 | 1.10mi |
| 309 Redmoss Dr Irmo, SC | 4.0 | 2.5 | 1783 | $2,245 | $1.26 | 13d | 1 | 1.11mi |
| 921 Hayston Way Irmo, SC | 4.0 | 3.0 | 2110 | $2,583 | $1.22 | 23d | 1 | 1.11mi |
| 932 Hayston Way Irmo, SC | 4.0 | 3.0 | 2110 | $2,583 | $1.22 | 23d | 1 | 1.11mi |
| 925 Hayston Way Irmo, SC | 4.0 | 2.5 | 2266 | $2,535 | $1.12 | 23d | 1 | 1.11mi |
| 195 Abbots Glen Rd Irmo, SC | 4.0 | 2.5 | 1783 | $2,295 | $1.29 | 4d | 1 | 1.15mi |
| 437 Stonyhurst Dr Irmo, SC | 4.0 | 2.5 | 1783 | $2,245 | $1.26 | 21d | 1 | 1.17mi |
| 506 Glenmanor Dr Irmo, SC | 4.0 | 2.5 | 2075 | $2,433 | $1.17 | 4d | 1 | 1.17mi |
| 712 Patmore Dr Irmo, SC | 3.0 | 2.0 | 1700 | $2,283 | $1.34 | 16d | 1 | 1.18mi |
| 716 Patmore Dr Irmo, SC | 4.0 | 2.5 | 2266 | $2,495 | $1.10 | 5d | 1 | 1.18mi |
| 762 Patmore Dr Irmo, SC | 4.0 | 3.0 | 2110 | $2,299 | $1.09 | 23d | 1 | 1.19mi |
| 700 Patmore Dr Irmo, SC | 4.0 | 3.0 | 2110 | $2,475 | $1.17 | 23d | 1 | 1.19mi |
| 705 Patmore Dr Irmo, SC | 4.0 | 3.0 | 2110 | $2,475 | $1.17 | 5d | 1 | 1.19mi |
| 687 Patmore Dr Irmo, SC | 3.0 | 2.0 | 1700 | $2,283 | $1.34 | 23d | 1 | 1.22mi |
| 675 Patmore Dr Irmo, SC | 4.0 | 2.5 | 2266 | $2,495 | $1.10 | 23d | 1 | 1.23mi |
| 693 Patmore Dr Irmo, SC | 4.0 | 3.0 | 2110 | $2,349 | $1.11 | 23d | 1 | 1.23mi |
| 671 Patmore Dr Irmo, SC | 4.0 | 3.0 | 2110 | $2,349 | $1.11 | 23d | 1 | 1.23mi |
| 674 Patmore Dr Irmo, SC | 4.0 | 3.0 | 2110 | $2,349 | $1.11 | 4d | 1 | 1.23mi |
| 681 Patmore Dr Irmo, SC | 4.0 | 3.0 | 2110 | $2,475 | $1.17 | 4d | 1 | 1.23mi |
| 533 Glenmanor Dr Irmo, SC | 4.0 | 3.0 | 2100 | $2,395 | $1.14 | 4d | 1 | 1.24mi |
| 148 Abbots Glen Rd Irmo, SC | 4.0 | 3.0 | 2100 | $2,395 | $1.14 | 4d | 1 | 1.25mi |
| 540 Glenmanor Dr Irmo, SC | 4.0 | 3.0 | 2100 | $2,395 | $1.14 | 13d | 1 | 1.25mi |
| 559 Glenmanor Dr Irmo, SC | 4.0 | 2.5 | 2075 | $2,433 | $1.17 | 4d | 1 | 1.30mi |
| 580 Glenmanor Dr Irmo, SC | 3.0 | 2.0 | 1700 | $2,296 | $1.35 | 4d | 1 | 1.34mi |
HOA detail
- Monthly dues
- $48 · $576/yr
Listing history 5 events
-
2026-05-14historical Active - Contingent
-
2026-04-10price $289,900
-
2026-02-20$299,900 Active
-
1999-06-02soldstatus $149,000
-
1997-04-21soldstatus $137,275
ⓘ Source: listings_history table (triggers on properties + properties_extension) + one-shot
backfill from property_details.listing_events for pre-trigger history.
Tax reassessment forecast SC · Resets to sale price
- Current annual tax
- $1,279 · $107/mo
- Projected year-2 tax
- $1,652 · $138/mo
- Expected delta
- +$373/yr (+$31/mo · 29.2%)
ⓘ Screening estimate from a state-policy table — verify with the county assessor before closing.
Climate risk First Street
- Flood 7/10 Severe FEMA zone X · 99% chance over 30 yrs
- Wildfire 2/10 Low
- Heat 7/10 Severe
Nearby sold comps map
Loading sold comps map…
Walkable amenities ~0.75 mi
Loading nearby amenities…
Taxation est. · year 1
- Rental income
- $28,425
- − Mortgage interest
- −$16,239
- − Property taxes
- −$1,279
- − Insurance
- −$2,120
- − Repairs & maintenance
- −$2,274
- − Management
- −$2,274
- − HOA
- −$576
- − Depreciation
- −$8,433
- Taxable loss
- −$4,770
- Est. tax savings @ 24.0%
- +$1,145
- After-tax cash flow
- $1,383/yr
For passive investors: Depreciation is non-cash, so a rental often shows a tax loss while cash-flowing — sheltering income. Rental losses are passive: they offset passive income freely, and up to $25,000/yr can offset ordinary (W-2) income if you actively participate and your MAGI is under $100k (phasing out to $0 by $150k); unused losses carry forward. On sale, claimed depreciation is recaptured at up to 25%, and gains may owe capital-gains tax (a 1031 exchange can defer both). Figures are a year-1 estimate at your 24.0% rate — not tax advice; consult a CPA.
Schools (NCES district)
- District
- Lexington 05
- NCES district ID
- 4502820
- Math proficiency
- 47% ▼ -7.00%
- Reading proficiency
- 55% ▼ -4.00%
- Median HH income
- $67,732
- Composite
- 45.28/100
- National rank
- #2656
- State rank
- #5 of 80 in SC
Livability — Irmo
- Score
- 73/100
- State rank
- #38
- US rank
- #5024
Category grades
Schools grade is shown separately in the Schools card above.
Census & demographics
- County
- Richland County · 389,530 people
- City population
- 38,201
- Metro
- Columbia, SC
- Population (ZIP)
- 38,201
- Household income
- $91,973
- Rent vs Own
- Severe rent burden
- 962.0
Population outlook (Richland County) Hauer SSP2
- Today (2025)
- 459,667 people
- By 2030
- 487,524 · +6.1%
- By 2040
- 542,035 · +17.9%
- By 2050
- 595,371 · +29.5%
- By 2075
- 732,998 · +59.5%
- By 2100
- 820,415 · +78.5%
Race, ethnicity, and origin ACS 2023
- Neighborhood character
- Majority White (65%)
- Race & ethnicity
- White 65% Black 26% Two or more races 5% Hispanic / Latino 3% Asian 2%
- Common ancestry
- Romanian 4% Slovak 4% Serbian 3%
- Foreign-born
- 4% · Canada
- Languages at home
- 95% English-only · Spanish 2% Russian/Polish/Slavic 1% Other Indo-European 1%
Political lean MEDSL · Richland
- 2024 margin
- Solid D (+34.6) · D 66.4% · R 31.8% · Other 1.8%
- 2008→2024 swing
- +5.7pp toward D · 2008: 28.9pp · 2024: 34.6pp
- All cycles
- 2024: D+34.6 2020: D+38.3 2016: D+32.9 2012: D+33.3 2008: D+28.9
Not yet ingested
- Civics
- —
Market trends
- HPI YoY
- ▼ -130.57%
- Current HPI
- 204.0147
- Rent YoY
- ▲ 0.78%
- Metro
- Columbia, SC
- State GDP YoY
- ▲ 4.51%
- F500 in state
- 2
Industry mix (Fortune 500 HQ in SC)
| Industry | F500 HQs | Revenue |
|---|---|---|
| Packaging | 1 | $7B |
|
||
Price history
+111.2% since first listed5 events — show timeline
- 2026-05-14 Contingent — Consolidated MLS
- 2026-04-10 Price Changed $289,900 Consolidated MLS
- 2026-02-20 Listed $299,900 Consolidated MLS
- 1999-06-02 Sold (Public Records) $149,000 Public Records
- 1997-04-21 Sold (Public Records) $137,275 Public Records
Property tax history
-0.1%/yrLatest (2025): $1,279 · -18.8% YoY. Source: county tax records.
Cash-flow waterfall
monthlySold comps — $/sqft
last 12 mo · ≤1 miLoading sold comps…