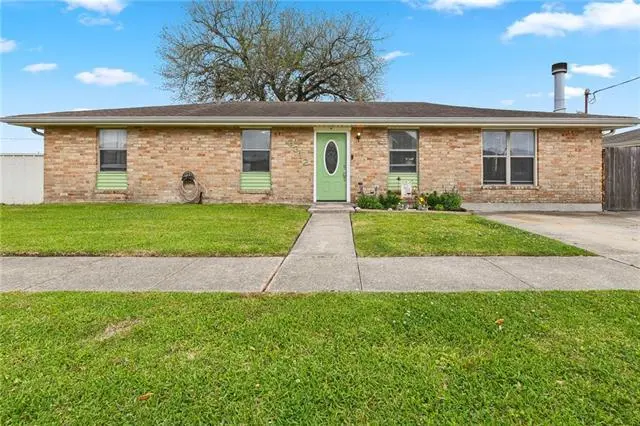
3312 Volpe Dr · Chalmette, LA
Flood risk 8/10 · Major
- FEMA flood zone
- X (shaded)
- Chance of flooding over 30 yrs
- 0.6%
- Est. flood insurance / yr
- $507 – $1,088
Fire risk 1/10 · Minimal
- Est. fire insurance / yr
- $1,269 – $2,357
Heat risk 10/10 · Severe
- Hot days now (above 108°F)
- 7 days/yr
- Hot days in 30 yrs
- 22 days/yr
Wind risk 10/10 · Severe
- Chance of severe wind over 30 yrs
- 99.0%
Air-quality risk 2/10 · Minimal
- Unhealthy air days now
- 1 days/yr
- Unhealthy air days in 30 yrs
- 2 days/yr
Risk factors via First Street. Map © Google.
Why this score? — see what drove the C- grade
The composite is a weighted blend of 9 inputs, each scored 0–100. Each bar is that input's sub-score; the figure is the points it added to the 100-point composite (weight × sub-score).
- Cash flow +16.0/30.0
- ARV discount +15.0/15.0
- Schools +5.0/10.0
- DSCR +4.9/10.0
- Rent growth +3.3/5.0
- Livability +3.2/5.0
- 1% rule +3.0/10.0
- Condition / age +2.5/5.0
- Appreciation +0.0/10.0
$220,000
🖨 Deal sheet 📄 Offer letter ✓ Due diligence
Listing remarks MLS
Welcome to 3312 Volpe Drive--an inviting 3-bedroom, 2-bath home that combines comfort, practicality, and peace of mind. With 1,445 square feet, this home offers a functional layout that's easy to live in. The spacious living area flows naturally and is filled with great natural light, creating a warm, relaxed feel from the moment you walk in. You'll also have confidence knowing the big-ticket items are already handled, including a new HVAC system and water heater, both less than a year old. The kitchen and living spaces are set up for connection, while the bedrooms provide a comfortable retreat at the end of the day. Whether you need space for family, a home office, or just room to spread out, this layout makes it work. Step outside and you'll find one of the standout features of this home--an oversized covered patio, great for entertaining, weekend cookouts, or just relaxing in the shade. It's a space you'll actually use year-round. Situated in a quiet, established neighborhood, this home offers a laid-back setting while still being accessible to everything you need. If you're searching for a well-appointed home with room to grow, this property is not to be missed! Schedule a showing today to experience all that 3312 Volpe Dr has to offer. This delightful home is ready to welcome its new owners--don't let this opportunity pass you by!
Key facts
- 5,227 sq ft lot
- Built 1978
- Listed 76 days
Neighborhood map
What this means for you Summary
Snapshot
- This is a 3-bed/2.0-bath single-family listed at $220k.
Deal economics
- At list price, monthly cash flow is $41 ($489/yr) — positive.
- The deal already cash-flows at list — no discount required.
- To meet the 1% rule (rent ≥ 1% of price), the offer needs to be $177k (19.5% below list).
- Recommended offer: $177k (19.5% below list) — sets the bar for 1% rule.
- Cap rate 6.9% vs local median 5.5% in Chalmette — meaningfully above typical; check what's discounted (condition, days-on-market, listing class) to confirm the premium yield is real.
Location & tenants
- Location reads 65/100 on livability (#137 in LA) — a middle-class / working-renter tenant base. Strengths: cost of living A+, housing A+, health & safety A; Watch: crime F, amenities F, commute F.
- Market conditions: Rents rising (+3.1%/yr); 209 active listings in the ZIP; 40 comparable units currently listed for rent nearby; rentals at typical pace (median 20d on market — plan ~3-4 weeks tenant-placement turnaround); 112 units permitted in St. Bernard Parish in 2024 (0 in 5+ unit buildings).
- This rent runs 39% of the median local income ($55k/yr) — at the standard rent-burdened threshold; future hikes will face affordability resistance.
Forward outlook
- Local home prices are declining (-3.0%/yr); year-one equity from $2k of loan paydown is wiped out by about $7k of value loss. Plan a longer hold.
- St. Bernard County population projected at +89% by 2050 — long-run rental-demand tailwind backs the buy-and-hold thesis.
Negotiation context
- It's been on market 76 days — a 6% lower offer ($207k) is reasonable based on typical stale-listing flexibility.
- 11 sale attempts since 32y ago with the ask held roughly flat each time — persistent listings suggest the price (not the market) is what's stuck; bring a comps-based counter.
- Current owner paid $117k; list at $220k implies a 88% gain — meaningful room to come down on a strong offer.
Risks & watch-outs
- Watch-outs: flood insurance adds $66/mo.
- Climate carrying-cost: severe flood risk; severe wind risk, 99% chance of damaging wind over 30y; extreme-heat days projected 7→22/yr by 2055 (HVAC capex compounding) — expect insurance premiums to compound above CPI over the hold.
Questions for the listing agent
- It's been on market 76 days. Have you received any prior offers? Is the seller open to a 20% concession, seller financing, or rate buy-down credit?
- Built in 1978 — when were the roof, HVAC, electrical panel, plumbing, and water heater last replaced?
- What's the actual annual flood-insurance premium (NFIP or private), and is the property in a SFHA with mandatory coverage?
- Why hasn't it sold? Are there any deal-killer items the seller is aware of (foundation, flood, title, zoning, code violations)?
- Is there a deadline driving the sale (1031 exchange, divorce, estate, relocation)? That informs how much negotiation room exists.
- Crime grade is F in this area — have there been break-ins, vandalism, or insurance claims at this property in the last 3 years? What carrier currently insures it and at what premium?
- What's the average days-on-market for RENTAL listings here right now (not sales)? A rising rental-DOM trend means longer vacancies and softer asking-rent achievability than the comps imply.
- What's the recent tenant-quality profile in this submarket — average credit score on applications, eviction rate, late-payment / NSF rate, and stable-employment percentage? A property-management company in the area should have these aggregated.
- How much new for-sale + rental construction is in the pipeline within 1–3 miles? Heavy new supply typically softens prices + rents 12–24 months out; constrained supply supports both.
Investment metrics
- 1% rule
- 0.80% ✗
- Cap rate
- 6.88%
- Cash-on-cash
- 2.09%
- DSCR
- 1.09
- GRM
- 10.4
CMA / ARV
- ARV (median comp)
- $268,682
- List price
- $220,000
- Delta
- -18.12%
- Verdict
- UNDERPRICED
- Comps
- 20 within 1.0 mi
Show comp detail 12 sales within ~0.75 mi
| Address | Dist | Beds/Ba | Sqft | Sold | Price | $/sf | Match |
|---|---|---|---|---|---|---|---|
| 3304 Corinne Dr | 0.20mi | 3/2.0 | 1,414 (-2%) | 3mo | $224,500 | $159 | 85 |
| 3417 Volpe Dr | 0.11mi | 3/2.0 | 1,300 (-10%) | 2mo | $210,000 | $162 | 77 |
| 2901 Blanchard Dr | 0.38mi | 3/2.0 | 1,339 (-7%) | 3mo | $195,000 | $146 | 68 |
| 3401 Marietta St | 0.42mi | 3/2.0 | 1,330 (-8%) | 1mo | $155,000 | $117 | 66 |
| 3100 Marietta St | 0.53mi | 3/1.0 | 1,464 (+1%) | 4mo | $60,000 | $41 | 66 |
| 3500 Dauterive Dr | 0.33mi | 3/2.0 | 1,279 (-12%) | 3mo | $196,000 | $153 | 63 |
| 3408 Lyndell Dr | 0.41mi | 3/2.0 | 1,574 (+9%) | 4mo | $200,000 | $127 | 62 |
| 3504 Veronica Dr | 0.26mi | 3/2.0 | 1,645 (+14%) | 4mo | $210,000 | $128 | 61 |
| 1100 Missouri St | 0.28mi | 3/2.5 | 1,650 (+14%) | 1mo | $315,000 | $191 | 60 |
| 2705 Pecan Dr | 0.43mi | 4/2.0 (+1) | 1,554 (+8%) | 4mo | $260,000 | $167 | 59 |
| 2425 Charles Dr | 0.69mi | 3/2.0 | 1,520 (+5%) | 3mo | $250,000 | $164 | 57 |
| 2408 Riverland Dr | 0.70mi | 3/2.0 | 1,505 (+4%) | 4mo | $270,000 | $179 | 57 |
Match score weights: distance 35% · size 25% · config 20% · recency 20%. Top-matched comps best support the ARV.
Projected returns pro-forma
-3.0% appreciation · 3.11% rent growth · sell at horizon
- IRR
- -15.0%
- Equity multiple
- 0.47×
- Total profit
- $-32,933
- Equity at exit
- $32,803
- IRR
- -6.2%
- Equity multiple
- 0.60×
- Total profit
- $-24,830
- Equity at exit
- $19,022
Cash invested: $61,600 (down + closing). Projections, not guarantees.
Landlord ↔ Tenant lean methodology
- Overall (STATE)
- 90 Strongly Landlord-Friendly
- State Louisiana
- 90 Strongly Landlord-Friendly · R+12
- County
- — inherits STATE
- City
- — inherits STATE
ZIP-level market 70043
- Rents YoY
- 3.1%
- Active inventory
- 209
- Price-to-rent
- 10.4×
Monthly cashflow live
- Estimated rent
- $1,770 high interval (Pro) →
- Mortgage (P&I)
- −$1,154
- Tax from tax record
- −$46 /mo · $550/yr
- Insurance
- −$92
- Flood insurance flood zone
- −$66 /mo · $798/yr
- HOA
- −$0
- Vacancy / Maint / Mgmt
- −$372
- Net cashflow
- $41
Break-even live
UW: 25.0% down · 7.5% · 30yr · 1.5% tax · 5.0% vac · 8.0% maint · 8.0% mgmt
Financing live
Cash to close
- Down payment
- $55,000
- Closing costs
- $6,600
- Reserves months
- —
- Total cash needed
- —
Loan-product check · same deal, 3 products live
Conventional
25% down · 7.5% · 30yr
- Down + closing
- —
- Monthly P&I
- —
- Monthly cashflow
- —
- DSCR
- —
- Eligible?
- —
Personal DTI + credit; lowest rate.
DSCR
20% down · 8.5% · 30yr
- Down + closing
- —
- Monthly P&I
- —
- Monthly cashflow
- —
- DSCR
- —
- Eligible?
- —
No personal income docs; deal must DSCR.
Hard money
10% down · 12.0% · 12mo
- Down + closing
- —
- Monthly P&I
- —
- Monthly cashflow
- —
- DSCR
- —
- Eligible?
- —
Short-term bridge; refi at stabilization.
Rent comps 40 comps
| Address | Beds | Baths | Sqft | Rent | $/sqft | DOM | Units | Dist |
|---|---|---|---|---|---|---|---|---|
| 3012 Volpe Dr Chalmette, LA | 3.0 | 2.0 | 1812 | $2,500 | $1.38 | 43d | 1 | 0.20mi |
| 3321 Plaza Dr Chalmette, LA | 3.0 | 2.0 | 1400 | $1,650 | $1.18 | 10d | 1 | 0.34mi |
| 3708 Veronica Dr Chalmette, LA | 3.0 | 2.0 | 1818 | $2,550 | $1.40 | 1d | 1 | 0.35mi |
| 3629 Charles Dr Chalmette, LA | 3.0 | 2.0 | 1405 | $1,600 | $1.14 | 14d | 1 | 0.36mi |
| 2708 Volpe Dr Chalmette, LA | 3.0 | 2.0 | 1556 | $2,300 | $1.48 | 21d | 1 | 0.42mi |
| 2602 Chalona Dr Unit C Chalmette, LA | 2.0 | 1.5 | 900 | $1,200 | $1.33 | 2d | 1 | 0.50mi |
| 3329 Golden Dr Unit A Chalmette, LA | 2.0 | 1.5 | 1200 | $1,200 | $1.00 | 43d | 1 | 0.50mi |
| 3305 Golden Dr Unit D Chalmette, LA | 2.0 | 1.5 | 1100 | $1,200 | $1.09 | 15d | 1 | 0.51mi |
| 3513 Golden Dr Chalmette, LA | 2.0 | 2.0 | 1000 | $1,200 | $1.20 | 43d | 1 | 0.51mi |
| 3209 Golden Dr Unit C Chalmette, LA | 2.0 | 1.5 | 950 | $1,200 | $1.26 | 15d | 1 | 0.54mi |
| 511 E Genie St Chalmette, LA | 3.0 | 2.0 | 1100 | $1,500 | $1.36 | 1d | 1 | 0.58mi |
| 3106 Laplace St Chalmette, LA | 3.0 | 2.5 | 1390 | $1,650 | $1.19 | 43d | 1 | 0.67mi |
| 3108 Laplace St Chalmette, LA | 3.0 | 2.5 | 1390 | $1,650 | $1.19 | 43d | 1 | 0.69mi |
| 406 Dubarry Pl Chalmette, LA | 3.0 | 2.0 | 950 | $1,550 | $1.63 | 43d | 1 | 0.70mi |
| 3612 Laplace St Chalmette, LA | 2.0 | 1.5 | 1090 | $1,300 | $1.19 | 16d | 1 | 0.70mi |
| 2431 Octavia Dr Chalmette, LA | 3.0 | 2.0 | 1100 | $1,499 | $1.36 | 43d | 1 | 0.72mi |
| 2429 Octavia Dr Chalmette, LA | 3.0 | 2.0 | 1700 | $1,575 | $0.93 | 23d | 1 | 0.72mi |
| 3108 Tournefort St Chalmette, LA | 3.0 | 2.0 | 1399 | $1,750 | $1.25 | 2d | 1 | 0.75mi |
| 3711 Tournefort St Chalmette, LA | 3.0 | 2.0 | 1250 | $1,850 | $1.48 | 3d | 1 | 0.76mi |
| 2228 Riverland Dr Chalmette, LA | 3.0 | 1.0 | 1300 | $1,800 | $1.38 | 2d | 1 | 0.83mi |
| 2337 Plaza Dr Chalmette, LA | 3.0 | 2.0 | 925 | $1,500 | $1.62 | 43d | 1 | 0.83mi |
| 2518 Delambert St Chalmette, LA | 3.0 | 2.0 | 1617 | $1,825 | $1.13 | 43d | 1 | 0.84mi |
| 2319 Plaza Dr Chalmette, LA | 2.0 | 1.0 | 1000 | $1,200 | $1.20 | 3d | 1 | 0.88mi |
| 2329 Lyndell Dr Chalmette, LA | 2.0 | 1.0 | 1265 | $1,400 | $1.11 | 43d | 1 | 0.88mi |
| 321 Rosemary Pl Chalmette, LA | 2.0 | 2.0 | 1000 | $1,550 | $1.55 | 1d | 1 | 0.99mi |
| 3400 Montesquieu St Unit 1-B Chalmette, LA | 3.0 | 2.5 | 1372 | $2,550 | $1.86 | 1d | 1 | 1.00mi |
| 2709 Munster Blvd Meraux, LA | 3.0 | 2.0 | 1411 | $1,900 | $1.35 | 23d | 1 | 1.00mi |
| 2029 W Beauregard St Chalmette, LA | 3.0 | 2.0 | 1176 | $2,200 | $1.87 | 16d | 1 | 1.11mi |
| 226 E Casa Calvo St Chalmette, LA | 3.0 | 2.0 | 1330 | $1,900 | $1.43 | 43d | 1 | 1.12mi |
| 3507 Sinclair St Chalmette, LA | 3.0 | 2.0 | 1186 | $1,800 | $1.52 | 10d | 1 | 1.14mi |
| 203 E Moreau St Chalmette, LA | 3.0 | 1.5 | 965 | $1,700 | $1.76 | 3d | 1 | 1.18mi |
| 3625 Park Blvd Chalmette, LA | 3.0 | 2.0 | 924 | $1,750 | $1.89 | 2d | 1 | 1.25mi |
| 3617 Park Blvd Chalmette, LA | 3.0 | 2.0 | 1090 | $1,850 | $1.70 | 20d | 1 | 1.25mi |
| 3617 Park Blvd Chalmette, LA | 3.0 | 2.0 | 1090 | $1,850 | $1.70 | 43d | 1 | 1.25mi |
| 2107 Montesquieu St Chalmette, LA | 2.0 | 1.0 | 1150 | $1,199 | $1.04 | 21d | 1 | 1.27mi |
| 3508 Pakenham Dr Chalmette, LA | 2.0 | 1.0 | 1000 | $1,150 | $1.15 | 2d | 1 | 1.37mi |
| 3606 Pakenham Dr Unit 3606 Chalmette, LA | 3.0 | 2.0 | 1400 | $1,800 | $1.29 | 11d | 1 | 1.37mi |
| 2707 Jackson Blvd Chalmette, LA | 3.0 | 2.5 | 1733 | $2,300 | $1.33 | 23d | 1 | 1.39mi |
| 2707 Jackson Blvd Chalmette, LA | 3.0 | 3.0 | 1733 | $2,300 | $1.33 | 43d | 1 | 1.39mi |
| 3615 Jupiter Dr Chalmette, LA | 3.0 | 1.5 | 1000 | $1,595 | $1.59 | 43d | 1 | 1.41mi |
Listing history 29 events
-
2026-06-18days on market $220,000 Active 76 DOM
-
2026-06-17days on market $220,000 Active 75 DOM
-
2026-06-16days on market $220,000 Active 74 DOM
-
2026-06-15days on market $220,000 Active 73 DOM
-
2026-06-13days on market $220,000 Active 71 DOM
-
2026-06-10days on market $220,000 Active 68 DOM
-
2026-06-09days on market $220,000 Active 67 DOM
-
2026-06-08days on market $220,000 Active 66 DOM
-
2026-06-07days on market $220,000 Active 65 DOM
-
2026-06-03days on market $220,000 Active 61 DOM
-
2026-06-02days on market $220,000 Active 60 DOM
-
2026-06-01days on market $220,000 Active 59 DOM
-
2026-05-31days on market $220,000 Active 58 DOM
-
2026-04-03$220,000 Active 1357-char remark
Show marketing remark (1357 chars)
Welcome to 3312 Volpe Drive--an inviting 3-bedroom, 2-bath home that combines comfort, practicality, and peace of mind. With 1,445 square feet, this home offers a functional layout that's easy to live in. The spacious living area flows naturally and is filled with great natural light, creating a warm, relaxed feel from the moment you walk in. You'll also have confidence knowing the big-ticket items are already handled, including a new HVAC system and water heater, both less than a year old. The kitchen and living spaces are set up for connection, while the bedrooms provide a comfortable retreat at the end of the day. Whether you need space for family, a home office, or just room to spread out, this layout makes it work. Step outside and you'll find one of the standout features of this home--an oversized covered patio, great for entertaining, weekend cookouts, or just relaxing in the shade. It's a space you'll actually use year-round. Situated in a quiet, established neighborhood, this home offers a laid-back setting while still being accessible to everything you need. If you're searching for a well-appointed home with room to grow, this property is not to be missed! Schedule a showing today to experience all that 3312 Volpe Dr has to offer. This delightful home is ready to welcome its new owners--don't let this opportunity pass you by!
-
2014-06-12soldstatus $117,000
-
2010-05-21soldstatus $117,000 257-char remark
Show marketing remark (257 chars)
Low down payment with BOND FOR DEED!!!All brick ranch with open living area w/ wood burning fireplace and tray ceiling in den. Granite countertops and maple cabinets in kitchen. Large covered patio for outside entertaining. Ceramic tile floors throughout. .
-
2010-03-18$124,900 257-char remark
Show marketing remark (257 chars)
Low down payment with BOND FOR DEED!!!All brick ranch with open living area w/ wood burning fireplace and tray ceiling in den. Granite countertops and maple cabinets in kitchen. Large covered patio for outside entertaining. Ceramic tile floors throughout. .
-
2010-03-18$124,900
Show marketing remark (257 chars)
Low down payment with BOND FOR DEED!!!All brick ranch with open living area w/ wood burning fireplace and tray ceiling in den. Granite countertops and maple cabinets in kitchen. Large covered patio for outside entertaining. Ceramic tile floors throughout. .
-
2009-07-13$124,900
-
2009-07-13$124,900
-
2007-12-06$139,500
-
2007-12-06$139,500
-
2007-06-05soldstatus $26,500
-
2007-03-13$32,000
-
2007-03-13$32,000
-
1994-11-02soldstatus $74,500
-
1994-10-31soldstatus $74,500
-
1994-09-02$82,000
-
1994-09-02$82,000
ⓘ Source: listings_history table (triggers on properties + properties_extension) + one-shot
backfill from property_details.listing_events for pre-trigger history.
Tax reassessment forecast LA · Resets to sale price
- Current annual tax
- $550 · $46/mo
- Projected year-2 tax
- $1,210 · $101/mo
- Expected delta
- +$660/yr (+$55/mo · 120.1%)
ⓘ Screening estimate from a state-policy table — verify with the county assessor before closing.
Climate risk First Street
- Flood 8/10 Severe FEMA zone X (shaded) · 60% chance over 30 yrs
- Wildfire 1/10 Low
- Heat 10/10 Extreme 7 d/yr ≥108°F today · 22 d/yr by 30 yrs out
- Wind 10/10 Extreme 99% chance of damaging wind over 30 yrs
- Air quality 2/10 Low 1 unhealthy d/yr today · 2 by 30 yrs out
Nearby sold comps map
Loading sold comps map…
Walkable amenities ~0.75 mi
Loading nearby amenities…
Taxation est. · year 1
- Rental income
- $21,241
- − Mortgage interest
- −$12,323
- − Property taxes
- −$550
- − Insurance
- −$1,898
- − Repairs & maintenance
- −$1,699
- − Management
- −$1,699
- − Depreciation
- −$6,400
- Taxable loss
- −$3,328
- Est. tax savings @ 24.0%
- +$799
- After-tax cash flow
- $1,287/yr
For passive investors: Depreciation is non-cash, so a rental often shows a tax loss while cash-flowing — sheltering income. Rental losses are passive: they offset passive income freely, and up to $25,000/yr can offset ordinary (W-2) income if you actively participate and your MAGI is under $100k (phasing out to $0 by $150k); unused losses carry forward. On sale, claimed depreciation is recaptured at up to 25%, and gains may owe capital-gains tax (a 1031 exchange can defer both). Figures are a year-1 estimate at your 24.0% rate — not tax advice; consult a CPA.
Schools (NCES district)
No district data.
Livability — Chalmette
- Score
- 65/100
- State rank
- #137
- US rank
- #12500
Category grades
Schools grade is shown separately in the Schools card above.
Census & demographics
- Census place
- Chalmette, LA
- County
- Saint Bernard Parish · 22,638 people
- City population
- 22,638
- Metro
- New Orleans-Metairie, LA
- Population (ZIP)
- 22,638
- Household income
- $55,068
- Rent vs Own
- Severe rent burden
- 881.0
Population outlook (St. Bernard County) Hauer SSP2
- Today (2025)
- 66,513 people
- By 2030
- 77,768 · +16.9%
- By 2040
- 101,296 · +52.3%
- By 2050
- 125,770 · +89.1%
- By 2075
- 188,160 · +182.9%
- By 2100
- 239,339 · +259.8%
Race, ethnicity, and origin ACS 2023
- Neighborhood character
- Diverse neighborhood (Simpson 0.61)
- Race & ethnicity
- White 55% Black 26% Hispanic / Latino 12% Two or more races 10% Asian 2%
- Hispanic origin (detail)
- Mexican 2%
- Common ancestry
- Lithuanian 13% Slovak 2%
- Foreign-born
- 6% · Canada, Vietnam
- Languages at home
- 88% English-only · Spanish 8% Arabic 1% Vietnamese 1%
Political lean MEDSL · St. Bernard
- 2024 margin
- Strong R (+29.3) · D 34.5% · R 63.8% · Other 1.7%
- 2008→2024 swing
- +16.1pp toward D · 2008: -45.4pp · 2024: -29.3pp
- All cycles
- 2024: R+29.3 2020: R+28.5 2016: R+33.4 2012: R+24.7 2008: R+45.4
Not yet ingested
- Civics
- —
Market trends
- HPI YoY
- ▼ -211.77%
- Current HPI
- 194.8123
- Rent YoY
- ▲ 3.11%
- Metro
- New Orleans-Metairie, LA
- State GDP YoY
- ▲ 3.29%
- F500 in state
- 10
Industry mix (Fortune 500 HQ in LA)
| Industry | F500 HQs | Revenue |
|---|---|---|
| Telecommunications | 2 | $23B |
|
||
| Utilities | 1 | $12B |
|
||
| Wholesale / Distribution | 1 | $5B |
|
||
| Advertising | 1 | $2B |
|
||
Price history
+168.3% since first listed16 events — show timeline
- 2026-04-03 Listed $220,000 AcadianaMLS
- 2014-06-12 Sold (Public Records) $117,000 Public Records
- 2010-05-21 Sold (MLS) $117,000 GSREIN
- 2010-03-18 Listed $124,900 AcadianaMLS
- 2010-03-18 Listed $124,900 GSREIN
- 2009-07-13 Listed $124,900 GSREIN
- 2009-07-13 Listed $124,900 AcadianaMLS
- 2007-12-06 Listed $139,500 GSREIN
- 2007-12-06 Listed $139,500 AcadianaMLS
- 2007-06-05 Sold (MLS) $26,500 GSREIN
- 2007-03-13 Listed $32,000 AcadianaMLS
- 2007-03-13 Listed $32,000 GSREIN
- 1994-11-02 Sold (Public Records) $74,500 Public Records
- 1994-10-31 Sold (MLS) $74,500 GSREIN
- 1994-09-02 Listed $82,000 GSREIN
- 1994-09-02 Listed $82,000 AcadianaMLS
Property tax history
-8.0%/yrLatest (2025): $550 · -67.7% YoY. Source: county tax records.
Cash-flow waterfall
monthlySold comps — $/sqft
last 12 mo · ≤1 miLoading sold comps…