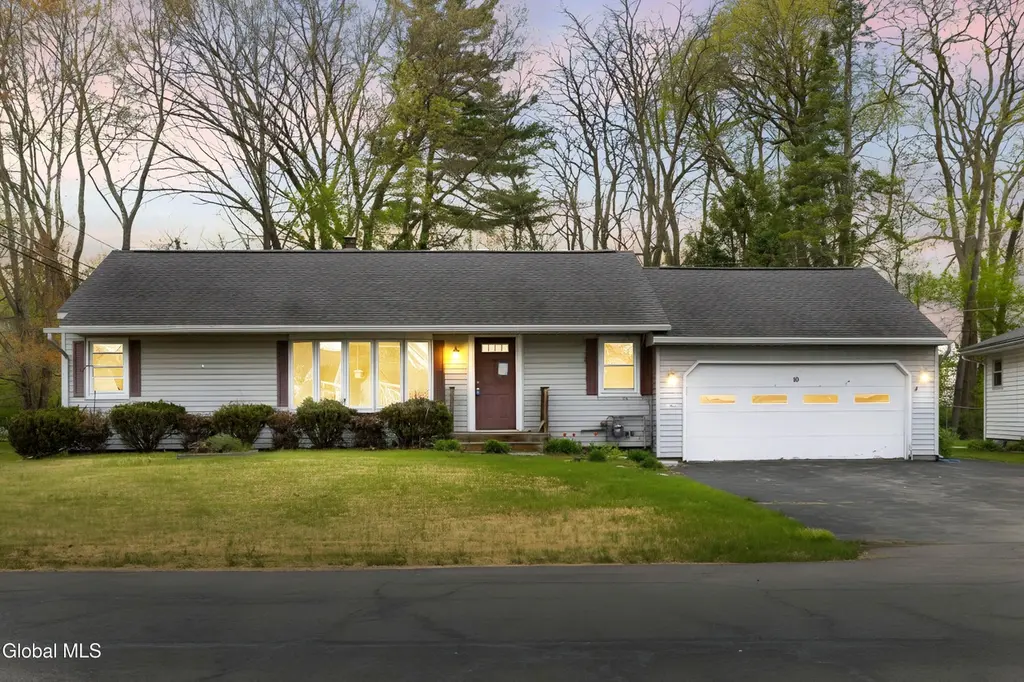
10 Leto Rd · Westmere, NY
Flood risk 1/10 · Minimal
- FEMA flood zone
- X (unshaded)
- Chance of flooding over 30 yrs
- 0.0%
- Est. flood insurance / yr
- $473 – $860
Fire risk 3/10 · Minor
- Est. fire insurance / yr
- $691 – $1,283
Heat risk 4/10 · Minor
- Hot days now (above 98°F)
- 7 days/yr
- Hot days in 30 yrs
- 17 days/yr
Wind risk 3/10 · Minor
- Chance of severe wind over 30 yrs
- 6.0%
Air-quality risk 1/10 · Minimal
- Unhealthy air days now
- 0 days/yr
- Unhealthy air days in 30 yrs
- 0 days/yr
Risk factors via First Street. Map © Google.
Why this score? — see what drove the D grade
The composite is a weighted blend of 9 inputs, each scored 0–100. Each bar is that input's sub-score; the figure is the points it added to the 100-point composite (weight × sub-score).
- ARV discount +15.0/15.0
- Cash flow +8.5/30.0
- Schools +5.7/10.0
- Livability +3.5/5.0
- 1% rule +3.2/10.0
- Rent growth +3.0/5.0
- Condition / age +2.5/5.0
- DSCR +2.3/10.0
- Appreciation +0.0/10.0
$299,999
🖨 Deal sheet (PDF) 📄 Offer letter ✓ Due diligence
Listing remarks
Opportunity knocks in one of Albany's most desirable locations within the highly regarded Guilderland Central School District. This 3-bedroom, 2-bath home offers a solid layout and great bones, ready for its next chapter. Featuring hardwood floors and a functional floor plan, this home presents a great chance to bring your vision and make it your own with some updates. Enjoy a spacious backyard, perfect for relaxing, entertaining, or future improvements. Ideally located just seconds from shopping, dining, and major routes, including Crossgates Mall, this property offers convenience and long-term value in a prime setting. A great opportunity in a sought-after area, don't miss it.
Key facts
- Spacious backyard
- Hardwood floors
- 9,147 sq ft lot
Tags
Property features AI
Exterior
- Parking: 2-car garage; Total parking for 6 vehicles; Driveway parking
- Utilities: Public water; Public sewer
- Home design: Single family residence; Below-grade finished area present
- Construction: Vinyl siding construction
- Exterior features: Shingle roof; Vinyl siding; Back yard fencing; Paved driveway
Interior
- Kitchen: Dishwasher; Electric oven; Microwave; Refrigerator
- Bedrooms: Multiple bedrooms located on the first floor
- Flooring: Tile; Carpet; Hardwood; Linoleum
- Bathrooms: 2 full bathrooms (one on the first floor and one in the basement)
- Heating & cooling: Forced air heating (natural gas); Central air conditioning
- Interior features: Finished basement; 11 total rooms; Fireplace in family room
- Laundry & utility: Washer and dryer; Laundry located in the basement
Neighborhood map
What this means for you Summary
Snapshot
- This is a 3-bed/2.0-bath single-family listed at $300k.
Deal economics
- At list price, monthly cash flow is $-266 ($-3k/yr) — negative.
- To cash-flow at today's rent, offer at most $253k (15.6% below list).
- To meet the 1% rule (rent ≥ 1% of price), the offer needs to be $247k (17.5% below list).
- Recommended offer: $247k (17.5% below list) — sets the bar for 1% rule.
- Cap rate 5.2% vs local median 4.1% in Westmere — meaningfully above typical; check what's discounted (condition, days-on-market, listing class) to confirm the premium yield is real.
Location & tenants
- Location reads 69/100 on livability (#477 in NY) — a middle-class / working-renter tenant base. Strengths: housing A+, employment A, health & safety A; Watch: amenities F, commute F, cost of living D-.
- Guilderland Central School District (suburban): math 61% / reading 68% proficiency, ranked #166 of 590 in NY (top 28%) — acceptable for families but not a draw, mixed tenant base, ~2y average lease; only 10% free/reduced lunch — higher-income household profile.
- Zoned schools: Westmere Elementary School (math 52% / reading 62%, grade C+, #842 of 2,108 statewide, top 43%, 539 students, 26% FRL); Farnsworth Middle School (math 42% / reading 68%, grade B-, #212 of 729 statewide, top 29%, 1,151 students, 24% FRL); Guilderland High School (math 97% / reading 82%, grade A+, #265 of 1,100 statewide, top 26%, 1,462 students, 23% FRL).
- Market conditions: Rents rising (+1.9%/yr); 127 active listings in the ZIP; 8 comparable units currently listed for rent nearby; rentals lingering (median 46d on market — plan ~5-8 weeks vacancy on turnover, expect pricing pressure); 50% of comp listings sitting > 30 days — soft ceiling on asking rent; solid renter incomes; 675 units permitted in Albany County in 2024 (451 in 5+ unit buildings).
- This rent runs 36% of the median local income ($83k/yr) — at the standard rent-burdened threshold; future hikes will face affordability resistance.
Forward outlook
- Local home prices are declining (-3.0%/yr); year-one equity from $2k of loan paydown is wiped out by about $9k of value loss. Plan a longer hold.
- Albany County population projected at +9% by 2050 — modest demand growth; plan on rents tracking national, not racing it.
Negotiation context
- It's been on market 48 days — a 3% lower offer ($291k) is reasonable based on typical stale-listing flexibility.
- 2 sale attempts since 14y ago with the ask held roughly flat each time — persistent listings suggest the price (not the market) is what's stuck; bring a comps-based counter.
- Current owner paid $245k; 22% above their basis — modest negotiation headroom, anchor on the comps not their cost.
Risks & watch-outs
- Watch-outs: built in 1952 — expect roof / HVAC / electrical / plumbing capex.
Questions for the listing agent
- What do current leases actually rent for vs. the listed asking? Can we see a recent rent roll and the last 12 months of T-12 income?
- It's been on market 48 days. Have you received any prior offers? Is the seller open to a 18% concession, seller financing, or rate buy-down credit?
- Built in 1952 — when were the roof, HVAC, electrical panel, plumbing, and water heater last replaced?
- Is there a deadline driving the sale (1031 exchange, divorce, estate, relocation)? That informs how much negotiation room exists.
- Schools are B-rated — typically a magnet for longer-tenancy family renters. What's the average tenant stay here, and is there a school-zone premium baked into asking?
- The area grade is low — what's the realistic commute time and amenity access for the typical tenant pool here? Any planned neighborhood developments (good or bad) we should know about?
- What's the average days-on-market for RENTAL listings here right now (not sales)? A rising rental-DOM trend means longer vacancies and softer asking-rent achievability than the comps imply.
- What's the recent tenant-quality profile in this submarket — average credit score on applications, eviction rate, late-payment / NSF rate, and stable-employment percentage? A property-management company in the area should have these aggregated.
- How much new for-sale + rental construction is in the pipeline within 1–3 miles? Heavy new supply typically softens prices + rents 12–24 months out; constrained supply supports both.
Investment metrics
- 1% rule
- 0.82% ✗
- Cap rate
- 5.23%
- Cash-on-cash
- -3.80%
- DSCR
- 0.83
- GRM
- 10.1
CMA / ARV
- ARV (median comp)
- $376,785
- List price
- $299,999
- Delta
- -20.38%
- Verdict
- UNDERPRICED
- Comps
- 20 within 1.0 mi
Show comp detail 4 sales within ~0.75 mi
| Address | Dist | Beds/Ba | Sqft | Sold | Price | $/sf | Match |
|---|---|---|---|---|---|---|---|
| 499 Church Rd | 0.16mi | 4/2.5 (+1) | 1,160 (-9%) | 5mo | $275,000 | $237 | 66 |
| 18 Ruth Ter | 0.31mi | 3/1.5 | 1,100 (-14%) | 18mo | $320,000 | $291 | 46 |
| 44 Schoolhouse Rd | 0.43mi | 3/1.5 | 1,081 (-15%) | 20mo | $295,000 | $273 | 36 |
| 10 Oak Dr | 0.67mi | 3/1.0 | 1,380 (+8%) | 21mo | $375,000 | $272 | 33 |
Match score weights: distance 35% · size 25% · config 20% · recency 20%. Top-matched comps best support the ARV.
Projected returns pro-forma
-3.0% appreciation · 1.85% rent growth · sell at horizon
- IRR
- -24.0%
- Equity multiple
- 0.19×
- Total profit
- $-68,242
- Equity at exit
- $44,731
- IRR
- -22.9%
- Equity multiple
- -0.10×
- Total profit
- $-92,052
- Equity at exit
- $25,938
Cash invested: $84,000 (down + closing). Projections, not guarantees.
Landlord ↔ Tenant lean methodology
- Overall (STATE)
- 15 Strongly Tenant-Friendly
- State New York
- 15 Strongly Tenant-Friendly · D+10
- County
- — inherits STATE
- City
- — inherits STATE
ZIP-level market 12203
- Home prices YoY
- -31.0%
- Rents YoY
- 1.9%
- Active inventory
- 127
- Price-to-rent
- 10.1×
Monthly cashflow live
- Estimated rent
- $2,475 high interval (Pro) →
- Mortgage (P&I)
- −$1,573
- Tax from tax record
- −$523 /mo · $6,272/yr
- Insurance
- −$125
- HOA
- −$0
- Vacancy / Maint / Mgmt
- −$520
- Net cashflow
- $-266
Break-even live
Sensitivity live
| Price | -10% $-96 | -5% $-181 | +0% $-266 | +5% $-351 | +10% $-436 |
|---|---|---|---|---|---|
| Rent | -10% $-461 | -5% $-364 | +0% $-266 | +5% $-168 | +10% $-70 |
| Rate | -1.0pp $-115 | -0.5pp $-189 | base $-266 | +0.5pp $-343 | +1.0pp $-423 |
UW: 25.0% down · 7.5% · 30yr · 1.5% tax · 5.0% vac · 8.0% maint · 8.0% mgmt
Financing live
Cash to close
- Down payment
- $75,000
- Closing costs
- $9,000
- Reserves months
- —
- Total cash needed
- —
Loan-product check · same deal, 3 products live
Conventional
25% down · 7.5% · 30yr
- Down + closing
- —
- Monthly P&I
- —
- Monthly cashflow
- —
- DSCR
- —
- Eligible?
- —
Personal DTI + credit; lowest rate.
DSCR
20% down · 8.5% · 30yr
- Down + closing
- —
- Monthly P&I
- —
- Monthly cashflow
- —
- DSCR
- —
- Eligible?
- —
No personal income docs; deal must DSCR.
Hard money
10% down · 12.0% · 12mo
- Down + closing
- —
- Monthly P&I
- —
- Monthly cashflow
- —
- DSCR
- —
- Eligible?
- —
Short-term bridge; refi at stabilization.
Rent comps 8 comps
| Address | Beds | Baths | Sqft | Rent | $/sqft | DOM | Units | Dist |
|---|---|---|---|---|---|---|---|---|
| 1700 Western Ave Albany, NY | 1.0–2.0 | 1.0–2.0 | 1438 | $2,500 | $1.74 | 16d | 1 | 0.36mi |
| 55 Woodlake Rd Albany, NY | 1.0–2.0 | 1.0–2.0 | 903 | $2,050 | $2.27 | 16d | 1 | 0.36mi |
| 1000 Apex Ln Albany, NY | 1.0–3.0 | 1.0–2.0 | 1525 | $4,175 | $2.74 | 16d | 29 | 0.70mi |
| 416 Greenhill Ct Albany, NY | 2.0 | 1.5 | 1350 | $2,200 | $1.63 | 45d | 1 | 1.02mi |
| 190 Church Rd Albany, NY | 3.0 | 1.0 | 875 | $2,600 | $2.97 | 16d | 1 | 1.07mi |
| 1307 Greenwich Dr Albany, NY | 2.0 | 1.0 | 1050 | $2,000 | $1.90 | 45d | 1 | 1.11mi |
| 1 Dresden Ct Albany, NY | 3.0 | 1.5 | 1100 | $2,650 | $2.41 | 45d | 1 | 1.48mi |
| 62 Homestead St Albany, NY | 4.0 | 2.0 | 1600 | $2,600 | $1.62 | 45d | 1 | 1.48mi |
Listing history 20 events
-
2026-06-21days on market $299,999 Active 48 DOM
-
2026-06-18days on market $299,999 Active 45 DOM
-
2026-06-17days on market $299,999 Active 44 DOM
-
2026-06-16days on market $299,999 Active 43 DOM
-
2026-06-15days on market $299,999 Active 42 DOM
-
2026-06-14days on market $299,999 Active 40 DOM
-
2026-06-10days on market $299,999 Active 37 DOM
-
2026-06-09days on market $299,999 Active 36 DOM
-
2026-06-08days on market $299,999 Active 35 DOM
-
2026-06-07days on market $299,999 Active 34 DOM
-
2026-06-05days on market $299,999 Active 31 DOM
-
2026-06-03days on market $299,999 Active 30 DOM
-
2026-06-02days on market $299,999 Active 29 DOM
-
2026-06-01days on market $299,999 Active 28 DOM
-
2026-05-31days on market $299,999 Active 27 DOM
-
2026-05-31days on market $299,999 Active 26 DOM
-
2026-05-04$299,999 Active 699-char remark
-
2012-09-20historical
-
2012-07-09$219,000
-
2006-03-31soldstatus $245,000
ⓘ Source: listings_history table (triggers on properties + properties_extension) + one-shot
backfill from property_details.listing_events for pre-trigger history.
Tax reassessment forecast NY · Partial reset (capped growth)
- Current annual tax
- $6,272 · $523/mo
- Projected year-2 tax
- $6,272 · $523/mo
- Expected delta
- $0/yr ($0/mo · 0.0%)
ⓘ Screening estimate from a state-policy table — verify with the county assessor before closing.
Climate risk First Street
- Flood 1/10 Low FEMA zone X (unshaded) · 0% chance over 30 yrs
- Wildfire 3/10 Moderate
- Heat 4/10 Moderate 7 d/yr ≥98°F today · 17 d/yr by 30 yrs out
- Wind 3/10 Moderate 6% chance of damaging wind over 30 yrs
- Air quality 1/10 Low 0 unhealthy d/yr today · 0 by 30 yrs out
Nearby sold comps map
Loading sold comps map…
Walkable amenities ~0.75 mi
Loading nearby amenities…
Taxation est. · year 1
- Rental income
- $29,699
- − Mortgage interest
- −$16,805
- − Property taxes
- −$6,272
- − Insurance
- −$1,500
- − Repairs & maintenance
- −$2,376
- − Management
- −$2,376
- − Depreciation
- −$8,727
- Taxable loss
- −$8,357
- Est. tax savings @ 24.0%
- +$2,006
- After-tax cash flow
- $-1,183/yr
For passive investors: Depreciation is non-cash, so a rental often shows a tax loss while cash-flowing — sheltering income. Rental losses are passive: they offset passive income freely, and up to $25,000/yr can offset ordinary (W-2) income if you actively participate and your MAGI is under $100k (phasing out to $0 by $150k); unused losses carry forward. On sale, claimed depreciation is recaptured at up to 25%, and gains may owe capital-gains tax (a 1031 exchange can defer both). Figures are a year-1 estimate at your 24.0% rate — not tax advice; consult a CPA.
Schools (NCES district)
- District
- Guilderland Central School District
- NCES district ID
- 3613080
- Math proficiency
- 61% ▼ -8.00%
- Reading proficiency
- 68% ▲ 5.00%
- Median HH income
- $75,669
- Composite
- 57.24/100
- National rank
- #1093
- State rank
- #166 of 590 in NY
Livability — Westmere
- Score
- 69/100
- State rank
- #477
- US rank
- #8403
Category grades
Schools grade is shown separately in the Schools card above.
Census & demographics
- Census place
- Westmere, NY
- County
- Albany County · 196,626 people
- City population
- 30,080
- Metro
- Albany-Schenectady-Troy, NY
- Population (ZIP)
- 30,771
- Household income
- $83,147
- Rent vs Own
- Severe rent burden
- 1704.0
Population outlook (Albany County) Hauer SSP2
- Today (2025)
- 320,794 people
- By 2030
- 327,401 · +2.1%
- By 2040
- 338,218 · +5.4%
- By 2050
- 348,467 · +8.6%
- By 2075
- 381,693 · +19.0%
- By 2100
- 393,809 · +22.8%
Race, ethnicity, and origin ACS 2023
- Neighborhood character
- Predominantly White (69%)
- Race & ethnicity
- White 69% Black 10% Asian 8% Hispanic / Latino 7% Two or more races 7%
- Hispanic origin (detail)
- Mexican 2% Puerto Rican 2%
- Common ancestry
- Romanian 5% Lithuanian 3% Slovak 2%
- Foreign-born
- 16% · Canada, China, South Korea
- Languages at home
- 82% English-only · Other Indo-European 6% Spanish 3% Russian/Polish/Slavic 2%
Political lean MEDSL · Albany
- 2024 margin
- Strong D (+25.8) · D 62.9% · R 37.1%
- 2008→2024 swing
- -3.6pp toward R · 2008: 29.4pp · 2024: 25.8pp
- All cycles
- 2024: D+25.8 2020: D+31.4 2016: D+24.3 2012: D+31.0 2008: D+29.4
Not yet ingested
- Civics
- —
Market trends
- HPI YoY
- ▼ -133.05%
- Current HPI
- 296.0467
- Rent YoY
- ▲ 1.85%
- Metro
- Albany-Schenectady-Troy, NY
- State GDP YoY
- ▲ 2.60%
- F500 in state
- 92
Industry mix (Fortune 500 HQ in NY)
| Industry | F500 HQs | Revenue |
|---|---|---|
| Financial Services | 10 | $950B |
|
||
| Consumer Goods | 9 | $162B |
|
||
| Insurance | 4 | $225B |
|
||
| Telecommunications | 2 | $144B |
|
||
| Pharmaceuticals | 2 | $112B |
|
||
| Media / Entertainment | 2 | $69B |
|
||
Price history
+22.4% since first listed4 events — show timeline
- 2026-05-04 Listed $299,999 Global MLS
- 2012-09-20 Listing Removed — Global MLS
- 2012-07-09 Listed $219,000 Global MLS
- 2006-03-31 Sold (Public Records) $245,000 Public Records
Property tax history
+3.5%/yrLatest (2025): $6,272 · +2.3% YoY. Source: county tax records.
Cash-flow waterfall
monthlySold comps — $/sqft
last 12 mo · ≤1 miLoading sold comps…