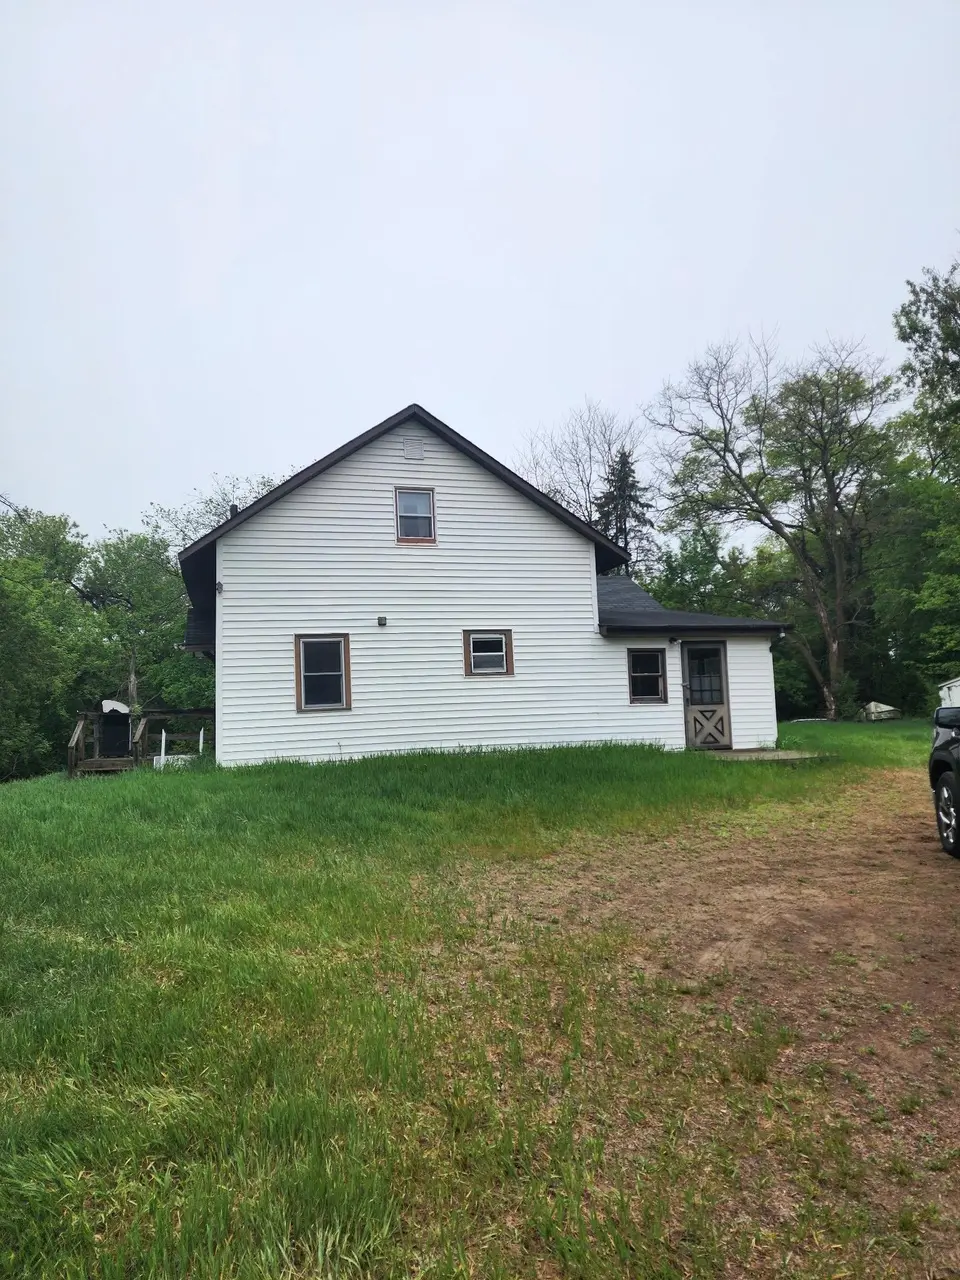
965 Constance Blvd NE · Ham Lake, MN
Flood risk 1/10 · Minimal
- FEMA flood zone
- X (unshaded)
- Chance of flooding over 30 yrs
- 0.0%
- Est. flood insurance / yr
- $507 – $1,088
Fire risk 4/10 · Minor
- Est. fire insurance / yr
- $888 – $1,650
Heat risk 2/10 · Minimal
- Hot days now (above 99°F)
- 7 days/yr
- Hot days in 30 yrs
- 14 days/yr
Wind risk 2/10 · Minimal
- Chance of severe wind over 30 yrs
- —
Air-quality risk 2/10 · Minimal
- Unhealthy air days now
- 1 days/yr
- Unhealthy air days in 30 yrs
- 1 days/yr
Risk factors via First Street. Map © Google.
Why this score? — see what drove the B grade
The composite is a weighted blend of 9 inputs, each scored 0–100. Each bar is that input's sub-score; the figure is the points it added to the 100-point composite (weight × sub-score).
- Cash flow +30.0/30.0
- 1% rule +10.0/10.0
- DSCR +10.0/10.0
- ARV discount +7.5/15.0
- Schools +4.7/10.0
- Livability +3.5/5.0
- Rent growth +2.5/5.0
- Condition / age +2.5/5.0
- Appreciation +0.0/10.0
$124,900
🖨 Deal sheet 📄 Offer letter ✓ Due diligence
Listing remarks
Unique opportunity on a beautiful parcel with endless potential. Property is being sold AS-IS. Please include an AS-IS Addendum in your offer. Existing home will require significate updates and repairs; buyers may choose renovation or redevelopment depending on their goals. Seller will remove any personal property and items they wish to retain prior to closing. Any remaining personal property, debris, materials, vehicles, or miscellaneous items currently on the property shall remain and become the responsibility of the buyer after closing.
Key facts
- 1.4 acre lot
- Built 1920
- Listed 3 days
Property features AI
Exterior
- Parking: Gravel parking
- Utilities: Well water; Septic system not compliant; Natural gas
- Home design: Residential property; One and one-half levels; Main entry on main level
- Construction: Concrete construction; Concrete perimeter foundation; Roof older than 8 years
- Exterior features: Medium tree coverage; Shed(s); Pole building; Workshop; Storage shed; Unpaved street frontage
Interior
- Kitchen: Kitchen on the main level (12x18); Includes microwave, range, refrigerator
- Bedrooms: One bedroom on the main level (10x11)
- Bathrooms: One full bathroom on the main level (8x7)
- Heating & cooling: Forced air heating; Wall-mounted cooling unit(s)
- Interior features: Microwave; Range; Refrigerator; Gas water heater
- Laundry & utility: Washer, Dryer
Neighborhood map
What this means for you Summary
Snapshot
- This is a 1-bed/1.0-bath single-family listed at $125k.
Deal economics
- At list price, monthly cash flow is $678 ($8k/yr) — positive.
- The deal already cash-flows at list — no discount required.
- Meets the 1% rule at list price ($2k rent vs $125k).
- Cap rate 12.8% vs local median 2.9% in Ham Lake — top-decile yield for the area; either an underpriced asset or a hidden risk that comps aren't pricing in. Stress-test before assuming the spread holds.
Location & tenants
- Location reads 69/100 on livability (#358 in MN) — a middle-class / working-renter tenant base. Strengths: crime A+, employment A+, housing A+; Watch: cost of living D, amenities F, commute F.
- Anoka-Hennepin Public School District (suburban): math 49% / reading 55% proficiency, ranked #71 of 301 in MN (top 24%) — acceptable for families but not a draw, mixed tenant base, ~2y average lease.
- Market conditions: 392 active listings in the ZIP; 1,083 units permitted in Anoka County in 2024 (134 in 5+ unit buildings).
Forward outlook
- Local home prices are declining (-3.0%/yr); year-one equity from $864 of loan paydown is wiped out by about $4k of value loss. Plan a longer hold.
- Anoka County population projected at +11% by 2050 — modest demand growth; plan on rents tracking national, not racing it.
- At projected returns (-3.0% appreciation + 3.0% rent growth), your $35k cash investment doubles in ~6 years — after that, you're playing with house money.
Negotiation context
- Only 3 days on market — expect competitive offers; lowballing is unlikely to land.
Risks & watch-outs
- Watch-outs: built in 1920 — expect roof / HVAC / electrical / plumbing capex.
Questions for the listing agent
- Built in 1920 — when were the roof, HVAC, electrical panel, plumbing, and water heater last replaced?
- Is there a deadline driving the sale (1031 exchange, divorce, estate, relocation)? That informs how much negotiation room exists.
- Schools are A-rated — typically a magnet for longer-tenancy family renters. What's the average tenant stay here, and is there a school-zone premium baked into asking?
- What's the average days-on-market for RENTAL listings here right now (not sales)? A rising rental-DOM trend means longer vacancies and softer asking-rent achievability than the comps imply.
- What's the recent tenant-quality profile in this submarket — average credit score on applications, eviction rate, late-payment / NSF rate, and stable-employment percentage? A property-management company in the area should have these aggregated.
- How much new for-sale + rental construction is in the pipeline within 1–3 miles? Heavy new supply typically softens prices + rents 12–24 months out; constrained supply supports both.
Investment metrics
- 1% rule
- 1.56% ✓
- Cap rate
- 12.81%
- Cash-on-cash
- 23.27%
- DSCR
- 2.04
- GRM
- 5.3
CMA / ARV
No comps found within radius.
Projected returns pro-forma
-3.0% appreciation · 3.0% rent growth · sell at horizon
- IRR
- 16.3%
- Equity multiple
- 1.66×
- Total profit
- $22,981
- Equity at exit
- $18,623
- IRR
- 24.9%
- Equity multiple
- 3.17×
- Total profit
- $75,738
- Equity at exit
- $10,799
Cash invested: $34,972 (down + closing). Projections, not guarantees.
Landlord ↔ Tenant lean methodology
- Overall (STATE)
- 46 Balanced
- State Minnesota
- 46 Balanced · D+2
- County
- — inherits STATE
- City
- — inherits STATE
ZIP-level market 55304
- Active inventory
- 392
- Price-to-rent
- 5.3×
Monthly cashflow live
- Estimated rent
- $1,946 medium interval (Pro) →
- Mortgage (P&I)
- −$655
- Tax from tax record
- −$152 /mo · $1,823/yr
- Insurance
- −$52
- HOA
- −$0
- Vacancy / Maint / Mgmt
- −$409
- Net cashflow
- $678
Break-even live
UW: 25.0% down · 7.5% · 30yr · 1.5% tax · 5.0% vac · 8.0% maint · 8.0% mgmt
Financing live
Cash to close
- Down payment
- $31,225
- Closing costs
- $3,747
- Reserves months
- —
- Total cash needed
- —
Loan-product check · same deal, 3 products live
Conventional
25% down · 7.5% · 30yr
- Down + closing
- —
- Monthly P&I
- —
- Monthly cashflow
- —
- DSCR
- —
- Eligible?
- —
Personal DTI + credit; lowest rate.
DSCR
20% down · 8.5% · 30yr
- Down + closing
- —
- Monthly P&I
- —
- Monthly cashflow
- —
- DSCR
- —
- Eligible?
- —
No personal income docs; deal must DSCR.
Hard money
10% down · 12.0% · 12mo
- Down + closing
- —
- Monthly P&I
- —
- Monthly cashflow
- —
- DSCR
- —
- Eligible?
- —
Short-term bridge; refi at stabilization.
Listing history 3 events
-
2026-06-02status $124,900 Pending 3 DOM
-
2026-06-01days on market $124,900 Active 3 DOM
-
2026-05-31days on market $124,900 Active 2 DOM
ⓘ Source: listings_history table (triggers on properties + properties_extension) + one-shot
backfill from property_details.listing_events for pre-trigger history.
Tax reassessment forecast MN · Partial reset (capped growth)
- Current annual tax
- $1,823 · $152/mo
- Projected year-2 tax
- $1,823 · $152/mo
- Expected delta
- $0/yr ($0/mo · 0.0%)
ⓘ Screening estimate from a state-policy table — verify with the county assessor before closing.
Climate risk First Street
- Flood 1/10 Low FEMA zone X (unshaded) · 0% chance over 30 yrs
- Wildfire 4/10 Moderate
- Heat 2/10 Low 7 d/yr ≥99°F today · 14 d/yr by 30 yrs out
- Wind 2/10 Low
- Air quality 2/10 Low 1 unhealthy d/yr today · 1 by 30 yrs out
Nearby sold comps map
Loading sold comps map…
Walkable amenities ~0.75 mi
Loading nearby amenities…
Taxation est. · year 1
- Rental income
- $23,349
- − Mortgage interest
- −$6,996
- − Property taxes
- −$1,823
- − Insurance
- −$624
- − Repairs & maintenance
- −$1,868
- − Management
- −$1,868
- − Depreciation
- −$3,633
- Taxable income
- $6,536
- Est. tax owed @ 24.0%
- −$1,569
- After-tax cash flow
- $6,569/yr
For passive investors: Depreciation is non-cash, so a rental often shows a tax loss while cash-flowing — sheltering income. Rental losses are passive: they offset passive income freely, and up to $25,000/yr can offset ordinary (W-2) income if you actively participate and your MAGI is under $100k (phasing out to $0 by $150k); unused losses carry forward. On sale, claimed depreciation is recaptured at up to 25%, and gains may owe capital-gains tax (a 1031 exchange can defer both). Figures are a year-1 estimate at your 24.0% rate — not tax advice; consult a CPA.
Schools (NCES district)
- District
- Anoka-Hennepin Public School District
- NCES district ID
- 2703180
- Math proficiency
- 49% ▼ -14.00%
- Reading proficiency
- 55% ▼ -10.00%
- Median HH income
- $73,837
- Composite
- 46.7/100
- National rank
- #2400
- State rank
- #71 of 301 in MN
Livability — Ham Lake
- Score
- 69/100
- State rank
- #358
- US rank
- #8400
Category grades
Schools grade is shown separately in the Schools card above.
Census & demographics
- Census place
- Ham Lake, MN
- City population
- 49,452
- Population (ZIP)
- 49,452
Population outlook (Anoka County) Hauer SSP2
- Today (2025)
- 375,223 people
- By 2030
- 387,850 · +3.4%
- By 2040
- 407,239 · +8.5%
- By 2050
- 417,541 · +11.3%
- By 2075
- 448,447 · +19.5%
- By 2100
- 464,954 · +23.9%
Race, ethnicity, and origin ACS 2023
- Neighborhood character
- Predominantly White (88%)
- Race & ethnicity
- White 88% Two or more races 4% Asian 3% Black 3% Hispanic / Latino 2%
- Common ancestry
- Portuguese 14% Romanian 6% Lithuanian 3%
- Foreign-born
- 5% · Canada
- Languages at home
- 94% English-only · Other Asian/Pacific 2% Spanish 1% Russian/Polish/Slavic 1%
Political lean MEDSL · Anoka
- 2024 margin
- Toss-up / Even · D 46.6% · R 51.0% · Other 2.4%
- 2008→2024 swing
- -2.0pp toward R · 2008: -2.4pp · 2024: -4.4pp
- All cycles
- 2024: R+4.4 2020: R+1.9 2016: R+9.7 2012: R+2.6 2008: R+2.4
Not yet ingested
- Civics
- —
Market trends
- HPI YoY
- ▼ -267.68%
- Current HPI
- 242.7122
- Rent YoY
- —
- Metro
- —
- State GDP YoY
- ▲ 2.41%
- F500 in state
- 34
Industry mix (Fortune 500 HQ in MN)
| Industry | F500 HQs | Revenue |
|---|---|---|
| Healthcare | 2 | $407B |
|
||
| Retail | 2 | $150B |
|
||
| Consumer Goods | 2 | $32B |
|
||
| Industrial Machinery | 2 | $6B |
|
||
| Agriculture | 1 | $40B |
|
||
| Healthcare / Medical Devices | 1 | $32B |
|
||
Price history
1 event — show timeline
- 2026-05-29 Listed $124,900 NORTHSTARMLS as Distributed by MLS Grid
Property tax history
+7.1%/yrLatest (2026): $1,823 · +7.2% YoY. Source: county tax records.
Cash-flow waterfall
monthlySold comps — $/sqft
last 12 mo · ≤1 miLoading sold comps…