11561 Buena Vis · Piñon Hills, CA
Flood risk 1/10 · Minimal
- FEMA flood zone
- D
- Chance of flooding over 30 yrs
- 0.0%
- Est. flood insurance / yr
- $544 – $1,084
Fire risk 7/10 · Major
- Est. fire insurance / yr
- $659 – $1,223
Heat risk 6/10 · Moderate
- Hot days now (above 96°F)
- 2 days/yr
- Hot days in 30 yrs
- 3 days/yr
Wind risk 1/10 · Minimal
- Chance of severe wind over 30 yrs
- —
Air-quality risk 9/10 · Severe
- Unhealthy air days now
- 23 days/yr
- Unhealthy air days in 30 yrs
- 27 days/yr
Risk factors via First Street. Map © Google.
Why this score? — see what drove the D grade
The composite is a weighted blend of 9 inputs, each scored 0–100. Each bar is that input's sub-score; the figure is the points it added to the 100-point composite (weight × sub-score).
- ARV discount +10.8/15.0
- Appreciation +10.0/10.0
- Cash flow +6.8/30.0
- Schools +3.7/10.0
- Rent growth +2.5/5.0
- Livability +2.5/5.0
- Condition / age +2.5/5.0
- 1% rule +1.3/10.0
- DSCR +1.0/10.0
$399,000
🖨 Deal sheet (PDF) 📄 Offer letter ✓ Due diligence
Listing remarks
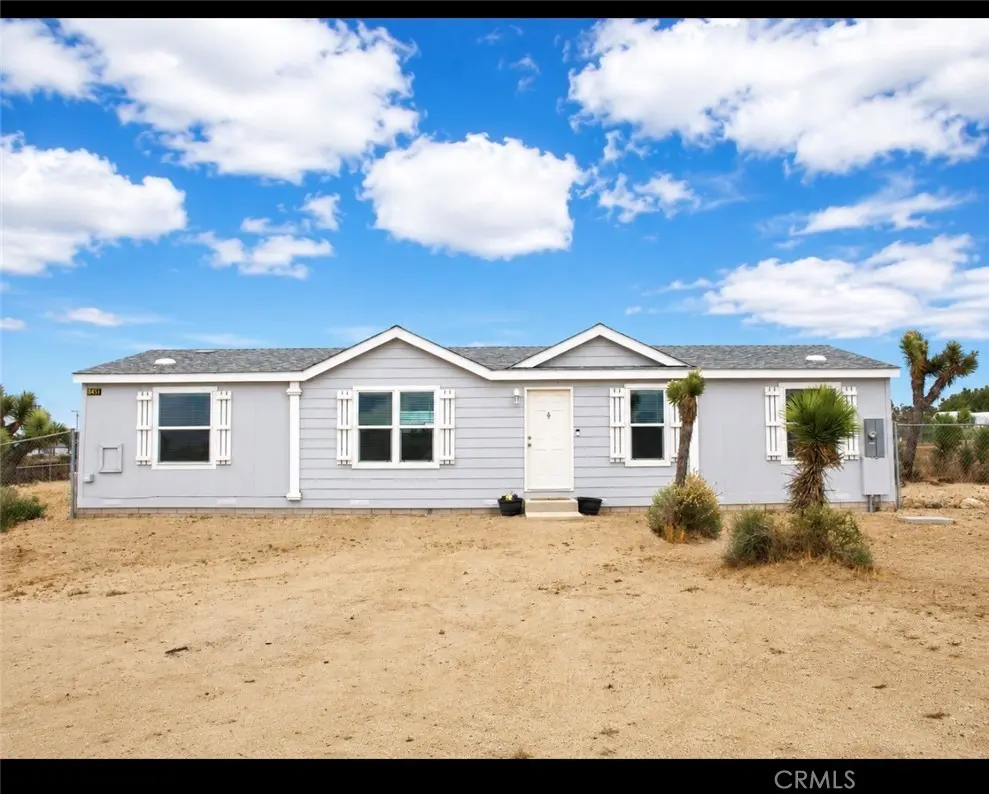
Welcome to your slice of peaceful High Desert living in Pinon Hills! This beautifully built 2023 manufactured home offers the perfect blend of modern comfort and wide-open space. Featuring 4 spacious bedrooms and 2 full bathrooms across 1,303 square feet, the home is thoughtfully designed with a functional layout ideal for families, remote work, or anyone looking to escape the city hustle. Set on an expansive 2.2-acre lot, this property gives you room to breathe, grow, and create—whether you envision animals, outdoor toys, a workshop, or simply enjoying the stunning desert sunsets and mountain views. Inside, you’ll find a bright, open living area, a well-appointed kitchen, and c
Key facts
- Newer construction
- Energy efficiency
- Mountain views
Tags
Property features AI
Finance
- HOA & community: Mountainous community
Exterior
- Parking: RV access/parking; Has parking
- Utilities: Septic tank sewer; District/public water
- Home design: Single-story; Entry on level 1; No accessory dwelling unit
- Construction: Certified 433a foundation
- Exterior features: House structure; No pool; Lot over 40,000 sq ft; Unpaved road access; Has view
Interior
- Bedrooms: 4 bedrooms on the main level
- Bathrooms: 2 full bathrooms on the main level
- Heating & cooling: Central furnace heating; Central air conditioning
- Interior features: One-level home; Entry on main level; Mountainous view
- Laundry & utility: Laundry in an individual room; Utility room
Neighborhood map
What this means for you Summary
Snapshot
- This is a 4-bed/2.0-bath manufactured listed at $399k.
Deal economics
- At list price, monthly cash flow is $-629 ($-8k/yr) — negative.
- To cash-flow at today's rent, offer at most $288k (27.9% below list).
- To meet the 1% rule (rent ≥ 1% of price), the offer needs to be $250k (37.3% below list).
- Recommended offer: $250k (37.3% below list) — sets the bar for 1% rule.
Location & tenants
- Location reads: area grade D — affects rentability + tenant quality, not the cash-flow math above.
- Snowline Joint Unified (rural): math 34% / reading 44% proficiency, ranked #722 of 1,400 in CA (top 52%) — families likely to look elsewhere, expect single-tenant / working-renter base with shorter leases.
- Zoned schools: Heritage (523 students, 53% FRL); Pinon Mesa Middle (788 students, 69% FRL); Serrano High (2,145 students, 62% FRL).
- Market conditions: 168 active listings in the ZIP; 1 comparable units currently listed for rent nearby; 5,458 units permitted in San Bernardino County in 2024 (1,500 in 5+ unit buildings).
Forward outlook
- In year one you build about $43k of equity ($3k loan paydown + $40k appreciation (10.0% local appreciation)).
- San Bernardino County population projected at +15% by 2050 — modest demand growth; plan on rents tracking national, not racing it.
- By year 2, paydown + projected appreciation supports a ~$69k cash-out refi (75% LTV) — recoverable capital for the next deal without selling this one.
Negotiation context
- It's been on market 40 days — a 3% lower offer ($387k) is reasonable based on typical stale-listing flexibility.
- Current owner paid $330k; 21% above their basis — modest negotiation headroom, anchor on the comps not their cost.
Risks & watch-outs
- Climate carrying-cost: major wildfire risk; extreme-heat days projected 2→3/yr by 2055 (HVAC capex compounding) — expect insurance premiums to compound above CPI over the hold.
Questions for the listing agent
- What do current leases actually rent for vs. the listed asking? Can we see a recent rent roll and the last 12 months of T-12 income?
- It's been on market 40 days. Have you received any prior offers? Is the seller open to a 37% concession, seller financing, or rate buy-down credit?
- Is there a deadline driving the sale (1031 exchange, divorce, estate, relocation)? That informs how much negotiation room exists.
- The area grade is low — what's the realistic commute time and amenity access for the typical tenant pool here? Any planned neighborhood developments (good or bad) we should know about?
- What's the average days-on-market for RENTAL listings here right now (not sales)? A rising rental-DOM trend means longer vacancies and softer asking-rent achievability than the comps imply.
- What's the recent tenant-quality profile in this submarket — average credit score on applications, eviction rate, late-payment / NSF rate, and stable-employment percentage? A property-management company in the area should have these aggregated.
- How much new for-sale + rental construction is in the pipeline within 1–3 miles? Heavy new supply typically softens prices + rents 12–24 months out; constrained supply supports both.
Investment metrics
- 1% rule
- 0.63% ✗
- Cap rate
- 4.40%
- Cash-on-cash
- -6.76%
- DSCR
- 0.70
- GRM
- 13.3
CMA / ARV
- ARV (median comp)
- $430,375
- List price
- $399,000
- Delta
- -7.29%
- Verdict
- FAIR
- Comps
- 10 within 1.0 mi
Show comp detail 7 sales within ~0.75 mi
| Address | Dist | Beds/Ba | Sqft | Sold | Price | $/sf | Match |
|---|---|---|---|---|---|---|---|
| 11473 Desert View Rd | 0.19mi | 3/2.0 (-1) | 1,404 (+8%) | 5mo | $415,000 | $296 | 70 |
| 1354 Madera Rd | 0.34mi | 3/2.0 (-1) | 1,248 (-4%) | 8mo | $320,000 | $256 | 65 |
| 11354 Buena Vista Rd | 0.28mi | 4/2.0 | 1,493 (+14%) | 8mo | $400,000 | $268 | 56 |
| 11174 Wintergreen Rd | 0.56mi | 3/2.0 (-1) | 1,248 (-4%) | 12mo | $345,000 | $276 | 51 |
| 11637 Oasis Rd | 0.67mi | 3/2.0 (-1) | 1,344 (+3%) | 11mo | $350,000 | $260 | 50 |
| 1930 Calaveras Rd | 0.64mi | 4/2.0 | 1,344 (+3%) | 21mo | $367,000 | $273 | 48 |
| 971 Goss Rd | 0.70mi | 3/2.0 (-1) | 1,248 (-4%) | 20mo | $348,000 | $279 | 39 |
Match score weights: distance 35% · size 25% · config 20% · recency 20%. Top-matched comps best support the ARV.
Projected returns pro-forma
10.0% appreciation · 3.0% rent growth · sell at horizon
- IRR
- 19.5%
- Equity multiple
- 2.59×
- Total profit
- $177,176
- Equity at exit
- $359,451
- IRR
- 17.9%
- Equity multiple
- 5.95×
- Total profit
- $553,156
- Equity at exit
- $775,169
Cash invested: $111,720 (down + closing). Projections, not guarantees.
Landlord ↔ Tenant lean methodology
- Overall (STATE)
- 18 Strongly Tenant-Friendly
- State California
- 18 Strongly Tenant-Friendly · D+13
- County
- — inherits STATE
- City
- — inherits STATE
ZIP-level market 92372
- Home prices YoY
- 14.8%
- Active inventory
- 168
- Price-to-rent
- 13.3×
Monthly cashflow live
- Estimated rent
- $2,500 medium interval (Pro) →
- Mortgage (P&I)
- −$2,092
- Tax from tax record
- −$346 /mo · $4,146/yr
- Insurance
- −$166
- HOA
- −$0
- Vacancy / Maint / Mgmt
- −$525
- Net cashflow
- $-629
Break-even live
Sensitivity live
| Price | -10% $-403 | -5% $-516 | +0% $-629 | +5% $-742 | +10% $-855 |
|---|---|---|---|---|---|
| Rent | -10% $-827 | -5% $-728 | +0% $-629 | +5% $-530 | +10% $-432 |
| Rate | -1.0pp $-428 | -0.5pp $-528 | base $-629 | +0.5pp $-733 | +1.0pp $-838 |
UW: 25.0% down · 7.5% · 30yr · 1.5% tax · 5.0% vac · 8.0% maint · 8.0% mgmt
Financing live
Cash to close
- Down payment
- $99,750
- Closing costs
- $11,970
- Reserves months
- —
- Total cash needed
- —
Loan-product check · same deal, 3 products live
Conventional
25% down · 7.5% · 30yr
- Down + closing
- —
- Monthly P&I
- —
- Monthly cashflow
- —
- DSCR
- —
- Eligible?
- —
Personal DTI + credit; lowest rate.
DSCR
20% down · 8.5% · 30yr
- Down + closing
- —
- Monthly P&I
- —
- Monthly cashflow
- —
- DSCR
- —
- Eligible?
- —
No personal income docs; deal must DSCR.
Hard money
10% down · 12.0% · 12mo
- Down + closing
- —
- Monthly P&I
- —
- Monthly cashflow
- —
- DSCR
- —
- Eligible?
- —
Short-term bridge; refi at stabilization.
Rent comps 1 comps
| Address | Beds | Baths | Sqft | Rent | $/sqft | DOM | Units | Dist |
|---|---|---|---|---|---|---|---|---|
| 381 Amador Rd Pinon Hills, CA | 3.0 | 2.0 | 1440 | $2,500 | $1.74 | 45d | 1 | 1.41mi |
Listing history 17 events
-
2026-06-21days on market $399,000 Active 40 DOM
-
2026-06-18days on market $399,000 Active 37 DOM
-
2026-06-17days on market $399,000 Active 36 DOM
-
2026-06-16days on market $399,000 Active 35 DOM
-
2026-06-15days on market $399,000 Active 34 DOM
-
2026-06-13days on market $399,000 Active 32 DOM
-
2026-06-09days on market $399,000 Active 28 DOM
-
2026-06-08days on market $399,000 Active 27 DOM
-
2026-06-07days on market $399,000 Active 26 DOM
-
2026-06-04days on market $399,000 Active 23 DOM
-
2026-06-03days on market $399,000 Active 22 DOM
-
2026-06-02pricedays on market $399,000 Active 21 DOM
-
2026-06-01days on market $410,000 Active 20 DOM
-
2026-05-31days on market $410,000 Active 19 DOM
-
2026-05-12$410,000 Active 1155-char remark
-
2024-03-28soldstatus $330,000
-
2023-03-24soldstatus $49,000
ⓘ Source: listings_history table (triggers on properties + properties_extension) + one-shot
backfill from property_details.listing_events for pre-trigger history.
Tax reassessment forecast CA · Resets to sale price
- Current annual tax
- $4,146 · $346/mo
- Projected year-2 tax
- $4,146 · $346/mo
- Expected delta
- $0/yr ($0/mo · 0.0%)
ⓘ Screening estimate from a state-policy table — verify with the county assessor before closing.
Climate risk First Street
- Flood 1/10 Low FEMA zone D · 0% chance over 30 yrs
- Wildfire 7/10 Severe
- Heat 6/10 Major 2 d/yr ≥96°F today · 3 d/yr by 30 yrs out
- Wind 1/10 Low
- Air quality 9/10 Extreme 23 unhealthy d/yr today · 27 by 30 yrs out
Nearby sold comps map
Loading sold comps map…
Walkable amenities ~0.75 mi
Loading nearby amenities…
Taxation est. · year 1
- Rental income
- $30,000
- − Mortgage interest
- −$22,350
- − Property taxes
- −$4,146
- − Insurance
- −$1,995
- − Repairs & maintenance
- −$2,400
- − Management
- −$2,400
- − Depreciation
- −$11,607
- Taxable loss
- −$14,899
- Est. tax savings @ 24.0%
- +$3,576
- After-tax cash flow
- $-3,975/yr
For passive investors: Depreciation is non-cash, so a rental often shows a tax loss while cash-flowing — sheltering income. Rental losses are passive: they offset passive income freely, and up to $25,000/yr can offset ordinary (W-2) income if you actively participate and your MAGI is under $100k (phasing out to $0 by $150k); unused losses carry forward. On sale, claimed depreciation is recaptured at up to 25%, and gains may owe capital-gains tax (a 1031 exchange can defer both). Figures are a year-1 estimate at your 24.0% rate — not tax advice; consult a CPA.
Schools (NCES district)
- District
- Snowline Joint Unified
- NCES district ID
- 0636970
- Math proficiency
- 34% ▲ 1.00%
- Reading proficiency
- 44% ▬ 0.00%
- Median HH income
- $57,625
- Composite
- 36.84/100
- National rank
- #9157
- State rank
- #722 of 1400 in CA
Livability — Piñon Hills
No livability data for this city. (Only ~50 U.S. cities are tracked.)
Census & demographics
- Census place
- Piñon Hills, CA
- City population
- 4,854
- Population (ZIP)
- 4,854
Population outlook (San Bernardino County) Hauer SSP2
- Today (2025)
- 2,300,329 people
- By 2030
- 2,378,907 · +3.4%
- By 2040
- 2,523,137 · +9.7%
- By 2050
- 2,642,388 · +14.9%
- By 2075
- 2,880,769 · +25.2%
- By 2100
- 2,909,436 · +26.5%
Race, ethnicity, and origin ACS 2023
- Neighborhood character
- Diverse neighborhood (Simpson 0.58)
- Race & ethnicity
- White 53% Hispanic / Latino 37% Two or more races 14% Asian 6%
- Hispanic origin (detail)
- Mexican 23% Puerto Rican 1%
- Common ancestry
- Italian 4% Iranian 3% Lithuanian 2%
- Foreign-born
- 15% · Canada, South Korea
- Languages at home
- 79% English-only · Spanish 15% Korean 4% Tagalog/Filipino 1%
Political lean MEDSL · San Bernardino
- 2024 margin
- Toss-up / Even · D 47.5% · R 49.7% · Other 2.8%
- 2008→2024 swing
- -8.5pp toward R · 2008: 6.3pp · 2024: -2.1pp
- All cycles
- 2024: R+2.1 2020: D+10.7 2016: D+9.8 2012: D+5.4 2008: D+6.3
Not yet ingested
- Civics
- —
Market trends
- HPI YoY
- ▲ 49.25%
- Current HPI
- 383.0737
- Rent YoY
- —
- Metro
- —
- State GDP YoY
- ▲ 3.21%
- F500 in state
- 116
Industry mix (Fortune 500 HQ in CA)
| Industry | F500 HQs | Revenue |
|---|---|---|
| Technology | 27 | $1,492B |
|
||
| Financial Services | 3 | $174B |
|
||
| Retail | 3 | $44B |
|
||
| Insurance | 3 | $26B |
|
||
| Media / Entertainment | 2 | $115B |
|
||
| Pharmaceuticals / Biotech | 2 | $62B |
|
||
Price history
+714.3% since first listed4 events — show timeline
- 2026-06-02 Price Changed $399,000 CRMLS
- 2026-05-12 Listed $410,000 CRMLS
- 2024-03-28 Sold (Public Records) $330,000 Public Records
- 2023-03-24 Sold (Public Records) $49,000 Public Records
Property tax history
+27.0%/yrLatest (2025): $4,146 · +384.5% YoY. Source: county tax records.
Cash-flow waterfall
monthlySold comps — $/sqft
last 12 mo · ≤1 miLoading sold comps…