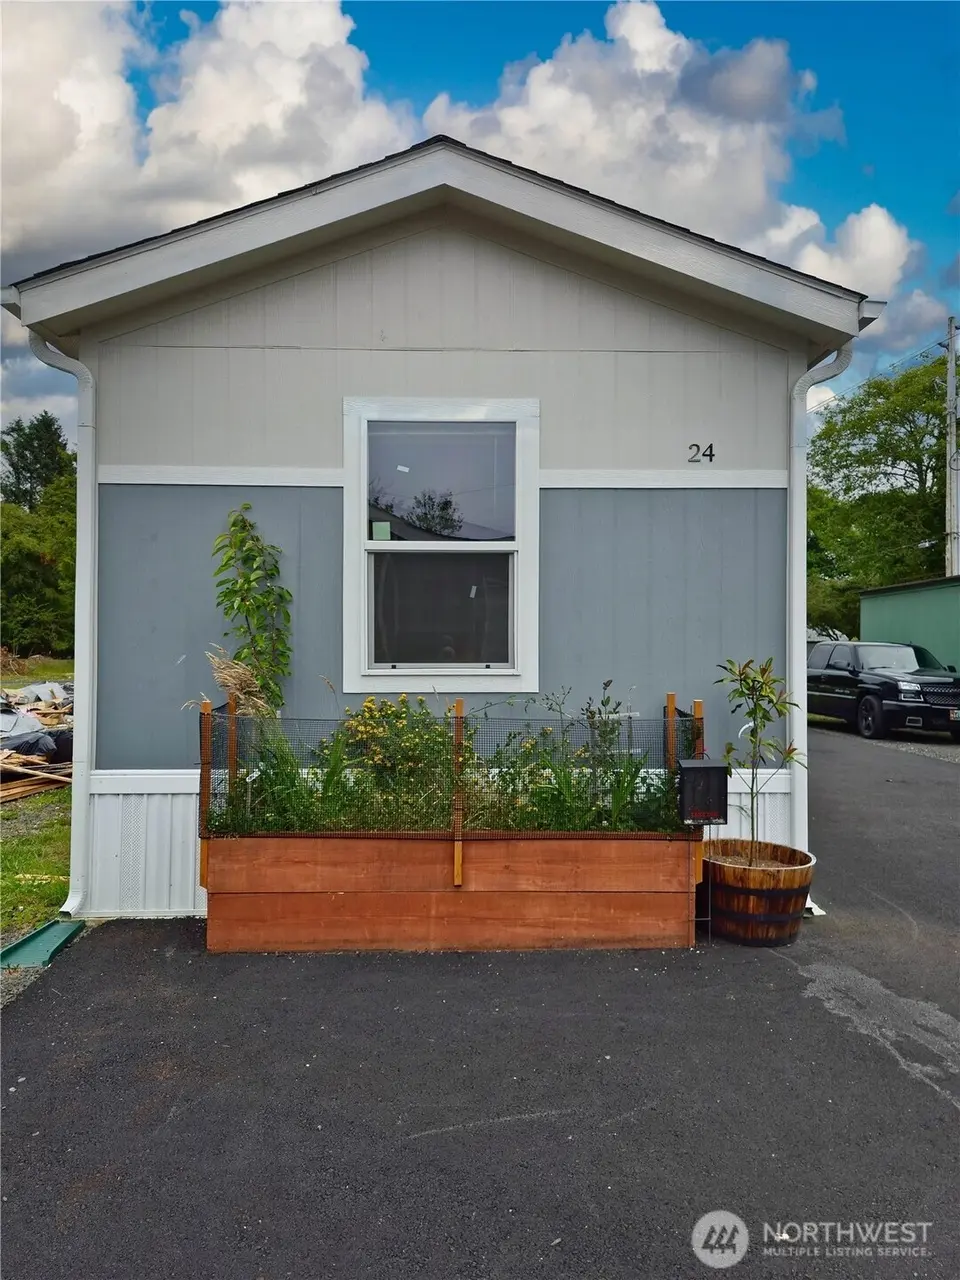
1303 30th #24 · Ocean Park, WA
Flood risk 5/10 · Moderate
- FEMA flood zone
- X (unshaded)
- Chance of flooding over 30 yrs
- 0.24%
- Est. flood insurance / yr
- $507 – $1,088
Fire risk 1/10 · Minimal
- Est. fire insurance / yr
- $604 – $1,122
Heat risk 1/10 · Minimal
- Hot days now (above 74°F)
- 8 days/yr
- Hot days in 30 yrs
- 17 days/yr
Wind risk 1/10 · Minimal
- Chance of severe wind over 30 yrs
- —
Air-quality risk 5/10 · Moderate
- Unhealthy air days now
- 6 days/yr
- Unhealthy air days in 30 yrs
- 6 days/yr
Risk factors via First Street. Map © Google.
Why this score? — see what drove the C+ grade
The composite is a weighted blend of 9 inputs, each scored 0–100. Each bar is that input's sub-score; the figure is the points it added to the 100-point composite (weight × sub-score).
- Cash flow +26.7/30.0
- DSCR +9.2/10.0
- 1% rule +7.2/10.0
- ARV discount +5.3/15.0
- Condition / age +4.0/5.0
- Schools +3.7/10.0
- Livability +3.6/5.0
- Rent growth +2.5/5.0
- Appreciation +0.0/10.0
$149,900
🖨 Deal sheet 📄 Offer letter ✓ Due diligence
Listing remarks
Brand New Palm Harbor home. Owner financing at 6% over 15 years with 20k down. Own for less than rent!! Well maintained and managed. Outfitted with all new underground utilities including water, sewer, & pavement! A perfect beach cottage for year around living or for weekend getaways. This lovely 2-bedroom, 840 square foot home never been lived in! New appliances, and a dedicated parking spot. No land ownership required. Located walking distance to the Ocean Beaches and Discovery Trail. Located between Ilwaco & Long Beach with easy access to the State Parks, Port of Ilwaco, shopping, restaurants, and Astoria. Schedule a tour today! 1, 2, and 3 bedroom homes available.
Key facts
- Parking
- Built 2024
- Listed 334 days
Tags
Neighborhood map
What this means for you Summary
Snapshot
- This is a 2-bed/1.0-bath manufactured listed at $150k. Condition is rated good.
Deal economics
- At list price, monthly cash flow is $405 ($5k/yr) — positive.
- The deal already cash-flows at list — no discount required.
- Meets the 1% rule at list price ($2k rent vs $150k).
- Recommended offer: $132k (12.0% below list) — sets the bar for market timing.
- Cap rate 9.5% vs local median 4.2% in Ocean Park — top-decile yield for the area; either an underpriced asset or a hidden risk that comps aren't pricing in. Stress-test before assuming the spread holds.
Location & tenants
- Location reads 72/100 on livability (#216 in WA) — a middle-class / working-renter tenant base. Strengths: housing A+, health & safety A+, crime A; Watch: commute D+, employment D+, schools F.
- Ocean Beach School District (rural): math 34% / reading 50% proficiency, ranked #212 of 291 in WA (top 73%) — families likely to look elsewhere, expect single-tenant / working-renter base with shorter leases.
- Market conditions: 311 active listings in the ZIP; 90 units permitted in Pacific County in 2024 (0 in 5+ unit buildings).
Forward outlook
- Local home prices are declining (-3.0%/yr); year-one equity from $1k of loan paydown is wiped out by about $4k of value loss. Plan a longer hold.
- Pacific County population projected at -10% by 2050 — secular population decline; favor cash flow + early exit over multi-decade hold.
- At projected returns (-3.0% appreciation + 3.0% rent growth), your $42k cash investment doubles in ~10 years — after that, you're playing with house money.
Negotiation context
- It's been on market 334 days — a 12% lower offer ($132k) is reasonable based on typical stale-listing flexibility.
- 2 sale attempts with the ask held roughly flat each time — persistent listings suggest the price (not the market) is what's stuck; bring a comps-based counter.
Risks & watch-outs
- Climate carrying-cost: moderate flood risk — expect insurance premiums to compound above CPI over the hold.
Questions for the listing agent
- It's been on market 334 days. Have you received any prior offers? Is the seller open to a 12% concession, seller financing, or rate buy-down credit?
- Why hasn't it sold? Are there any deal-killer items the seller is aware of (foundation, flood, title, zoning, code violations)?
- Is there a deadline driving the sale (1031 exchange, divorce, estate, relocation)? That informs how much negotiation room exists.
- Schools are F-rated, which usually means shorter tenancies and higher turnover. Who's the typical renter profile here, and what's been the actual vacancy rate?
- What's the average days-on-market for RENTAL listings here right now (not sales)? A rising rental-DOM trend means longer vacancies and softer asking-rent achievability than the comps imply.
- What's the recent tenant-quality profile in this submarket — average credit score on applications, eviction rate, late-payment / NSF rate, and stable-employment percentage? A property-management company in the area should have these aggregated.
- How much new for-sale + rental construction is in the pipeline within 1–3 miles? Heavy new supply typically softens prices + rents 12–24 months out; constrained supply supports both.
Investment metrics
- 1% rule
- 1.22% ✓
- Cap rate
- 9.54%
- Cash-on-cash
- 11.58%
- DSCR
- 1.52
- GRM
- 6.8
CMA / ARV
- ARV (median comp)
- $142,765
- List price
- $149,900
- Delta
- 5.00%
- Verdict
- FAIR
- Comps
- 2 within 1.0 mi
Projected returns pro-forma
-3.0% appreciation · 3.0% rent growth · sell at horizon
- IRR
- 1.0%
- Equity multiple
- 1.04×
- Total profit
- $1,544
- Equity at exit
- $22,351
- IRR
- 10.6%
- Equity multiple
- 1.83×
- Total profit
- $34,686
- Equity at exit
- $12,961
Cash invested: $41,972 (down + closing). Projections, not guarantees.
Landlord ↔ Tenant lean methodology
- Overall (STATE)
- 28 Tenant-Leaning
- State Washington
- 28 Tenant-Leaning · D+8
- County
- — inherits STATE
- City
- — inherits STATE
ZIP-level market 98640
- Home prices YoY
- -26.7%
- Active inventory
- 311
- Price-to-rent
- 6.8×
Monthly cashflow live
- Estimated rent
- $1,824 medium interval (Pro) →
- Mortgage (P&I)
- −$786
- Tax est. 1.5%
- −$187 /mo · $2,248/yr
- Insurance
- −$62
- HOA
- −$0
- Vacancy / Maint / Mgmt
- −$383
- Net cashflow
- $405
Break-even live
UW: 25.0% down · 7.5% · 30yr · 1.5% tax · 5.0% vac · 8.0% maint · 8.0% mgmt
Financing live
Cash to close
- Down payment
- $37,475
- Closing costs
- $4,497
- Reserves months
- —
- Total cash needed
- —
Loan-product check · same deal, 3 products live
Conventional
25% down · 7.5% · 30yr
- Down + closing
- —
- Monthly P&I
- —
- Monthly cashflow
- —
- DSCR
- —
- Eligible?
- —
Personal DTI + credit; lowest rate.
DSCR
20% down · 8.5% · 30yr
- Down + closing
- —
- Monthly P&I
- —
- Monthly cashflow
- —
- DSCR
- —
- Eligible?
- —
No personal income docs; deal must DSCR.
Hard money
10% down · 12.0% · 12mo
- Down + closing
- —
- Monthly P&I
- —
- Monthly cashflow
- —
- DSCR
- —
- Eligible?
- —
Short-term bridge; refi at stabilization.
Listing history 7 events
-
2026-06-07statusdays on market $149,900 Pending 334 DOM
-
2026-06-03days on market $149,900 Active 332 DOM
-
2026-06-02days on market $149,900 Active 331 DOM
-
2026-06-01days on market $149,900 Active 330 DOM
-
2026-05-31days on market $149,900 Active 329 DOM
-
2026-05-18status Active
-
2025-07-03$149,900 Active
ⓘ Source: listings_history table (triggers on properties + properties_extension) + one-shot
backfill from property_details.listing_events for pre-trigger history.
Climate risk First Street
- Flood 5/10 Major FEMA zone X (unshaded) · 24% chance over 30 yrs
- Wildfire 1/10 Low
- Heat 1/10 Low 8 d/yr ≥74°F today · 17 d/yr by 30 yrs out
- Wind 1/10 Low
- Air quality 5/10 Major 6 unhealthy d/yr today · 6 by 30 yrs out
Nearby sold comps map
Loading sold comps map…
Walkable amenities ~0.75 mi
Loading nearby amenities…
Taxation est. · year 1
- Rental income
- $21,890
- − Mortgage interest
- −$8,397
- − Property taxes
- −$2,248
- − Insurance
- −$750
- − Repairs & maintenance
- −$1,751
- − Management
- −$1,751
- − Depreciation
- −$4,361
- Taxable income
- $2,632
- Est. tax owed @ 24.0%
- −$632
- After-tax cash flow
- $4,230/yr
For passive investors: Depreciation is non-cash, so a rental often shows a tax loss while cash-flowing — sheltering income. Rental losses are passive: they offset passive income freely, and up to $25,000/yr can offset ordinary (W-2) income if you actively participate and your MAGI is under $100k (phasing out to $0 by $150k); unused losses carry forward. On sale, claimed depreciation is recaptured at up to 25%, and gains may owe capital-gains tax (a 1031 exchange can defer both). Figures are a year-1 estimate at your 24.0% rate — not tax advice; consult a CPA.
Condition & rehab AI · 12 photos
This well-maintained and newly renovated manufactured home is move-in ready and offers a great value for both resale and rental purposes.
Value-add opportunities
- Both Painting interior walls — Fresh paint can enhance the home's appearance and value.
- Both Landscaping improvements — Enhanced landscaping can increase curb appeal and property value.
- Both Add a small outdoor seating area — This can increase the home's appeal for both resale and rental purposes.
- Both Install a smart thermostat — This can improve energy efficiency and add a modern touch to the home.
Renovation cost estimate screening
Value-add ROI direction
- Both Painting interior walls — Fresh paint can enhance the home's appearance and value. ↑
- Both Landscaping improvements — Enhanced landscaping can increase curb appeal and property value. ↑
- Both Add a small outdoor seating area — This can increase the home's appeal for both resale and rental purposes. ↑
- Both Install a smart thermostat — This can improve energy efficiency and add a modern touch to the home. ↑
ⓘ Cost ranges are severity-bucket heuristics (US national rule-of-thumb). Get contractor quotes + a written scope before underwriting a rehab budget.
Schools (NCES district)
- District
- Ocean Beach School District
- NCES district ID
- 5306060
- Math proficiency
- 34% ▼ -1.00%
- Reading proficiency
- 50% ▲ 1.00%
- Median HH income
- $38,549
- Composite
- 37.37/100
- National rank
- #8929
- State rank
- #212 of 291 in WA
Livability — Ocean Park
- Score
- 72/100
- State rank
- #216
- US rank
- #6161
Category grades
Schools grade is shown separately in the Schools card above.
Census & demographics
- Population (ZIP)
- 5,107
Population outlook (Pacific County) Hauer SSP2
- Today (2025)
- 20,636 people
- By 2030
- 20,137 · -2.4%
- By 2040
- 19,041 · -7.7%
- By 2050
- 18,504 · -10.3%
- By 2075
- 17,403 · -15.7%
- By 2100
- 16,241 · -21.3%
Race, ethnicity, and origin ACS 2023
- Neighborhood character
- Predominantly White (88%)
- Race & ethnicity
- White 88% Two or more races 6% Hispanic / Latino 6% Asian 3%
- Hispanic origin (detail)
- Mexican 5%
- Common ancestry
- Portuguese 5% Lithuanian 4% Slovak 4%
- Foreign-born
- 7% · Canada, China
- Languages at home
- 92% English-only · Spanish 4% Chinese 1% German/W. Germanic 1%
Political lean MEDSL · Pacific
- 2024 margin
- Toss-up / Even · D 48.1% · R 49.4% · Other 2.4%
- 2008→2024 swing
- -15.4pp toward R · 2008: 14.1pp · 2024: -1.3pp
- All cycles
- 2024: R+1.3 2020: R+1.1 2016: R+6.9 2012: D+11.4 2008: D+14.1
Not yet ingested
- Civics
- —
Market trends
- HPI YoY
- ▼ -81.15%
- Current HPI
- 222.8758
- Rent YoY
- —
- Metro
- —
- State GDP YoY
- ▲ 4.65%
- F500 in state
- 22
Industry mix (Fortune 500 HQ in WA)
| Industry | F500 HQs | Revenue |
|---|---|---|
| Retail | 2 | $269B |
|
||
| Technology / Retail | 1 | $638B |
|
||
| Technology | 1 | $245B |
|
||
| Telecommunications | 1 | $38B |
|
||
| Food / Beverage | 1 | $36B |
|
||
| Automotive / Trucks | 1 | $34B |
|
||
Price history
2 events — show timeline
- 2026-05-18 Relisted — NWMLS as Distributed by MLS Grid
- 2025-07-03 Listed $149,900 NWMLS as Distributed by MLS Grid
Cash-flow waterfall
monthlySold comps — $/sqft
last 12 mo · ≤1 miLoading sold comps…