 9-Plex
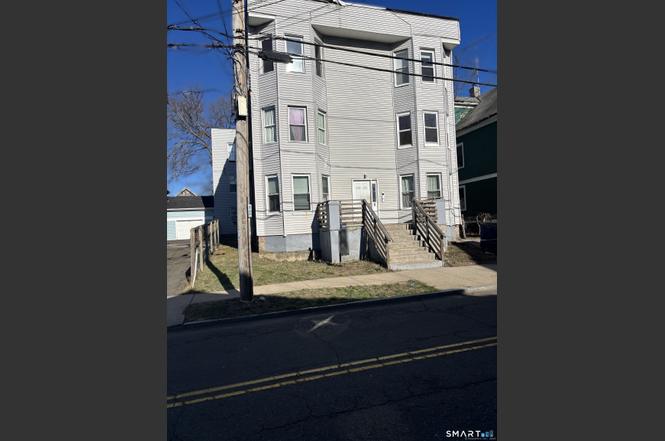
373 Blatchley Ave · New Haven, CT
Flood risk 1/10 · Minimal
- FEMA flood zone
- X (unshaded)
- Chance of flooding over 30 yrs
- 0.0%
- Est. flood insurance / yr
- $473 – $860
Fire risk 1/10 · Minimal
- Est. fire insurance / yr
- $829 – $1,539
Heat risk 7/10 · Major
- Hot days now (above 99°F)
- 7 days/yr
- Hot days in 30 yrs
- 16 days/yr
Wind risk 6/10 · Moderate
- Chance of severe wind over 30 yrs
- 56.0%
Air-quality risk 5/10 · Moderate
- Unhealthy air days now
- 6 days/yr
- Unhealthy air days in 30 yrs
- 8 days/yr
Risk factors via First Street. Map © Google.
Why this score? — see what drove the B- grade
The composite is a weighted blend of 9 inputs, each scored 0–100. Each bar is that input's sub-score; the figure is the points it added to the 100-point composite (weight × sub-score).
- Cash flow +30.0/30.0
- DSCR +10.0/10.0
- 1% rule +9.6/10.0
- ARV discount +7.5/15.0
- Livability +4.0/5.0
- Rent growth +3.5/5.0
- Condition / age +2.5/5.0
- Schools +1.5/10.0
- Appreciation +0.0/10.0
$1,100,000
🖨 Deal sheet 📄 Offer letter ✓ Due diligence
Multi-family units
County records classify this as Multi-Family (5+ Unit). Listing-text estimate: 9 units. confirmed
5+ unit building — per-unit beds/baths from public records are typically unavailable; the breakdown below (if shown) is an estimate from the listing text.
Listing remarks
Rare 9-unit multifamily opportunity offering significant value-add potential in a strong New Haven rental market. The property features oversized units with abundant natural light and separate, tenant-paid utilities. Several units include updated kitchens and baths, and some are equipped with high-efficiency Navien systems, providing a solid foundation for improvements. The property currently presents a lease-up and renovation opportunity for investors seeking to reposition and stabilize an asset with substantial upside. Market rents in the area support strong income potential, with 1-bedroom units achieving approximately $1,350/month and 2-bedrooms approximately $1,600/month. Ideally locat
Key facts
- Oversized units
- Updated kitchens
- 6,098 sq ft lot
Tags
Neighborhood map
What this means for you Summary
Snapshot
- This is a 9 × 1-bed/1.0-bath units multifamily listed at $1.10M.
Deal economics
- At list price, monthly cash flow is $5k ($60k/yr) — positive. Per door: $559/mo.
- The deal already cash-flows at list — no discount required.
- Meets the 1% rule at list price ($16k rent vs $1.10M).
- Recommended offer: $1.07M (3.0% below list) — sets the bar for market timing.
- Cap rate 11.8% vs local median 4.8% in New Haven — top-decile yield for the area; either an underpriced asset or a hidden risk that comps aren't pricing in. Stress-test before assuming the spread holds.
Location & tenants
- Location reads 79/100 on livability (#31 in CT, #2,190 nationally) — a middle-class / working-renter tenant base. Strengths: amenities A+, commute A+, health & safety A+; Watch: schools D+, employment D, crime F.
- New Haven School District (urban): math 12% / reading 25% proficiency, ranked #147 of 153 in CT (top 96%) — low school quality limits family demand, transient renter base, plan for 1-2y turnover; 66% free/reduced lunch — lower-income household profile, screen leases tightly.
- Market conditions: Rents rising fast (+4.1%/yr); 101 active listings in the ZIP; 1 comparable units currently listed for rent nearby; 1,059 units permitted in South Central Connecticut Planning Region in 2024 (779 in 5+ unit buildings).
- At $16,065/mo this rent would consume 397% of the median local household income ($48k/yr) (locally 2664% of renters already pay >50% of income on rent) — very limited rent-growth headroom before tenants either downsize or default.
Forward outlook
- Local home prices are declining (-3.0%/yr); year-one equity from $8k of loan paydown is wiped out by about $33k of value loss. Plan a longer hold.
- At projected returns (-3.0% appreciation + 4.1% rent growth), your $308k cash investment doubles in ~6 years — after that, you're playing with house money.
Negotiation context
- It's been on market 36 days — a 3% lower offer ($1.07M) is reasonable based on typical stale-listing flexibility.
- 16 sale attempts since 19y ago with the ask held roughly flat each time — persistent listings suggest the price (not the market) is what's stuck; bring a comps-based counter.
- Current owner paid $375k; list at $1.10M implies a 193% gain — meaningful room to come down on a strong offer.
Risks & watch-outs
- Watch-outs: built in 1910 — expect roof / HVAC / electrical / plumbing capex.
- Climate carrying-cost: major wind risk, 56% chance of damaging wind over 30y; extreme-heat days projected 7→16/yr by 2055 (HVAC capex compounding) — expect insurance premiums to compound above CPI over the hold.
Questions for the listing agent
- It's been on market 36 days. Have you received any prior offers? Is the seller open to a 3% concession, seller financing, or rate buy-down credit?
- Can we see the unit-by-unit rent roll, current vacancy, and any below-market leases? What's the average tenancy length?
- What capital expenditures (roof, boiler, parking lot, exteriors) have been made in the last 5 years, and what's planned in the next 2?
- Built in 1910 — when were the roof, HVAC, electrical panel, plumbing, and water heater last replaced?
- Is there a deadline driving the sale (1031 exchange, divorce, estate, relocation)? That informs how much negotiation room exists.
- Schools are D-rated, which usually means shorter tenancies and higher turnover. Who's the typical renter profile here, and what's been the actual vacancy rate?
- Crime grade is F in this area — have there been break-ins, vandalism, or insurance claims at this property in the last 3 years? What carrier currently insures it and at what premium?
- What's the average days-on-market for RENTAL listings here right now (not sales)? A rising rental-DOM trend means longer vacancies and softer asking-rent achievability than the comps imply.
- What's the recent tenant-quality profile in this submarket — average credit score on applications, eviction rate, late-payment / NSF rate, and stable-employment percentage? A property-management company in the area should have these aggregated.
- How much new apartment / multifamily construction is in the pipeline within 1–3 miles? Heavy new supply (>2% of stock underway) typically softens rents 12–24 months out; light construction supports rent growth.
Investment metrics
- 1% rule
- 1.46% ✓
- Cap rate
- 11.78%
- Cash-on-cash
- 19.59%
- DSCR
- 1.87
- GRM
- 5.7
CMA / ARV
No comps found within radius.
Projected returns pro-forma
-3.0% appreciation · 4.12% rent growth · sell at horizon
- IRR
- 12.9%
- Equity multiple
- 1.52×
- Total profit
- $160,610
- Equity at exit
- $164,014
- IRR
- 22.7%
- Equity multiple
- 3.05×
- Total profit
- $630,243
- Equity at exit
- $95,108
Cash invested: $308,000 (down + closing). Projections, not guarantees.
Landlord ↔ Tenant lean methodology
- Overall (STATE)
- 27 Tenant-Leaning
- State Connecticut
- 27 Tenant-Leaning · D+7
- County
- — inherits STATE
- City
- — inherits STATE
ZIP-level market 06513
- Home prices YoY
- -7.8%
- Rents YoY
- 4.1%
- Active inventory
- 101
- Price-to-rent
- 51.4×
Monthly cashflow live
- Estimated rent
- $16,065 high interval (Pro) →
- Mortgage (P&I)
- −$5,769
- Tax from tax record
- −$1,436 /mo · $17,231/yr
- Insurance
- −$458
- HOA
- −$0
- Vacancy / Maint / Mgmt
- −$3,374
- Net cashflow
- $5,029
Break-even live
9-unit breakdown (identical units grouped — click to expand)
| Units | Beds | Baths | Est. rent |
|---|---|---|---|
| 9× units | 1 | 1 | $16,065 |
| #1 | 1 | 1 | $1,785 |
| #2 | 1 | 1 | $1,785 |
| #3 | 1 | 1 | $1,785 |
| #4 | 1 | 1 | $1,785 |
| #5 | 1 | 1 | $1,785 |
| #6 | 1 | 1 | $1,785 |
| #7 | 1 | 1 | $1,785 |
| #8 | 1 | 1 | $1,785 |
| #9 | 1 | 1 | $1,785 |
| Total (9 units) | $16,065 | ||
UW: 25.0% down · 7.5% · 30yr · 1.5% tax · 5.0% vac · 8.0% maint · 8.0% mgmt
Financing live
Cash to close
- Down payment
- $275,000
- Closing costs
- $33,000
- Reserves months
- —
- Total cash needed
- —
Loan-product check · same deal, 3 products live
Conventional
25% down · 7.5% · 30yr
- Down + closing
- —
- Monthly P&I
- —
- Monthly cashflow
- —
- DSCR
- —
- Eligible?
- —
Personal DTI + credit; lowest rate.
DSCR
20% down · 8.5% · 30yr
- Down + closing
- —
- Monthly P&I
- —
- Monthly cashflow
- —
- DSCR
- —
- Eligible?
- —
No personal income docs; deal must DSCR.
Hard money
10% down · 12.0% · 12mo
- Down + closing
- —
- Monthly P&I
- —
- Monthly cashflow
- —
- DSCR
- —
- Eligible?
- —
Short-term bridge; refi at stabilization.
Rent comps 1 comps
| Address | Beds | Baths | Sqft | Rent | $/sqft | DOM | Units | Dist |
|---|---|---|---|---|---|---|---|---|
| 189 Wooster St New Haven, CT | 9.0 | 5.0 | 5631 | $2,895 | $0.51 | 2d | 1 | 1.17mi |
Listing history 37 events
-
2026-03-20status Under Contract
-
2026-02-10$1,100,000 Active
-
2026-01-31historical
-
2026-01-26status Active
-
2026-01-05historical Under Contract - Continue to Show
-
2025-12-17price $1,190,000
-
2025-11-03price $1,200,000
-
2025-08-12$1,240,000 Active
-
2025-07-11historical
-
2025-03-25$1,250,000 Active
-
2025-02-19historical
-
2024-08-21$1,250,000 Active
-
2023-01-11historical
-
2023-01-05$1,300,000 Active
-
2015-03-13historical
-
2014-07-12historical
-
2014-06-12$250,000
-
2013-07-11$250,000
-
2012-10-28historical
-
2012-09-07$239,900
-
2012-09-06historical
-
2012-07-18$269,900
-
2012-07-18historical
-
2012-06-25$274,900
-
2012-06-25historical
-
2012-02-02$299,900
-
2012-02-01historical
-
2011-11-22$319,900
-
2011-11-22historical
-
2011-10-29$359,900
-
2011-04-02historical
-
2010-04-03$399,900
-
2007-09-22historical
-
2007-03-23$649,000
-
2004-04-29soldstatus $375,000
-
2002-09-25soldstatus $190,000
-
1987-10-21soldstatus $379,000
ⓘ Source: listings_history table (triggers on properties + properties_extension) + one-shot
backfill from property_details.listing_events for pre-trigger history.
Tax reassessment forecast CT · Partial reset (capped growth)
- Current annual tax
- $17,231 · $1,436/mo
- Projected year-2 tax
- $20,386 · $1,699/mo
- Expected delta
- +$3,154/yr (+$263/mo · 18.3%)
ⓘ Screening estimate from a state-policy table — verify with the county assessor before closing.
Climate risk First Street
- Flood 1/10 Low FEMA zone X (unshaded) · 0% chance over 30 yrs
- Wildfire 1/10 Low
- Heat 7/10 Severe 7 d/yr ≥99°F today · 16 d/yr by 30 yrs out
- Wind 6/10 Major 56% chance of damaging wind over 30 yrs
- Air quality 5/10 Major 6 unhealthy d/yr today · 8 by 30 yrs out
Nearby sold comps map
Loading sold comps map…
Walkable amenities ~0.75 mi
Loading nearby amenities…
Taxation est. · year 1
- Rental income
- $192,780
- − Mortgage interest
- −$61,617
- − Property taxes
- −$17,231
- − Insurance
- −$5,500
- − Repairs & maintenance
- −$15,422
- − Management
- −$15,422
- − Depreciation
- −$32,000
- Taxable income
- $45,587
- Est. tax owed @ 24.0%
- −$10,941
- After-tax cash flow
- $49,402/yr
For passive investors: Depreciation is non-cash, so a rental often shows a tax loss while cash-flowing — sheltering income. Rental losses are passive: they offset passive income freely, and up to $25,000/yr can offset ordinary (W-2) income if you actively participate and your MAGI is under $100k (phasing out to $0 by $150k); unused losses carry forward. On sale, claimed depreciation is recaptured at up to 25%, and gains may owe capital-gains tax (a 1031 exchange can defer both). Figures are a year-1 estimate at your 24.0% rate — not tax advice; consult a CPA.
Schools (NCES district)
- District
- New Haven School District
- NCES district ID
- 0902790
- Math proficiency
- 12% ▼ -10.00%
- Reading proficiency
- 25% ▼ -10.00%
- Median HH income
- $38,058
- Composite
- 15.48/100
- National rank
- #9308
- State rank
- #147 of 153 in CT
Livability — New Haven
- Score
- 79/100
- State rank
- #31
- US rank
- #2190
Category grades
Schools grade is shown separately in the Schools card above.
Census & demographics
- Census place
- New Haven, CT
- County
- New Haven County · 688,236 people
- City population
- 132,813
- Metro
- New Haven-Milford, CT
- Population (ZIP)
- 38,888
- Household income
- $48,500
- Rent vs Own
- Severe rent burden
- 2664.0
Population outlook (South Central Connecticut County) Hauer SSP2
- By 2040
- 608,362
Race, ethnicity, and origin ACS 2023
- Neighborhood character
- Diverse neighborhood (Simpson 0.66)
- Race & ethnicity
- Hispanic / Latino 47% White 26% Black 22% Two or more races 12% Asian 1%
- Hispanic origin (detail)
- Mexican 7% Puerto Rican 25% Dominican 2%
- Common ancestry
- Romanian 2% Lithuanian 1% Slovak 1%
- Foreign-born
- 17% · Canada, Jamaica, South Korea
- Languages at home
- 56% English-only · Spanish 39% Other Indo-European 1% Russian/Polish/Slavic 1%
Political lean MEDSL · South Central Connecticut
- 2024 margin
- Strong D (+20.1) · D 59.0% · R 38.9% · Other 2.1%
- All cycles
- 2024: D+20.1
Not yet ingested
- Civics
- —
Market trends
- HPI YoY
- ▼ -30.87%
- Current HPI
- 364.006
- Rent YoY
- ▲ 4.12%
- Metro
- New Haven-Milford, CT
- State GDP YoY
- ▲ 1.06%
- F500 in state
- 38
Industry mix (Fortune 500 HQ in CT)
| Industry | F500 HQs | Revenue |
|---|---|---|
| Industrial Machinery | 4 | $38B |
|
||
| Insurance | 3 | $71B |
|
||
| Financial Services | 2 | $25B |
|
||
| Transportation / Logistics | 2 | $18B |
|
||
| Healthcare | 1 | $247B |
|
||
| Telecommunications | 1 | $55B |
|
||
Price history
+190.2% since first listed37 events — show timeline
- 2026-03-20 Pending — Smart MLS
- 2026-02-10 Listed $1,100,000 Smart MLS
- 2026-01-31 Listing Removed — Smart MLS
- 2026-01-26 Relisted — Smart MLS
- 2026-01-05 Contingent — Smart MLS
- 2025-12-17 Price Changed $1,190,000 Smart MLS
- 2025-11-03 Price Changed $1,200,000 Smart MLS
- 2025-08-12 Listed $1,240,000 Smart MLS
- 2025-07-11 Listing Removed — Smart MLS
- 2025-03-25 Listed $1,250,000 Smart MLS
- 2025-02-19 Listing Removed — Smart MLS
- 2024-08-21 Listed $1,250,000 Smart MLS
- 2023-01-11 Listing Removed — Smart MLS
- 2023-01-05 Listed $1,300,000 Smart MLS
- 2015-03-13 Listing Removed — Smart MLS
- 2014-07-12 Listing Removed — Smart MLS
- 2014-06-12 Listed $250,000 Smart MLS
- 2013-07-11 Listed $250,000 Smart MLS
- 2012-10-28 Listing Removed — Smart MLS
- 2012-09-07 Listed $239,900 Smart MLS
- 2012-09-06 Listing Removed — Smart MLS
- 2012-07-18 Listing Removed — Smart MLS
- 2012-07-18 Listed $269,900 Smart MLS
- 2012-06-25 Listing Removed — Smart MLS
- 2012-06-25 Listed $274,900 Smart MLS
- 2012-02-02 Listed $299,900 Smart MLS
- 2012-02-01 Listing Removed — Smart MLS
- 2011-11-22 Listing Removed — Smart MLS
- 2011-11-22 Listed $319,900 Smart MLS
- 2011-10-29 Listed $359,900 Smart MLS
- 2011-04-02 Listing Removed — Smart MLS
- 2010-04-03 Listed $399,900 Smart MLS
- 2007-09-22 Listing Removed — Smart MLS
- 2007-03-23 Listed $649,000 Smart MLS
- 2004-04-29 Sold (Public Records) $375,000 Public Records
- 2002-09-25 Sold (Public Records) $190,000 Public Records
- 1987-10-21 Sold (Public Records) $379,000 Public Records
Property tax history
+4.4%/yrLatest (2023): $17,231 · -6.4% YoY. Source: county tax records.
Cash-flow waterfall
monthlySold comps — $/sqft
last 12 mo · ≤1 miLoading sold comps…