 Multi-family
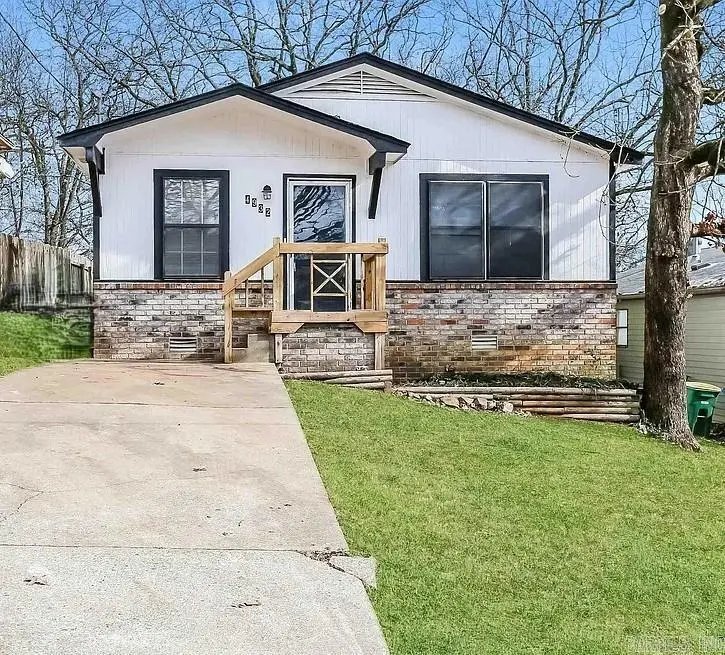
5 Home Investor Package · Little Rock, AR
Flood risk No data
- FEMA flood zone
- —
- Chance of flooding over 30 yrs
- —
- Est. flood insurance / yr
- —
Fire risk No data
- Est. fire insurance / yr
- —
Heat risk No data
- Hot days now (above threshold)
- —
- Hot days in 30 yrs
- —
Wind risk No data
- Chance of severe wind over 30 yrs
- —
Air-quality risk No data
- Unhealthy air days now
- —
- Unhealthy air days in 30 yrs
- —
Risk factors via First Street. Map © Google.
Why this score? — see what drove the F grade
The composite is a weighted blend of 9 inputs, each scored 0–100. Each bar is that input's sub-score; the figure is the points it added to the 100-point composite (weight × sub-score).
- Livability +3.7/5.0
- Rent growth +2.5/5.0
- ARV discount +2.3/15.0
- Condition / age +2.2/5.0
- Schools +2.1/10.0
- Cash flow +0.8/30.0
- 1% rule +0.0/10.0
- DSCR +0.0/10.0
- Appreciation +0.0/10.0
$599,000
🖨 Deal sheet 📄 Offer letter ✓ Due diligence
Multi-family units
County records classify this as Multi-Family (5+ Unit). Listing-text estimate: 1 unit. estimate disagrees with records
5+ unit building — per-unit beds/baths from public records are typically unavailable; the breakdown below (if shown) is an estimate from the listing text.
Listing remarks MLS
INVESTORS! Six single family detached homes. (4)Little Rock/(2)NLR. See agent remarks for addresses, rents, sq footage, beds, baths, etc. Information is deemed accurate but up to buyer to verify. To be sold as-is; buyers free to inspect.
Key facts
- Listed 149 days
Neighborhood map
What this means for you Summary
Snapshot
- This is a 17-bed/8.0-bath multifamily listed at $599k. Condition is rated fair.
Deal economics
- At list price, monthly cash flow is $-3k ($-30k/yr) — negative.
- To cash-flow at today's rent, offer at most $231k (61.4% below list).
- To meet the 1% rule (rent ≥ 1% of price), the offer needs to be $202k (66.2% below list).
- Recommended offer: $202k (66.2% below list) — sets the bar for 1% rule.
- Cap rate 1.2% vs local median 4.1% in Little Rock — below-typical yield; the buyer is paying a premium for something (appreciation thesis, condition, location) that the cap rate doesn't capture.
Location & tenants
- Location reads 73/100 on livability (#22 in AR) — a middle-class / working-renter tenant base. Strengths: commute A+, cost of living A+, housing A+; Watch: crime F.
- Little Rock School District (urban): math 23% / reading 26% proficiency, ranked #183 of 238 in AR (top 77%) — low school quality limits family demand, transient renter base, plan for 1-2y turnover; 69% free/reduced lunch — lower-income household profile, screen leases tightly.
- Market conditions: 92 active listings in the ZIP; solid renter incomes; 1,006 units permitted in Pulaski County in 2024 (0 in 5+ unit buildings).
Forward outlook
- Local home prices are declining (-3.0%/yr); year-one equity from $4k of loan paydown is wiped out by about $18k of value loss. Plan a longer hold.
- Pulaski County population projected at +6% by 2050 — modest demand growth; plan on rents tracking national, not racing it.
Negotiation context
- It's been on market 149 days — a 12% lower offer ($527k) is reasonable based on typical stale-listing flexibility.
Questions for the listing agent
- What do current leases actually rent for vs. the listed asking? Can we see a recent rent roll and the last 12 months of T-12 income?
- It's been on market 149 days. Have you received any prior offers? Is the seller open to a 66% concession, seller financing, or rate buy-down credit?
- Have any recent inspections been done? Can we get a copy of the seller's disclosures and any deferred-maintenance estimates?
- Why hasn't it sold? Are there any deal-killer items the seller is aware of (foundation, flood, title, zoning, code violations)?
- Is there a deadline driving the sale (1031 exchange, divorce, estate, relocation)? That informs how much negotiation room exists.
- Crime grade is F in this area — have there been break-ins, vandalism, or insurance claims at this property in the last 3 years? What carrier currently insures it and at what premium?
- The area grade is low — what's the realistic commute time and amenity access for the typical tenant pool here? Any planned neighborhood developments (good or bad) we should know about?
- What's the average days-on-market for RENTAL listings here right now (not sales)? A rising rental-DOM trend means longer vacancies and softer asking-rent achievability than the comps imply.
- What's the recent tenant-quality profile in this submarket — average credit score on applications, eviction rate, late-payment / NSF rate, and stable-employment percentage? A property-management company in the area should have these aggregated.
- How much new apartment / multifamily construction is in the pipeline within 1–3 miles? Heavy new supply (>2% of stock underway) typically softens rents 12–24 months out; light construction supports rent growth.
Investment metrics
- 1% rule
- 0.34% ✗
- Cap rate
- 1.20%
- Cash-on-cash
- -18.18%
- DSCR
- 0.19
- GRM
- 24.7
CMA / ARV
- ARV (median comp)
- $537,110
- List price
- $599,000
- Delta
- 11.52%
- Verdict
- OVERPRICED
- Comps
- 6 within 2.0 mi
Projected returns pro-forma
-3.0% appreciation · 3.0% rent growth · sell at horizon
- IRR
- -52.9%
- Equity multiple
- -0.54×
- Total profit
- $-258,844
- Equity at exit
- $89,313
- IRR
- —
- Equity multiple
- -1.59×
- Total profit
- $-433,631
- Equity at exit
- $51,791
Cash invested: $167,720 (down + closing). Projections, not guarantees.
Landlord ↔ Tenant lean methodology
- Overall (STATE)
- 92 Strongly Landlord-Friendly
- State Arkansas
- 92 Strongly Landlord-Friendly · R+14
- County
- — inherits STATE
- City
- — inherits STATE
ZIP-level market 72207
- Active inventory
- 92
- Price-to-rent
- 24.7×
Monthly cashflow live
- Estimated rent
- $2,024 medium interval (Pro) →
- Mortgage (P&I)
- −$3,141
- Tax est. 1.5%
- −$749 /mo · $8,985/yr
- Insurance
- −$250
- HOA
- −$0
- Vacancy / Maint / Mgmt
- −$425
- Net cashflow
- $-2,541
Break-even live
UW: 25.0% down · 7.5% · 30yr · 1.5% tax · 5.0% vac · 8.0% maint · 8.0% mgmt
Financing live
Cash to close
- Down payment
- $149,750
- Closing costs
- $17,970
- Reserves months
- —
- Total cash needed
- —
Loan-product check · same deal, 3 products live
Conventional
25% down · 7.5% · 30yr
- Down + closing
- —
- Monthly P&I
- —
- Monthly cashflow
- —
- DSCR
- —
- Eligible?
- —
Personal DTI + credit; lowest rate.
DSCR
20% down · 8.5% · 30yr
- Down + closing
- —
- Monthly P&I
- —
- Monthly cashflow
- —
- DSCR
- —
- Eligible?
- —
No personal income docs; deal must DSCR.
Hard money
10% down · 12.0% · 12mo
- Down + closing
- —
- Monthly P&I
- —
- Monthly cashflow
- —
- DSCR
- —
- Eligible?
- —
Short-term bridge; refi at stabilization.
Listing history 17 events
-
2026-06-18days on market $599,000 Active 149 DOM
-
2026-06-17days on market $599,000 Active 148 DOM
-
2026-06-16days on market $599,000 Active 147 DOM
-
2026-06-15days on market $599,000 Active 146 DOM
-
2026-06-14days on market $599,000 Active 144 DOM
-
2026-06-13days on market $599,000 Active 143 DOM
-
2026-06-10days on market $599,000 Active 141 DOM
-
2026-06-09days on market $599,000 Active 140 DOM
-
2026-06-08days on market $599,000 Active 139 DOM
-
2026-06-05days on market $599,000 Active 135 DOM
-
2026-06-03days on market $599,000 Active 134 DOM
-
2026-06-02days on market $599,000 Active 133 DOM
-
2026-06-01days on market $599,000 Active 132 DOM
-
2026-05-31days on market $599,000 Active 131 DOM
-
2026-05-31days on market $599,000 Active 130 DOM
-
2026-04-17price $599,000 237-char remark
Show marketing remark (237 chars)
INVESTORS! Six single family detached homes. (4)Little Rock/(2)NLR. See agent remarks for addresses, rents, sq footage, beds, baths, etc. Information is deemed accurate but up to buyer to verify. To be sold as-is; buyers free to inspect.
-
2026-01-20$749,000 New Listing 237-char remark
Show marketing remark (237 chars)
INVESTORS! Six single family detached homes. (4)Little Rock/(2)NLR. See agent remarks for addresses, rents, sq footage, beds, baths, etc. Information is deemed accurate but up to buyer to verify. To be sold as-is; buyers free to inspect.
ⓘ Source: listings_history table (triggers on properties + properties_extension) + one-shot
backfill from property_details.listing_events for pre-trigger history.
Nearby sold comps map
Loading sold comps map…
Walkable amenities ~0.75 mi
Loading nearby amenities…
Taxation est. · year 1
- Rental income
- $24,288
- − Mortgage interest
- −$33,553
- − Property taxes
- −$8,985
- − Insurance
- −$2,995
- − Repairs & maintenance
- −$1,943
- − Management
- −$1,943
- − Depreciation
- −$17,425
- Taxable loss
- −$42,557
- Est. tax savings @ 24.0%
- +$10,214
- After-tax cash flow
- $-20,273/yr
For passive investors: Depreciation is non-cash, so a rental often shows a tax loss while cash-flowing — sheltering income. Rental losses are passive: they offset passive income freely, and up to $25,000/yr can offset ordinary (W-2) income if you actively participate and your MAGI is under $100k (phasing out to $0 by $150k); unused losses carry forward. On sale, claimed depreciation is recaptured at up to 25%, and gains may owe capital-gains tax (a 1031 exchange can defer both). Figures are a year-1 estimate at your 24.0% rate — not tax advice; consult a CPA.
Condition & rehab AI · 6 photos
This multi-family property requires moderate rehabilitation, focusing on exterior repairs and landscaping to improve its resale and rental value.
Repairs flagged
- Major roof — Signs of wear and potential leaks
- Major siding — Worn and peeling
- Major landscaping — Overgrown and unkempt
Value-add opportunities
- Both paint exterior — Fresh paint can significantly improve curb appeal and value
- Both landscaping — Well-maintained landscaping enhances curb appeal and property value
- Both roof inspection — Ensures no structural damage and prevents future costly repairs
Renovation cost estimate screening
| Repair item | Severity | Est. cost |
|---|---|---|
| roof · Signs of wear and potential leaks | Major | $15,000–50,000 |
| siding · Worn and peeling | Major | $15,000–50,000 |
| landscaping · Overgrown and unkempt | Major | $15,000–50,000 |
| Total estimated repair cost · 3 items | $45,000–150,000 |
Value-add ROI direction
- Both paint exterior — Fresh paint can significantly improve curb appeal and value ↑
- Both landscaping — Well-maintained landscaping enhances curb appeal and property value ↑
- Both roof inspection — Ensures no structural damage and prevents future costly repairs ↑
ⓘ Cost ranges are severity-bucket heuristics (US national rule-of-thumb). Get contractor quotes + a written scope before underwriting a rehab budget.
Schools (NCES district)
- District
- Little Rock School District
- NCES district ID
- 0509000
- Math proficiency
- 23% ▼ -12.00%
- Reading proficiency
- 26% ▼ -8.00%
- Median HH income
- $43,346
- Composite
- 21.0/100
- National rank
- #8457
- State rank
- #183 of 238 in AR
Livability — Little Rock
- Score
- 73/100
- State rank
- #22
- US rank
- #5295
Category grades
Schools grade is shown separately in the Schools card above.
Census & demographics
- Census place
- Little Rock, AR
- County
- Pulaski County · 372,764 people
- City population
- 218,896
- Metro
- Little Rock-North Little Rock-Conway, AR
- Population (ZIP)
- 10,631
- Household income
- $96,343
- Rent vs Own
- Severe rent burden
- 260.0
Population outlook (Pulaski County) Hauer SSP2
- Today (2025)
- 415,378 people
- By 2030
- 423,720 · +2.0%
- By 2040
- 435,182 · +4.8%
- By 2050
- 440,904 · +6.1%
- By 2075
- 445,521 · +7.3%
- By 2100
- 419,173 · +0.9%
Race, ethnicity, and origin ACS 2023
- Neighborhood character
- Predominantly White (86%)
- Race & ethnicity
- White 86% Black 7% Two or more races 5% Hispanic / Latino 1%
- Common ancestry
- Slovak 4% Italian 3% Serbian 2%
- Foreign-born
- 2% · Canada
- Languages at home
- 98% English-only · Spanish 1%
Political lean MEDSL · Pulaski
- 2024 margin
- Strong D (+22.1) · D 59.8% · R 37.7% · Other 2.5%
- 2008→2024 swing
- +10.6pp toward D · 2008: 11.6pp · 2024: 22.1pp
- All cycles
- 2024: D+22.1 2020: D+22.5 2016: D+17.9 2012: D+11.4 2008: D+11.6
Not yet ingested
- Civics
- —
Market trends
- HPI YoY
- ▼ -420.06%
- Current HPI
- 261.6948
- Rent YoY
- —
- Metro
- Little Rock-North Little Rock-Conway, AR
- State GDP YoY
- ▲ 3.80%
- F500 in state
- 10
Industry mix (Fortune 500 HQ in AR)
| Industry | F500 HQs | Revenue |
|---|---|---|
| Retail | 1 | $681B |
|
||
| Food / Agriculture | 1 | $53B |
|
||
| Retail / Energy | 1 | $22B |
|
||
| Transportation / Logistics | 1 | $12B |
|
||
| Energy | 1 | $4B |
|
||
Price history
-20.0% since first listed2 events — show timeline
- 2026-04-17 Price Changed $599,000 CARMLS
- 2026-01-20 Listed $749,000 CARMLS
Cash-flow waterfall
monthlySold comps — $/sqft
last 12 mo · ≤1 miLoading sold comps…