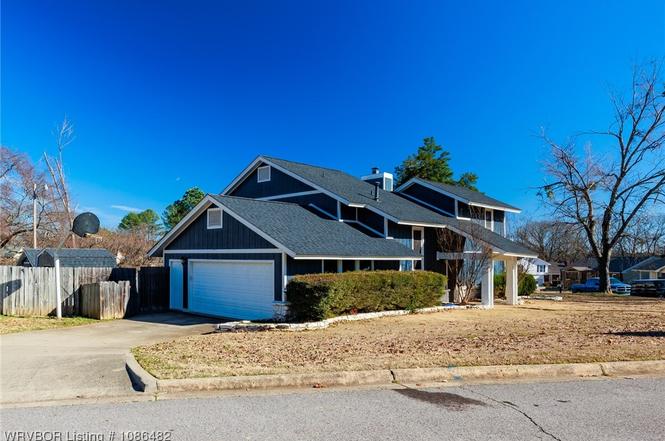
9201 Skypark Dr · Fort Smith, AR
Flood risk 1/10 · Minimal
- FEMA flood zone
- X (unshaded)
- Chance of flooding over 30 yrs
- 0.0%
- Est. flood insurance / yr
- $507 – $1,088
Fire risk 4/10 · Minor
- Est. fire insurance / yr
- $1,499 – $2,785
Heat risk 7/10 · Major
- Hot days now (above 111°F)
- 7 days/yr
- Hot days in 30 yrs
- 19 days/yr
Wind risk 2/10 · Minimal
- Chance of severe wind over 30 yrs
- 2.0%
Air-quality risk 2/10 · Minimal
- Unhealthy air days now
- 0 days/yr
- Unhealthy air days in 30 yrs
- 1 days/yr
Risk factors via First Street. Map © Google.
Why this score? — see what drove the D+ grade
The composite is a weighted blend of 9 inputs, each scored 0–100. Each bar is that input's sub-score; the figure is the points it added to the 100-point composite (weight × sub-score).
- ARV discount +15.0/15.0
- Cash flow +14.4/30.0
- DSCR +4.4/10.0
- Rent growth +3.7/5.0
- Livability +3.2/5.0
- Schools +3.1/10.0
- 1% rule +3.0/10.0
- Condition / age +2.5/5.0
- Appreciation +0.0/10.0
$199,000
🖨 Deal sheet (PDF) 📄 Offer letter ✓ Due diligence
Listing remarks MLS
This totally updated East side home features 3 bedrooms, 2 full baths, large living room w/ fireplace, eat-in kitchen w/ stainless steel refrigerator, 2 car garage, oval salt water pool w/ safety fence, a storage building & a pool house w/ half bath. This, home sets on a large corner lot that is professionally landscaped. Updates include all new paint, flooring, newer driveway, high efficiency windows, travertine tile, lighting, plumbing fixtures, etc.
Key facts
- In-ground pool
- Fenced yard
- Safety fence
Tags
Neighborhood map
What this means for you Summary
Snapshot
- This is a 3-bed/2.5-bath single-family listed at $199k.
Deal economics
- At list price, monthly cash flow is $39 ($472/yr) — positive.
- The deal already cash-flows at list — no discount required.
- To meet the 1% rule (rent ≥ 1% of price), the offer needs to be $160k (19.7% below list).
- Recommended offer: $160k (19.7% below list) — sets the bar for 1% rule.
- Cap rate 6.5% vs local median 4.3% in Fort Smith — top-decile yield for the area; either an underpriced asset or a hidden risk that comps aren't pricing in. Stress-test before assuming the spread holds.
Location & tenants
- Location reads 65/100 on livability (#151 in AR) — a middle-class / working-renter tenant base. Strengths: cost of living A+, housing A+, health & safety A+; Watch: crime F, amenities F, commute F.
- Fort Smith School District (urban): math 35% / reading 39% proficiency, ranked #106 of 238 in AR (top 44%) — families likely to look elsewhere, expect single-tenant / working-renter base with shorter leases; 64% free/reduced lunch — lower-income household profile, screen leases tightly.
- Zoned schools: John P. Woods Elem. School (math 64% / reading 61%, grade B, #30 of 454 statewide, top 6%, 487 students, 43% FRL); L. A. Chaffin Jr. High School (math 53% / reading 65%, grade B, #13 of 201 statewide, top 7%, 725 students, 54% FRL); Southside High School (math 36% / reading 53%, grade F, #31 of 292 statewide, top 12%, 1,956 students, 47% FRL) — zoned schools average 48% FRL vs 64% district-wide (16 pts lower); this property's tenant base skews higher-income than the district average.
- Zoned-school proficiency averages 55% at this address vs 37% district-wide (+18 pts) — the actual schools serving this property are materially stronger than the Fort Smith School District average implies; a family-tenant draw the district grade alone would hide.
- Market conditions: Rents rising fast (+4.9%/yr); 200 active listings in the ZIP; 11 comparable units currently listed for rent nearby; rentals at typical pace (median 23d on market — plan ~3-4 weeks tenant-placement turnaround); 388 units permitted in Sebastian County in 2024 (16 in 5+ unit buildings).
- This rent runs 31% of the median local income ($61k/yr) — at the standard rent-burdened threshold; future hikes will face affordability resistance.
Forward outlook
- Local home prices are declining (-3.0%/yr); year-one equity from $1k of loan paydown is wiped out by about $6k of value loss. Plan a longer hold.
- Sebastian County population projected at +7% by 2050 — modest demand growth; plan on rents tracking national, not racing it.
Negotiation context
- It's been on market 79 days — a 6% lower offer ($187k) is reasonable based on typical stale-listing flexibility.
- 3 sale attempts since 11y ago; this cycle's ask has dropped $50k (20%) from the opening price — seller is motivated, your offer sets the floor, not the list.
- Current owner paid $160k; 24% above their basis — modest negotiation headroom, anchor on the comps not their cost.
Risks & watch-outs
- Climate carrying-cost: extreme-heat days projected 7→19/yr by 2055 (HVAC capex compounding) — expect insurance premiums to compound above CPI over the hold.
Questions for the listing agent
- It's been on market 79 days. Have you received any prior offers? Is the seller open to a 20% concession, seller financing, or rate buy-down credit?
- Why hasn't it sold? Are there any deal-killer items the seller is aware of (foundation, flood, title, zoning, code violations)?
- Is there a deadline driving the sale (1031 exchange, divorce, estate, relocation)? That informs how much negotiation room exists.
- Schools are D-rated, which usually means shorter tenancies and higher turnover. Who's the typical renter profile here, and what's been the actual vacancy rate?
- Crime grade is F in this area — have there been break-ins, vandalism, or insurance claims at this property in the last 3 years? What carrier currently insures it and at what premium?
- The area grade is low — what's the realistic commute time and amenity access for the typical tenant pool here? Any planned neighborhood developments (good or bad) we should know about?
- What's the average days-on-market for RENTAL listings here right now (not sales)? A rising rental-DOM trend means longer vacancies and softer asking-rent achievability than the comps imply.
- What's the recent tenant-quality profile in this submarket — average credit score on applications, eviction rate, late-payment / NSF rate, and stable-employment percentage? A property-management company in the area should have these aggregated.
- How much new for-sale + rental construction is in the pipeline within 1–3 miles? Heavy new supply typically softens prices + rents 12–24 months out; constrained supply supports both.
Investment metrics
- 1% rule
- 0.80% ✗
- Cap rate
- 6.53%
- Cash-on-cash
- 0.85%
- DSCR
- 1.04
- GRM
- 10.4
CMA / ARV
- ARV (on-the-fly)
- $263,400
- Comps found
- 12
Show comp detail 12 sales within ~0.75 mi
| Address | Dist | Beds/Ba | Sqft | Sold | Price | $/sf | Match |
|---|---|---|---|---|---|---|---|
| 9201 Skypark Dr | 0.00mi | 3/2.5 | 1,756 (0%) | 1mo | $203,000 | $116 | 99 |
| 9712 East Pointe Dr | 0.32mi | 3/2.0 | 1,742 (-1%) | 1mo | $286,000 | $164 | 81 |
| 9135 Skypark Dr | 0.03mi | 3/2.0 | 1,631 (-7%) | 6mo | $200,000 | $123 | 80 |
| 9813 Shadow Branch Ln | 0.31mi | 3/2.0 | 1,732 (-1%) | 3mo | $282,000 | $163 | 79 |
| 8812 Skypark Dr | 0.26mi | 3/2.0 | 1,887 (+8%) | 0mo | $262,000 | $139 | 73 |
| 9100 Skypark Dr | 0.11mi | 3/2.0 | 1,571 (-10%) | 4mo | $175,000 | $111 | 72 |
| 9123 Skypark Dr | 0.04mi | 3/2.0 | 1,527 (-13%) | 3mo | $195,000 | $128 | 72 |
| 6100 Ironwood Ln | 0.63mi | 3/2.0 | 1,722 (-2%) | 6mo | $280,000 | $163 | 61 |
| 1906 Yukon Dr | 0.71mi | 3/2.0 | 1,738 (-1%) | 5mo | $260,000 | $150 | 59 |
| 6207 Red Cedar Cir | 0.57mi | 3/2.0 | 1,879 (+7%) | 4mo | $290,000 | $154 | 56 |
| 515 Buffalo Pass Pass | 0.68mi | 3/2.0 | 1,640 (-7%) | 3mo | $305,000 | $186 | 53 |
| 2500 Pine Ln | 0.59mi | 3/2.0 | 1,576 (-10%) | 5mo | $229,900 | $146 | 49 |
Match score weights: distance 35% · size 25% · config 20% · recency 20%. Top-matched comps best support the ARV.
Projected returns pro-forma
-3.0% appreciation · 4.9% rent growth · sell at horizon
- IRR
- -13.1%
- Equity multiple
- 0.52×
- Total profit
- $-26,699
- Equity at exit
- $29,672
- IRR
- -1.7%
- Equity multiple
- 0.87×
- Total profit
- $-7,025
- Equity at exit
- $17,206
Cash invested: $55,720 (down + closing). Projections, not guarantees.
Landlord ↔ Tenant lean methodology
- Overall (STATE)
- 92 Strongly Landlord-Friendly
- State Arkansas
- 92 Strongly Landlord-Friendly · R+14
- County
- — inherits STATE
- City
- — inherits STATE
ZIP-level market 72903
- Rents YoY
- 4.9%
- Active inventory
- 200
- Price-to-rent
- 10.4×
Monthly cashflow live
- Estimated rent
- $1,598 high interval (Pro) →
- Mortgage (P&I)
- −$1,044
- Tax from tax record
- −$97 /mo · $1,162/yr
- Insurance
- −$83
- HOA
- −$0
- Vacancy / Maint / Mgmt
- −$336
- Net cashflow
- $39
Break-even live
Sensitivity live
| Price | -10% $152 | -5% $96 | +0% $39 | +5% $-17 | +10% $-73 |
|---|---|---|---|---|---|
| Rent | -10% $-87 | -5% $-24 | +0% $39 | +5% $102 | +10% $166 |
| Rate | -1.0pp $140 | -0.5pp $90 | base $39 | +0.5pp $-12 | +1.0pp $-65 |
UW: 25.0% down · 7.5% · 30yr · 1.5% tax · 5.0% vac · 8.0% maint · 8.0% mgmt
Financing live
Cash to close
- Down payment
- $49,750
- Closing costs
- $5,970
- Reserves months
- —
- Total cash needed
- —
Loan-product check · same deal, 3 products live
Conventional
25% down · 7.5% · 30yr
- Down + closing
- —
- Monthly P&I
- —
- Monthly cashflow
- —
- DSCR
- —
- Eligible?
- —
Personal DTI + credit; lowest rate.
DSCR
20% down · 8.5% · 30yr
- Down + closing
- —
- Monthly P&I
- —
- Monthly cashflow
- —
- DSCR
- —
- Eligible?
- —
No personal income docs; deal must DSCR.
Hard money
10% down · 12.0% · 12mo
- Down + closing
- —
- Monthly P&I
- —
- Monthly cashflow
- —
- DSCR
- —
- Eligible?
- —
Short-term bridge; refi at stabilization.
Rent comps 11 comps
| Address | Beds | Baths | Sqft | Rent | $/sqft | DOM | Units | Dist |
|---|---|---|---|---|---|---|---|---|
| 8808 Timberlyn Way Fort Smith, AR | 3.0 | 2.0 | 1945 | $1,595 | $0.82 | 15d | 1 | 0.28mi |
| 1917 Yellowstone Dr Barling, AR | 3.0 | 2.0 | 1250 | $1,850 | $1.48 | 23d | 1 | 0.68mi |
| 1917 Casey Ct Barling, AR | 3.0 | 2.0 | 1250 | $1,495 | $1.20 | 15d | 1 | 0.68mi |
| 6605 Leightyn Ln Barling, AR | 3.0 | 2.0 | 1670 | $1,649 | $0.99 | 23d | 1 | 0.71mi |
| 9817 Mylea Cir Barling, AR | 3.0 | 2.0 | 1670 | $1,649 | $0.99 | 15d | 1 | 0.77mi |
| 6717 MARIBETTE Rd Barling, AR | 3.0 | 2.5 | 1650 | $1,649 | $1.00 | 23d | 1 | 0.80mi |
| 6803 MARIBETTE Rd Barling, AR | 3.0 | 2.5 | 1650 | $1,599 | $0.97 | 45d | 1 | 0.81mi |
| 1406 Strozier Ct Barling, AR | 3.0 | 2.0 | 1419 | $1,500 | $1.06 | 15d | 1 | 0.97mi |
| 6414 Huntington Ct Fort Smith, AR | 3.0 | 2.0 | 1430 | $1,575 | $1.10 | 15d | 1 | 1.13mi |
| 7827 Huntington Way Fort Smith, AR | 3.0 | 2.0 | 1433 | $1,600 | $1.12 | 23d | 1 | 1.20mi |
| 9313 Houston St Fort Smith, AR | 3.0 | 2.0 | 1536 | $1,600 | $1.04 | 23d | 1 | 1.36mi |
Listing history 13 events
-
2026-04-23status Pending
-
2026-04-09status Active
-
2026-04-09price $199,000
-
2026-03-25status Pending
-
2026-03-20price $215,000
-
2026-02-12price $239,000
-
2026-01-19$249,000 Active
-
2015-10-06soldstatus $159,900
-
2015-10-05soldstatus $159,900 462-char remark
Show marketing remark (462 chars)
This totally updated East side home features 3 bedrooms, 2 full baths, large living room w/ fireplace, eat-in kitchen w/ stainless steel refrigerator, 2 car garage, oval salt water pool w/ safety fence, a storage building & a pool house w/ half bath. This, home sets on a large corner lot that is professionally landscaped. Updates include all new paint, flooring, newer driveway, high efficiency windows, travertine tile, lighting, plumbing fixtures, etc.
-
2015-02-02$159,900 462-char remark
Show marketing remark (462 chars)
This totally updated East side home features 3 bedrooms, 2 full baths, large living room w/ fireplace, eat-in kitchen w/ stainless steel refrigerator, 2 car garage, oval salt water pool w/ safety fence, a storage building & a pool house w/ half bath. This, home sets on a large corner lot that is professionally landscaped. Updates include all new paint, flooring, newer driveway, high efficiency windows, travertine tile, lighting, plumbing fixtures, etc.
-
2012-08-01soldstatus $155,000
-
2000-05-08soldstatus $100,000
-
1996-01-03soldstatus $91,000
ⓘ Source: listings_history table (triggers on properties + properties_extension) + one-shot
backfill from property_details.listing_events for pre-trigger history.
Tax reassessment forecast AR · Resets to sale price
- Current annual tax
- $1,162 · $97/mo
- Projected year-2 tax
- $1,274 · $106/mo
- Expected delta
- +$112/yr (+$9/mo · 9.6%)
ⓘ Screening estimate from a state-policy table — verify with the county assessor before closing.
Climate risk First Street
- Flood 1/10 Low FEMA zone X (unshaded) · 0% chance over 30 yrs
- Wildfire 4/10 Moderate
- Heat 7/10 Severe 7 d/yr ≥111°F today · 19 d/yr by 30 yrs out
- Wind 2/10 Low 2% chance of damaging wind over 30 yrs
- Air quality 2/10 Low 0 unhealthy d/yr today · 1 by 30 yrs out
Nearby sold comps map
Loading sold comps map…
Walkable amenities ~0.75 mi
Loading nearby amenities…
Taxation est. · year 1
- Rental income
- $19,179
- − Mortgage interest
- −$11,147
- − Property taxes
- −$1,162
- − Insurance
- −$995
- − Repairs & maintenance
- −$1,534
- − Management
- −$1,534
- − Depreciation
- −$5,789
- Taxable loss
- −$2,983
- Est. tax savings @ 24.0%
- +$716
- After-tax cash flow
- $1,188/yr
For passive investors: Depreciation is non-cash, so a rental often shows a tax loss while cash-flowing — sheltering income. Rental losses are passive: they offset passive income freely, and up to $25,000/yr can offset ordinary (W-2) income if you actively participate and your MAGI is under $100k (phasing out to $0 by $150k); unused losses carry forward. On sale, claimed depreciation is recaptured at up to 25%, and gains may owe capital-gains tax (a 1031 exchange can defer both). Figures are a year-1 estimate at your 24.0% rate — not tax advice; consult a CPA.
Schools (NCES district)
- District
- Fort Smith School District
- NCES district ID
- 0506330
- Math proficiency
- 35% ▼ -11.00%
- Reading proficiency
- 39% ▼ -7.00%
- Median HH income
- $36,066
- Composite
- 30.66/100
- National rank
- #6183
- State rank
- #106 of 238 in AR
Livability — Fort Smith
- Score
- 65/100
- State rank
- #151
- US rank
- #13185
Category grades
Schools grade is shown separately in the Schools card above.
Census & demographics
- Census place
- Fort Smith, AR
- County
- Sebastian County · 99,312 people
- City population
- 94,356
- Metro
- Fort Smith, AR-OK
- Population (ZIP)
- 27,242
- Household income
- $61,434
- Rent vs Own
- Severe rent burden
- 1009.0
Population outlook (Sebastian County) Hauer SSP2
- Today (2025)
- 133,992 people
- By 2030
- 136,620 · +2.0%
- By 2040
- 140,832 · +5.1%
- By 2050
- 143,301 · +6.9%
- By 2075
- 147,964 · +10.4%
- By 2100
- 145,848 · +8.8%
Race, ethnicity, and origin ACS 2023
- Neighborhood character
- Predominantly White (71%)
- Race & ethnicity
- White 71% Hispanic / Latino 10% Two or more races 10% Black 8% Asian 3%
- Hispanic origin (detail)
- Mexican 7%
- Common ancestry
- Slovak 2% Serbian 2% Iranian 2%
- Foreign-born
- 5% · Canada, Vietnam
- Languages at home
- 90% English-only · Spanish 7% Vietnamese 2% Other Asian/Pacific 1%
Political lean MEDSL · Sebastian
- 2024 margin
- Solid R (+37.5) · D 30.0% · R 67.6% · Other 2.4%
- 2008→2024 swing
- -2.9pp toward R · 2008: -34.6pp · 2024: -37.5pp
- All cycles
- 2024: R+37.5 2020: R+35.5 2016: R+38.1 2012: R+37.1 2008: R+34.6
Not yet ingested
- Civics
- —
Market trends
- HPI YoY
- ▼ -183.19%
- Current HPI
- 201.125
- Rent YoY
- ▲ 4.90%
- Metro
- Fort Smith, AR-OK
- State GDP YoY
- ▲ 3.80%
- F500 in state
- 10
Industry mix (Fortune 500 HQ in AR)
| Industry | F500 HQs | Revenue |
|---|---|---|
| Retail | 1 | $681B |
|
||
| Food / Agriculture | 1 | $53B |
|
||
| Retail / Energy | 1 | $22B |
|
||
| Transportation / Logistics | 1 | $12B |
|
||
| Energy | 1 | $4B |
|
||
Price history
+118.7% since first listed13 events — show timeline
- 2026-04-23 Pending — WRVBOR
- 2026-04-09 Relisted — WRVBOR
- 2026-04-09 Price Changed $199,000 WRVBOR
- 2026-03-25 Pending — WRVBOR
- 2026-03-20 Price Changed $215,000 WRVBOR
- 2026-02-12 Price Changed $239,000 WRVBOR
- 2026-01-19 Listed $249,000 WRVBOR
- 2015-10-06 Sold (Public Records) $159,900 Public Records
- 2015-10-05 Sold (MLS) $159,900 WRVBOR
- 2015-02-02 Listed $159,900 WRVBOR
- 2012-08-01 Sold (Public Records) $155,000 Public Records
- 2000-05-08 Sold (Public Records) $100,000 Public Records
- 1996-01-03 Sold (Public Records) $91,000 Public Records
Property tax history
-2.6%/yrLatest (2025): $1,162 · -2.7% YoY. Source: county tax records.
Cash-flow waterfall
monthlySold comps — $/sqft
last 12 mo · ≤1 miLoading sold comps…